May 2023 Traffic Volume Trends
- Travel on all roads and streets changed by +2.5% (+7.1 billion vehicle miles) for May 2023 as compared with May 2022. Travel for the month is estimated to be 287.3 billion vehicle miles.
- The seasonally adjusted vehicle miles traveled for May 2023 is 269.3 billion miles, a 2.30% ( 6.1 billion vehicle miles) change over May 2022. It also represents a 0.8% change (2.1 billion vehicle miles) compared with April 2023.
- Cumulative Travel for 2023 changed by +2.1% (+26.8 billion vehicle miles). The cumulative estimate for the year is 1,296.0 billion vehicle miles of travel.
38.7
4.6%
62.1
2.3%
64.6
2.3%
61.0
1.7%
60.8
2.5%
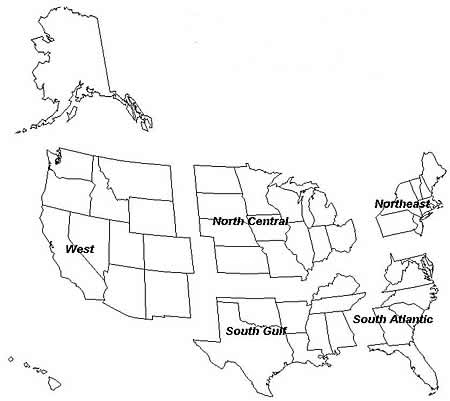
- Estimated Vehicle-Miles of Travel by Region - May 2023 - (in Billions)
- Change in Traffic as compared to same month last year.
| Region |
Total Travel |
Percentage Change |
| North-East |
38.7 |
4.6 |
| South-Atlantic |
62.1 |
2.3 |
| North-Central |
64.6 |
2.3 |
| South-Gulf |
61.0 |
1.7 |
| West |
60.8 |
2.5 |
Note:
All data for this month are preliminary. Revised values for the previous month are shown in Tables 1 and 2.
All vehicle-miles of travel computed with Highway Statistics 2021 Table VM-2 as a base.
Compiled with data on hand as of June 27,2023.
- Some historical data were revised based on HPMS and amended TVT data as of December 2021.
- For information on total licensed drivers in the U.S. visit http://www.fhwa.dot.gov/policy/ohpi/hss/hsspubs.htm.
Select the year of interest then Section 6 (Driver Licensing).
- For information on total registered motor vehicles in the U.S., visit http://www.fhwa.dot.gov/policy/ohpi/hss/hsspubs.htm
Select the year of interest and Section 7 (Motor Vehicles).
- To facilitate historic analysis, the VMT values for the seasonally adjusted series have been updated for the 12 months
prior to
the current month and in all other months, held at the value from last month's release.
- Travel Trends (May 2023)
- Estimated Monthly Motor Vehicle Travel in the U.S. for May 2023
- Changes on Rural Arterial Roads by Region and State
- Changes on Urban Arterial Roads by Region and State
- Changes on All Estimated Roads by Region and State
- Volume Trends - Rural
- Volume Trends - Urban
- Figure 1 - Moving 12-Month Total on All Roads
- Figure 2 - Travel on U.S. Highways by Month
- Figure 3 - Seasonally Adjusted Vehicle Miles Traveled by Month

