U.S. Department of Transportation
Federal Highway Administration
1200 New Jersey Avenue, SE
Washington, DC 20590
202-366-4000
Federal Highway Administration Research and Technology
Coordinating, Developing, and Delivering Highway Transportation Innovations
| REPORT |
| This report is an archived publication and may contain dated technical, contact, and link information |
|
| Publication Number: FHWA-HRT-15-063 Date: March 2017 |
Publication Number: FHWA-HRT-15-063 Date: March 2017 |
Similar to any other wave propagation problems, the proposed solution began with the classical equation of motion for a continuous medium as shown in figure 288.(101)
![]()
Figure 288. Equation. Equation of motion for a continuous medium.
Where:
σ = the stress tensor.
b = the vector of body forces per unit volume.
ρ = the mass density of the material.
u = the displacement vector.
According to the theory of linear elasticity, the stress-strain relationship for a linear, homogenous, and isotropic material is obtained from the generalized Hooke’s law, as shown in figure 289.
![]()
Figure 289. Equation. Stress-strain relationship for a linear, homogenous, and isotropic material.
Where:
ε = the strain tensor.
λ and μ = the lamé constants.
I = the identity tensor.
The strain tensor in figure 289 is related to the displacement vector according to the equation in figure 290.
![]()
Figure 290. Equation. Strain-displacement relationship for a linear, homogenous, and isotropic material.
For a viscoelastic material such as an AC mixture, the fundamental materials properties—in this case, the lamé constants—as well as the stresses and strains are time dependent and hence, their relationship can be written as the following in reference to the theory of linear viscoelasticity:(68,102,103)
![]()
Figure 291. Equation. Stress-strain relationship for a viscoelastic material.
Where the operator * between any function α * β represents the well-known Stieltjes convolution integral defined as shown in figure 292.

Figure 292. Equation. Stieltjes convolution integral.
Note that the kinematic strain-displacement relationship shown in the equation in figure 290 also applies to linear viscoelastic materials. The only difference from an elastic material is that the displacement and hence the strain are functions of not only the material (or spatial) coordinates but also time. Substituting the equations presented in figure 290 and figure 291 into the equation of motion shown in figure 288, and ignoring the body forces, results in the equation shown in figure 293 in terms of displacements:
![]()
Figure 293. Equation. Equation of motion in terms of displacements.
By means of the Helmholtz decomposition, the displacement vector in figure 293 can be expressed in terms of potentials as shown in figure 294.
![]()
Figure 294. Equation. Displacement vector in terms of potentials.
Where Φ represent a scalar potential, and H is a vector potential whose divergence vanishes (i.e., ∇ ∙ H = 0).
Similar to the spectral element solution provided by Al-Khoury et al., the cylindrical axisymmetric coordinate system shown in figure 295 is employed herein.(2)
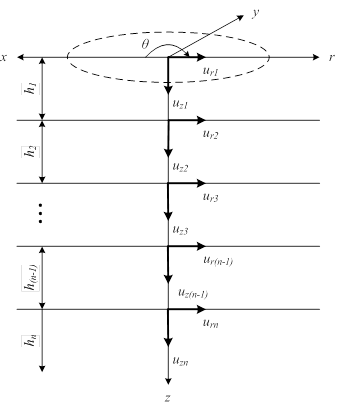
Figure 295. Diagram. Coordinate system for axisymmetric layers on a half-space.
Then, the equations shown in figure 296 and figure 297 are obtained for the potentials by substituting the equation in figure 294 into the equation in figure 293.

Figure 296. Equation. Equation of motion in terms of the scalar potential.

Figure 297. Equation. Equation of motion in terms of the vector potential.
Where Hθ is the tangential and also the only component of H that does not vanish. By defining Hθ as shown in figure 298, it can be shown that the scalar potential Ψ satisfies the wave equation shown in figure 299. The proof can be obtained immediately if the equation in figure 299 is differentiated with respect to r.(104)
![]()
Figure 298. Equation. Vector potential Hθ .

Figure 299. Equation. Scalar potential Ψ.
The equations in figure 296 and figure 299 are the wave equations that govern the axisymmetric wave motion in a continuous, linear viscoelastic medium. It is also worthwhile to note that if the lamé constants, λ and μ, were independent of time (i.e., the material is linear elastic), then the convolution integral in the equations reduce to an arithmetic multiplication and these two equations become the well-known axisymmetric wave equations for a linear elastic material.(104,105)
Another immediate consequence of adopting the axisymmetric coordinate system is that the displacement component in the tangential direction, uθ , vanishes.(105) The remaining deflections can be written in terms of the scalar potentials Φ and Ψ as shown in figure 300 and figure 301.
![]()
Figure 300. Equation. Relationship between radial displacement and potentials.
![]()
Figure 301. Equation. Relationship between vertical displacement and potentials.
The stresses can be written as shown in figure 302 and figure 303.

Figure 302. Equation. Relationship between shear stress and potentials.

Figure 303. Equation. Relationship between vertical stress and potentials.
The solution to the wave equations presented in the previous section can be worked more conveniently by using the integral transforms. Taking the Laplace transform of the equation in figure 296 results in the equation shown in figure 304.

Figure 304. Equation. Equation of motion in terms of the scalar potential Φ in the Laplace domain.
Where s is the Laplace variable, and ![]() is the Laplace transform of a function f(t). Then, taking the Hankel transform (also known as the Fourier-Bessel transform) of order zero defined as
is the Laplace transform of a function f(t). Then, taking the Hankel transform (also known as the Fourier-Bessel transform) of order zero defined as ![]() of the equation in figure 304, the equation in figure 305 is obtained.
of the equation in figure 304, the equation in figure 305 is obtained.
![]()
Figure 305. Equation. Equation of motion in terms of the scalar potential Φ in the Laplace-Hankel domain.
After a simple rearrangement of the terms, figure 305 can be written as shown in figure 306.

Figure 306. Equation. Simplified form of the equation in figure 305.
From the equation in figure 306, the solution for the Laplace-Hankel transformed potential function,
![]() , is obtained as shown in figure 307, after dropping the term that develops an unbounded result, i.e., the wave that propagates in the negative z direction.(104,105)
, is obtained as shown in figure 307, after dropping the term that develops an unbounded result, i.e., the wave that propagates in the negative z direction.(104,105)

Figure 307. Equation. General form solution of the equation in figure 306.
Where A is an arbitrary constant.
By following the same mathematical steps shown above, the equation in figure 299 can be rewritten as shown in figure 308.

Figure 308. Equation. Equation of motion in terms of the scalar potential Ψ in the Laplace-Hankel domain.
Again, after dropping the term leading to unbounded results, the solution for the transformed potential, ![]() , is obtained as shown in figure 209.
, is obtained as shown in figure 209.

Figure 309. Equation. General form solution of the equation in figure 306.
Where C is also an arbitrary constant.
To use the solutions obtained above for the transformed potentials, it is also necessary to acquire the equations for the displacements and the stresses in the transformed domain. While taking the Laplace transform of the displacements and the stresses is straightforward, additional attention is needed in taking the Hankel transform because of the spatial symmetry supplied by the cylindrical coordinate system adopted for the solution. Referring back to figure 295, one finds that the displacement at any point on the z-axis (i.e., when r = 0) is only allowed to occur in the z-direction (i.e., uz ≠ 0 when r = 0) but is confined in the r-direction (i.e., ur = 0 when r = 0), unless the axisymmetric assumption is to be violated. Because of these physical characteristics of the axisymmetric displacements, Hankel transforms of different orders need to be applied to ur and uz.
Figure 310 shows the first few cycles of the Bessel functions of the first kind and of orders zero (J0) and one (J1) that make up the kernels of the Hankel transform. The primary difference between the two Bessel functions shown in the figure is that while the Bessel function of order zero (J0) has a nonzero value at r = 0, the Bessel function of order one (J1) is equal to zero when r = 0. This implies that the Hankel transform of order zero whose kernel is composed of J0 is appropriate for transforming the functions that exhibit nonzero values at the origin, whereas the Hankel transform of order one whose kernel is made up of J1 is more appropriate for transforming the functions that have zero values at r = 0. Therefore, the appropriate Hankel transforms that should be applied to ur and uz are of orders one and zero, respectively.
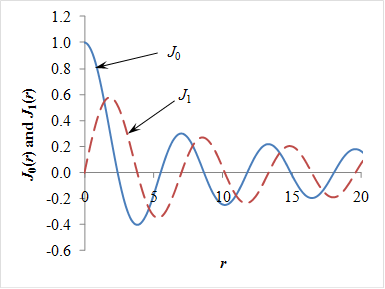
Figure 310. Graph. Bessel functions of the first kind.
Taking the Laplace and the respective Hankel transforms on the displacements ur and uz, shown in figure 300 and figure 301 results in the equations shown in figure 311 and figure 312, respectively.
![]()
Figure 311. Equation. Relationship between radial displacement and potentials in the Laplace-Hankel domain.
![]()
Figure 312. Equation. Relationship between vertical displacement and potentials in the Laplace-Hankel domain.
Note that although the Hankel transform of order one was used to transform ur shown in figure 300, the Hankel transform of the potentials shown in figure 311 is still of order zero. This is a consequence of the partial derivative with respect to r that is present in both terms of the right-hand side of the equation in figure 300 and the property of the Hankel transform shown in figure 313, which associates the first order transform of a function’s derivative to the zero order transform of the original function.(105,106)
![]()
Figure 313. Equation. Hankel transform of a function’s derivative.
Subsequently, the Laplace-Hankel transforms need to be carried out on the relevant stresses. Based on the same mathematical arguments presented above for the displacements, the Hankel transforms of orders one and zero should be applied respectively to σrz and σz to allow for a solution that is compatible with the axisymmetric coordinate system chosen for the solution. After simplifying, the equations shown in figure 314 and figure 315 are obtained.
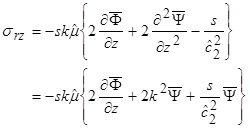
Figure 314. Equation. Relationship between shear stress and potentials in the Laplace-Hankel domain.
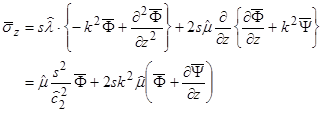
Figure 315. Equation. Relationship between vertical stress and potentials in the Laplace-Hankel domain.
The solutions presented in the previous section for the scalar potentials in the transformed domain are not readily applicable for a multilayered system such as the one shown in figure 295. To allow for the analysis of a layered system such as an AC pavement, it is necessary to develop the formulations for the layer elements whose underlying concept originates from the FEA method. In this section, two types of layer elements are developed—a two-noded element for a layer with a finite thickness (e.g., the top layer in figure 295) and a one-noded element for simulation of a semi-infinite half-space (e.g., the bottom layer in figure 295).
The solutions for the scalar potentials shown in the equations in figure 307 and figure 309 only account for the incident waves that propagate from the upper boundary of a layer in the direction of the positive z-axis, i.e., downward direction in figure 295. However, a layer with a finite thickness also encompasses the waves that reflect from the lower boundary and propagate in the direction of the negative z-axis. To account for these reflected waves, an additional term must be added to each of the potentials, which results in the equations in
![]()
figure 316 and figure 317.
![]()
Figure 316. Equation. Scalar potential Φ in the Laplace-Hankel domain.
![]()
Figure 317. Equation. Scalar potential Ψ in the Laplace-Hankel domain.
Where B and D are arbitrary constants, and h is the layer thickness. Substituting these equations into the equations in figure 311 and figure 312 results in the equations for the displacements within a two-noded element shown in figure 318 and figure 319.
![]()
Figure 318. Equation. Radial displacement in the Laplace-Hankel domain.
![]()
Figure 319. Equation. Vertical displacement in the Laplace-Hankel domain.
For the formulation of a layer element, the displacements at the upper and lower boundaries need to be extracted from these equations. The radial and the vertical displacements at the upper boundary, denoted respectively as ![]() r1 and
r1 and ![]() z1, can be obtained by substituting z = 0 in the equations in figure 318 and figure 319. Similarly, the displacements at the lower boundary (
z1, can be obtained by substituting z = 0 in the equations in figure 318 and figure 319. Similarly, the displacements at the lower boundary (![]() r2 and
r2 and ![]() z2) are acquired by substituting z = h. In matrix form, the resulting equations for the displacements can be written as shown in figure 320.
z2) are acquired by substituting z = h. In matrix form, the resulting equations for the displacements can be written as shown in figure 320.

Figure 320. Equation. Relationship between shape factors and boundary conditions.
It is also necessary to obtain the equations for the stresses. By substituting the equations shown in
![]()
figure 316 and figure 317 into the equations shown in figure 314 and figure 315, one arrives at the following equations shown in figure 321.

Figure 321. Equation. Shear and vertical stress in the Laplace-Hankel domain.
Again, the stresses at the upper boundary (![]() rz1 and
rz1 and ![]() z1) are obtained by substituting z = 0 in the equations shown in figure 321, while those at the lower boundary (
z1) are obtained by substituting z = 0 in the equations shown in figure 321, while those at the lower boundary (![]() rz2 and
rz2 and ![]() z2) are found by substituting z = h, all of which can be summarized in a matrix form as shown in figure 322.
z2) are found by substituting z = h, all of which can be summarized in a matrix form as shown in figure 322.

Figure 322. Equation. Relationship between stresses and shape factors.
Combining the equations shown in figure 320 and figure 322 by eliminating the vector of arbitrary constants, the stresses can be expressed in terms of the displacements as the equation shown in figure 323.

Figure 323. Equation. Stress-displacement relationship in the Laplace-Hankel domain.
Where S1 and S2 are the four by four matrices defined in the equations shown in figure 320 and figure 322, respectively. According to the concepts of FEA, the stiffness matrix of an element defines the relationship between the displacement vector and the boundary traction vector. Owing to the Cauchy stress principle, the boundary tractions are obtained by taking the dot product between the stress tensor and a unit vector directed along the outward normal of the boundary. Calculating these tractions at the upper and lower boundaries of the element and reorganizing them in a vector form results in the relationship between the tractions, stresses, and displacements shown in figure 324.
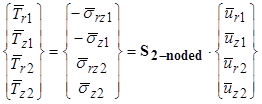
Figure 324. Equation. Relationship between the tractions, stresses, and displacements.
From figure 324, it is seen that the four by four matrix S2-noded is the stiffness matrix of the two-noded layer element which is calculated as shown in figure 325.

Figure 325. Equation. Local stiffness matrix of the two-noded layer element.
The axisymmetric one-noded element was schematically shown as the bottom layer in figure 295. As shown in that figure and as its name implies, the one-noded element has only a single boundary at the top of the layer and extends infinitely in all other directions. As a consequence, the waves in this element are only allowed to propagate away from the upper boundary (which is also the only boundary) without any waves reflecting back. Therefore, the solutions for the scalar potentials shown in the equations of figure 307 and figure 309 can be used without any modifications. Substituting these two equations into the equations shown in figure 311 and figure 312 results in the displacements shown in figure 326 and figure 327.
![]()
Figure 326. Equation. Radial displacement of a one-noded layer element.
![]()
Figure 327. Equation. Vertical displacement of a one-noded layer element.
The displacements at the boundary are obtained by substituting z = 0 in these equations and can be written as the matrix form shown in figure 328.

Figure 328. Equation. Displacements at the boundary of a one-noded layer element.
Again, the equations for the shear and normal stresses are obtained by substituting the potentials (equations shown in figure 307 and figure 309) into the equations figure 314 and figure 315, respectively, to produce the equations in figure 329 and figure 330.
![]()
Figure 329. Equation. Shear stress of a one-noded layer element.
![]()
Figure 330. Equation. Vertical stress of a one-noded layer element.
Substituting z = 0 in the equations shown in figure 329 and figure 330 results in the stresses at the boundary shown in figure 331.

Figure 331. Equation. Stresses at the boundary of a one-noded layer element.
From the equations shown in figure 328 and figure 331, the relationship shown in figure 332 is attained between the stresses and the displacements.

Figure 332. Equation. Stress-displacements relationship at the boundary of a one-noded layer element.
Where S3 and S4 were defined in the equations shown in figure 329 and figure 331, respectively. By applying the Cauchy stress principle, the relationship shown in figure 333 is achieved between the tractions, stresses, and displacements.

Figure 333. Equation. Relationship between the tractions, stresses, and displacements at the boundary of a one-noded layer element.
Where the stiffness matrix for the one-noded element can be written in terms of the previously defined variables as the equation shown in figure 334.
![]()
Figure 334. Equation. Local stiffness matrix of the one-noded layer element.
For a homogenous, isotropic, elastic material whose properties are independent of time, the relationship between the elastic modulus, E, and the lamé constant, μ, is given by the theory of linear elasticity as the equation in figure 335.
![]()
Figure 335. Equation. Relationship between the elastic modulus (E) and the lamé constant
(μ) for homogenous, isotropic, elastic material.
![]()
Figure 336. Equation. Laplace transform of the equation in figure 335.
However, as it was noted by the pioneer of the spectral element method for layered media Stephen Rizzi, it is advantageous to add a small amount of damping to the lamé constant, μ because no realistic material is purely elastic.(107) Following Rizzi, this artificial damping can be added to the above lamé constant as shown in figure 337.(107)
![]()
Figure 337. Equation. Lamé constant for elastic material.
Where ς is the damping constant. To simulate the wave propagation through an elastic layer, the simple equation in figure 337 can be substituted into the equations for the layer elements presented earlier. To incorporate the viscoelastic material effects into the solution derived in the previous sections, it is necessary to adopt a simple function that is capable of representing the fundamental property of a viscoelastic material analytically. In addition, because all of the time-dependent variables, including stresses, displacements, and material properties (i.e., lamé constants), were transformed into the Laplace domain, it is preferable to choose a function that is easily transformable into the Laplace domain. Among the analytical functions described in chapter 3, the Prony series has been selected because it maintains a simple form while representing the viscoelastic property effectively. Again, this function is expressed as shown in figure 338.
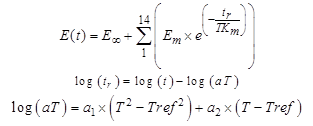
Figure 338. Equation. Prony series.
Where:
Em and TKm = the Prony series parameters.
aT, a1, and a2 are the shift factor and its coefficients.
T and Tref are the temperature and the reference temperature.
Taking the Laplace transform of the equation in figure 338 results in the equation shown in figure 339.

Figure 339. Equation. Prony series in the Laplace domain.
For viscoelastic material, the Poisson’s ratio is also time dependent. However, the Poisson’s ratio has typically been assumed to be a time-independent constant in past literature.(27) In addition, Lee and Kim showed that assuming a reasonable constant value for the Poisson’s ratio still results in accurate viscoelastic responses.(108) The assumption of a constant Poisson’s ratio implies that the time-dependent behavior of a viscoelastic material in shear or bulk is identical to the behavior in uniaxial mode, and simplifies the solution significantly.(109) With this assumption, the relationship between the viscoelastic lamé constant and the uniaxial relaxation modulus shown in figure 339 is found to be that shown in figure 340.
![]()
Figure 340. Equation. Relationship between the elastic modulus (E) and the lamé constant
(μ) for viscoelastic material.
After the stiffness matrices have been obtained for all the layers that make up the structure, the global stiffness matrix can be constructed in the same way as the traditional FEA methods.(110) An in-depth explanation of the concept of the FEA as well as the relationship between the element and the global stiffness matrices is beyond the scope of this project. Hence, it is not explained herein, and interested readers are referred to a variety of textbooks available on this subject. In this appendix, only the generic conceptual schematics are outlined, and the discussion is kept to a minimum for conciseness of the report. Figure 341 shows the schematics of the global stiffness matrices for the two types of layered structures that are most widely adopted for modeling a pavement system.
Figure 341 shows how the global stiffness matrix is constructed for a layered system resting on a half-space. As previously mentioned, this pavement model is capable of dissipating the energy geometrically through the one-noded half-space and is generally used for simulating the FWD time histories that do not show free vibration at the end of the loading.
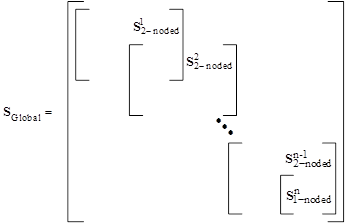
Figure 341. Equation. Construction of the global stiffness matrix for structures with a half-space.
Upon constructing the global stiffness matrix, the displacements at the system nodes can be found from the equation shown in figure 342.

Figure 342. Equation. The displacement at the system nodes.
![]() is a vector of system displacements to be calculated in global coordinates with
is a vector of system displacements to be calculated in global coordinates with ![]() ri and
ri and ![]() zi being the radial and vertical
displacements at the ith node from the top, respectively. Similarly,
zi being the radial and vertical
displacements at the ith node from the top, respectively. Similarly, ![]() is a nodal force vector in global coordinates, with the radial and vertical forces at the ith node denoted as
is a nodal force vector in global coordinates, with the radial and vertical forces at the ith node denoted as
![]() ri and
ri and ![]() zi, respectively. The nodal forces in this vector should be obtained from the boundary conditions as presented in the next section.
zi, respectively. The nodal forces in this vector should be obtained from the boundary conditions as presented in the next section.
For the problem in hand where the loading is induced by an impact of a falling weight at the ground surface, all components of ![]() in figure 342 vanish except for
in figure 342 vanish except for ![]() z1. In other words, the only external load applied to the system is in the vertical direction at the top node (node 1). In this project, this surface force is also in the form of a unit impulse load acting over a circular area, for the reasons explained in the System Response to Arbitrary Loading section. In the physical time and spatial domain, this boundary condition is mathematically expressed as shown in figure 343.
z1. In other words, the only external load applied to the system is in the vertical direction at the top node (node 1). In this project, this surface force is also in the form of a unit impulse load acting over a circular area, for the reasons explained in the System Response to Arbitrary Loading section. In the physical time and spatial domain, this boundary condition is mathematically expressed as shown in figure 343.

Figure 343. Equation. Boundary conditions.
Where δ(t) is the Dirac delta function for the impulse loading, and a is the radius of the circular loaded area. However, note that the stiffness matrices were previously derived in the Laplace-Hankel domain rather than the physical domain. Therefore, it is also necessary to convert the above boundary condition into the one in the transformed domain. Because the Laplace transform of δ(t) is equal to 1, taking the Laplace-Hankel transforms of the equation shown in figure 343 simply results in the equation shown in figure 344.
![]()
Figure 344. Equation. Boundary conditions in the Laplace-Hankel domain.
As mentioned, the displacements at all nodes of the system can be obtained through the equations shown in figure 342 from the global stiffness matrix and the force boundary condition described in the previous sections. Note again that the displacements obtained in this manner are in the Laplace-Hankel domain and need to be inverse transformed back to the physical domain. However, it has been shown that even for an elastic half-space (which simply has a single boundary) subjected to a point load, the closed form inversion of the Laplace-Hankel transformed displacement is rather complicated and is close to impossible for a generalized problem .(105) Therefore, the closed form inversion of the displacements obtained from the equations shown in figure 342 is not even attempted because of the mathematical complexity arising from the viscoelastic material behavior and the wave propagation phenomenon. Instead, the inversion is carried out numerically for both the Laplace and Hankel transforms.
As mentioned earlier, Hankel transforms of orders zero and one were used to transform the vertical and radial displacements, respectively. Therefore, the inverse Hankel transform of respective orders must be carried out for the two displacements. In this appendix, the numerical integration scheme is outlined for the vertical displacement (i.e., the inverse Hankel transform of order zero). The inverse transform of the radial displacement can also be evaluated in a similar manner. The closed form equation for the inverse Hankel transform of the vertical displacement at node i is given as the equation in figure 345.

Figure 345. Equation. Inverse Hankel transform of the vertical displacement.
This integral can also be written as the series of integrals shown in figure 346.

Figure 346. Equation. Inverse Hankel transform as a series of integrals.
Then, each integral in the right-hand side of the equation in figure 346 must be evaluated numerically. Upon selecting the six-point Gaussian quadrature as the numerical scheme to use, the integral in the Figure 346 can be evaluated as shown in figure 347.(111)

Figure 347. Equation. Evaluation of the inverse Hankel transform using six-point Gaussian quadrature scheme.
Where xp and wp are the Gaussian nodes and their corresponding weights, respectively.
The parameter bn defines the limits for each integration, which can be chosen arbitrarily. However, Cornille indicated that the convergence of the Gaussian quadrature would be greatly improved if the limits were selected to be the successive roots of the derivative of the Bessel function that comprised the kernel of the inverse transform.(112) Based on a sensitivity analysis conducted by the research team for this project, subdividing the region between the successive roots of the Bessel function of order one (that is, the derivative of the Bessel function of order zero) into 10 smaller regions of equal intervals provided satisfactory results for the numerical integration.
Note that the upper bound of the integral shown in figure 345 is equal to infinity. This indicates that the summation of integrals shown in figure 346 should also span an infinite range. However, as was indicated by Kim, the numerical integration converges very rapidly even after the first few cycles of the Bessel function comprising the kernel of the inverse Hankel transform.(96) Therefore, in Kim’s static solution for a viscoelastic layered system, the first five cycles of the Bessel function were used to invert the Hankel transform near the loaded area, and fewer cycles were used in the region far from the loading.(96) The developers of the axisymmetric spectral element method used the Fourier-Bessel series (which is the discrete version of the Hankel transform) in their solution and the summation was also carried out for approximately the first five cycles of the Bessel function.(2) Although the details are omitted for this report, the sensitivity analysis performed for the proposed algorithm also showed that the numerical integration over the first five cycles of the Bessel function is adequate for the solution.
For the inverse Laplace transform, a multiprecision numerical scheme known as the Fixed Talbot Algorithm is adopted in this report because of its efficiency, accuracy, and ease for implementation.(113) The Bromwich integral is the standard equation for the inverse Laplace transform is given by figure 348.

Figure 348. Equation. Bromwich integral.
Where ![]() . The contour B, chosen for the above integral, is along the path shown in figure 349.
. The contour B, chosen for the above integral, is along the path shown in figure 349.

Figure 349. Equation. The contour for the Bromwich integral.
In figure 349, M is the number of precision decimal digits to be used for the numerical analysis. For the sake of accuracy, this value is specified to be equal to the machine precision. Replacing the contour path in figure 348 with the one shown in figure 349 produces the result shown in figure 350:

Figure 350. Equation. Bromwich integral along the chosen contour path.
Finally, the inverse Laplace transform is obtained by approximating the integral shown in figure 350 through the trapezoidal rule shown in figure 351.

Figure 351. Equation. Evaluation of Bromwich integral through the trapezoidal rule.
As described in the equations shown in figure 343, the boundary condition considered in the previous sections was for a unit impulse load distributed over a circular area. As such, the vertical displacement, Uzi, obtained using the equation shown in figure 351 represents the unit impulse response of the layered system in time domain. The primary advantage of the time-domain unit impulse response is that the system response to any arbitrary loading can be obtained through the convolution integral.(114,3) Theoretically, this convolution integral for a continuous function is given as shown in figure 352.

Figure 352. Equation. Convolution integral for a continuous function.
Where T(t) could be any arbitrary time-dependent loading function, and yzi(t) is the corresponding vertical displacement at node i. For a discrete signal such an FWD time history, figure 352 must evaluated numerically as shown in figure 353.(114,3)

Figure 353. Equation. Numerical evaluation of the convolution integral.
Where Δt is time interval of the discrete signal, and tn = nΔt for an integer n.