U.S. Department of Transportation
Federal Highway Administration
1200 New Jersey Avenue, SE
Washington, DC 20590
202-366-4000
Federal Highway Administration Research and Technology
Coordinating, Developing, and Delivering Highway Transportation Innovations
| REPORT |
| This report is an archived publication and may contain dated technical, contact, and link information |
|
| Publication Number: FHWA-HRT-16-053 Date: October 2016 |
Publication Number: FHWA-HRT-16-053 Date: October 2016 |
The pavement remaining service interval (RSI) terminology was developed to eliminate the ambiguity associated with the multitude of meanings assigned to the various forms of pavement remaining life terminology. Since pavements are repairable systems, the use of the word “life” is improper because pavements do not “die;” correctable component failures do not define system life. While the basis of the concept was a shift in terminology, it required further development and refinement of computational algorithms and presentation techniques in order to find acceptance in practice.
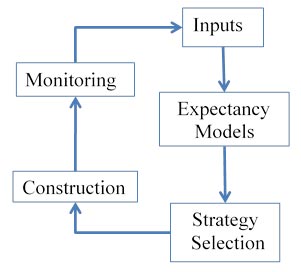
The RSI concept was developed through the previous Federal Highway Administration (FHWA) project, “Definition and Determination of Remaining Service and Structural Life.” The report that resulted from that project—Reformulated Pavement Remaining Service Life Framework—details the basic research technique of going back to first principles and defining the actual problem to be addressed.(1) The findings from this first-principles approach caused a radical shift away from further development of pavement remaining life approaches in favor of exploring replacement terminology that better described the different levels of pavement repair. The replacement terminology, RSI, was developed using the process illustrated in figure 1. The RSI concept considers the complete maintenance and rehabilitation (M&R) activity of the pavement system and does not simply consider the end of life as promulgated by the remaining service life (RSL) philosophy.

Figure 1. Illustration. Future pavement construction needs process.(1)
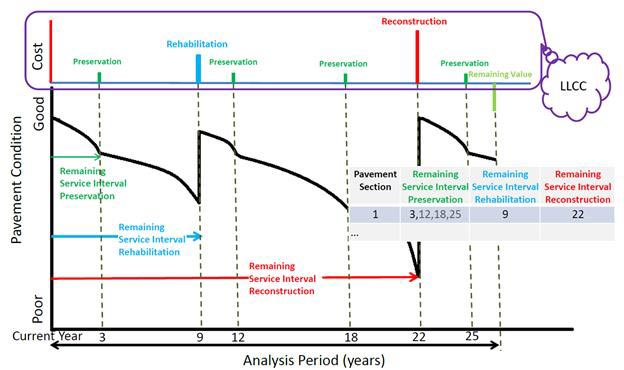
Figure 2 illustrates the RSI concept using limits for preservation, rehabilitation, and reconstruction. Starting with the current pavement condition, the preservation RSI is the time until the expectancy curve reaches the preservation limit. The rehabilitation RSI is the time until the expectancy curve reaches the rehabilitation limit with consideration to appropriate timed preservations treatments. Similarly, reconstruction RSI is the time until the expectancy curve reaches the reconstruction limit with consideration to appropriately timed preservation and rehabilitation treatments. In this figure, the pavement section has three RSI numerics based on pavement condition: RSIPreservation, RSIRehabilitation, and RSIReconstruction. These limits represent condition thresholds below which the corresponding treatment will not be efficient for preservation and rehabilitation. This figure also illustrates some of the issues to be investigated in this study, including the following:

LLCC = Lowest lifecycle cost.
Figure 2. Illustration. Pavement RSI concept.
With the passing of the Moving Ahead for Progress in the 21st Century Act in July 2012 emphasizing total asset management and the subsequent Fixing America’s Surface Transportation Act passed in December 2015, the RSI concept is poised to help agencies use best practices with the goal of an ideal asset management and pavement management approach.(2,3) The RSI concept allows for agencies to optimize their investments based on the optimum timing to place a treatment instead of being threshold driven.
The goal of this project was to demonstrate and further develop the application of the pavement RSI concept using data from two State pavement management systems (PMSs) and the Highway Performance Monitoring System (HPMS) 2010+ dataset. The specific objectives of the project were as follows:
The overall validation approach was to develop a general RSI algorithm and then implement the RSI using available data, models, and business rules. Within this approach, the benefits and limitations of the RSI were made clear, and the recommendations that were developed had direct implications for the current state of practice. However, when beginning the validation of the RSI, it became quickly evident that more fundamental questions related to pavement management practice needed to be resolved, including the influence of analysis periods on optimized maintenance strategies and the inclusion of structural measures to performance prediction. Therefore, the work presented in this report goes beyond simply validating the RSI concept; it includes research that is more fundamental to pavement management practices.
Although the initial project approach was to only consider State validation using two State transportation department PMSs (network level) and a national-level validation using HPMS 2010+ data and the Pavement Health Track (PHT) analysis tool (strategic level), through the course of the project, project-level analysis was also added to address gaps in the network and strategic level analyses.(4) The project level analysis validated the RSI concept using Long-Term Pavement Performance (LTPP) Program data and the mechanistic-empirical pavement analysis software developed by the California Department of Transportation (CalME) to show functionality and what can be achieved at the network and strategic levels through the RSI concept.(5) As a result, this report documents the application of the process at the project, network, and strategic levels.
The approach for validating the RSI evolved throughout this project, as is described in this report. Initially, an RSI algorithm was developed and then data and models were pursued at the network level from State transportation departments and at the strategic level using the HPMS and PHT analysis tool. However, as is discussed in chapters 2 and 3, this validation approach required revision. For example, it was found that the available models at the strategic level did not support the validation approach (see chapter 3). In addition, the project-level evaluation, which is detailed in chapter 4, was included in an effort to show more specific applications of the RSI. Finally, the initial validation approach at the network levelexpanded from the threshold-driven approach described in chapter 2 to an optimization approach that is detailed in chapter 5.
This report is organized into the following six chapters: