U.S. Department of Transportation
Federal Highway Administration
1200 New Jersey Avenue, SE
Washington, DC 20590
202-366-4000
Federal Highway Administration Research and Technology
Coordinating, Developing, and Delivering Highway Transportation Innovations
| REPORT |
| This report is an archived publication and may contain dated technical, contact, and link information |
|
| Publication Number: FHWA-HRT-16-053 Date: October 2016 |
Publication Number: FHWA-HRT-16-053 Date: October 2016 |
This chapter provides an overview of the application and validation of the RSI framework at the project, network, and strategic levels. It documents the efforts under each level, including the initial processes and data used in the validation. In addition, limitations with available data and models that caused the project team to stop pursuing the validation using WSDOT are presented in this chapter. Finally, this chapter documents the issues encountered when the validation was pursued using the FHWA PHT analysis tool and presents some recommendations on how to address them.
The approach to validating the RSI at the project level consisted of developing optimal treatment strategies for a given pavement section over a defined time frame using mechanistic-empirical models. The basic algorithm used in the project-level validation is illustrated in figure 4. The RSI is the string of numbers that represent the optimum treatment sequence.
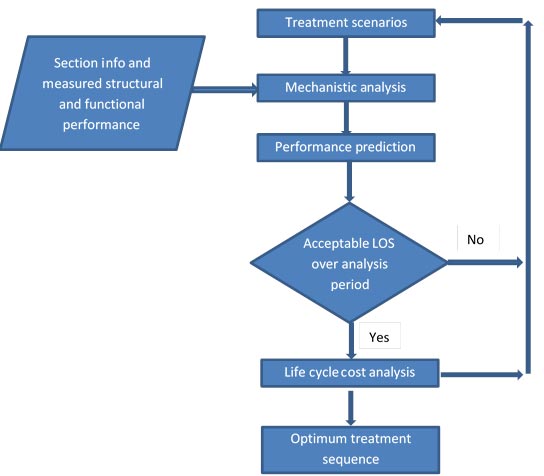
Figure 4. Flowchart. Project-level analysis.
Project-level analysis requires more detailed data because it includes pavement design and performance modeling specific to the project location. For this effort, LTPP data were used. The project-specific data and treatment scenarios were used as input for CalME in order to predict performance. If the performance prediction resulted in acceptable or above acceptable LOS over the analysis period, the performance prediction and the structural condition were used as inputs for the LCCA. If the LOS needs were not met, the treatment scenarios were revised. This allowed for the identification of the optimum treatment sequence as well as quantification of potential monetary loss of delaying the optimum treatment.
The overall goal of the network-level validation was to further develop the application of the RSI concept using real-world data from two State PMSs. As documented in chapter 2, MDSHA and WSDOT were selected for this validation. This section details the efforts undertaken as part of the network-level validation with these agencies.
For pavement management, MDSHA uses pavement condition and two cracking indices: a Functional Cracking Index (FCI) that combines functional cracks on a scale of 0 (worst) to 100 (best) and a Structural Cracking Index (SCI) that combines structural cracking on a similar 0 to 100 scale. MDSHA uses PMS software as a pavement management decision support tool that includes project selection optimization capabilities as well as value assessments in developing maintenance needs. The PMS software uses a remaining life/cost optimization process.
MDSHA employs a biennial approach to project selection optimization. The optimization uses RSL categories within the PMS software, where there are budgets and benefits for maintenance, preservation, and rehabilitation. The PMS software optimization is based on roughness and cracking. The optimization takes into account the weighted vehicle-miles traveled (VMT) in reaching the targets set as well as in determining the percent poor and percent with zero life, known as deficients. The objective function used in the optimization is presented in chapter 5.
The optimization steps include the following:
Validation Effort
The initial approach to validating the RSI using MDSHA data, models, and business processes was to modify the PMS software in order to implement multiyear optimization. More specifically, the PMS software needed to be expanded to accommodate the 30- to 40-year analysis period required for the RSI validation. Several modification options were developed, including the following:
A BCR would be determined for the entire plan, which would be ranked against other possible plans.
Since the RSI concept was to consider the optimal treatment selection based on all possible treatments while maintaining an acceptable or above acceptable LOS, none of the previous options provided the required functionality needed for the RSI validation. Specifically, these modifications would not allow for true optimization based on all possible treatments and treatment timings. Thus, modification to the PMS software was not pursued through to implementation.
The second approach to validating the RSI using MDSHA data, models, and business rules was to independently develop a program for selecting optimal strategies. As a result, a brute force approach to simulating the modeling of the software was proposed. To support this effort, decision trees, treatment types, treatment benefits, treatment feasibility, performance models, conditions, and cost data were obtained from MDSHA. The MDSHA PMS has 35 treatments within the decision tree ranging from preservation to reconstruction. The PMS also considers 7friction models for various functional classes, 48 cracking models for both FCI and SCI, 35 IRI models for combination of region and functional class, and 3 rutting models for groups of functional class.
As a result of the number of models and treatments, in an effort to make the brute force approach feasible, only asphalt pavement was considered. A spreadsheet containing the required information (condition data, performance models, treatment benefits and feasibility, and cost) was prepared. However, once compiled, it was apparent that the requirements to complete to optimization with the MDSHA data were beyond the capabilities of the spreadsheet program. In order to truly implement the RSI algorithm as it had evolved to consider all possible treatments and treatment timings and not only those based on thresholds, multiple global optimization procedures were adopted and enhanced for use with MDSHA. The details of this validation effort are presented in chapter 5.
For pavement management, WSDOT uses distresses and pavement condition indices. The indices range from 0 (very poor) to 100 (very good) and identified the need for treatment action when any index value reaches 45 to 50. The typical treatment used by WSDOT is a 0.15-ft overlay or inlay. The indices for asphalt pavements are as follows:
Performance Forecasting
Within the Washington State PMS (WSPMS), the pavement indices prediction equations are updated over time using a time series regression analysis in order to tailor the performance curve to observed pavement conditions. As depicted in figure 5, the coefficients in the default series of family pavement performance prediction models are adjusted using a least squares algorithm based on field reported time series observations. In figure 5, the solid lines illustrate the default family of performance prediction curves, which are subsequently updated using field observations shown as the series of times series dots on each curve. While the default performance prediction curves provide a baseline estimate at the start of each new performance cycle, the adjustment of the prediction curves with observed field data over time provides a higher degree of confidence in the predicted results of the future performance predictions of specific pavement sections.
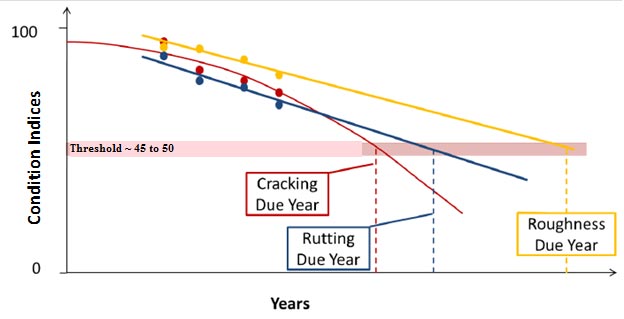
Source: WSDOT.
Figure 5. Graph. WSDOT curve fitting.(27)
The other concept of interest to this investigation is the “due year” terminology shown in figure5. The due year is the predicted time that one of the indices will reach the threshold value of 45 to 50, at which point the next treatment is due.
Validation Effort
The RSI concept has many facets. While there is focus on nomenclature, other aspects of the concepts include use of LCCA as a basis for cost optimization approaches. It was postulated that optimum treatment times could be derived from LCCA. Within the LCCA concept, thresholds of acceptable LOS are still used.
Condition Index Thresholds: In order to demonstrate the RSI concept, the project team was interested in quantifying the benefits of applying treatments at different pavement conditions instead of fixed threshold values in order to identify optimum timing for preservation, rehabilitation, and possibly reconstruction for each pavement section (survey unit) in the network. This was based on the reasoning that the treatment effectiveness and posttreatment benefits are a function of pretreatment pavement condition and that there may be an optimum pretreatment condition (or timing) that yields the maximum lifecycle cost benefits.
In discussion with WSDOT, it was determined that although treatment is triggered at an index range of 45 to 50, when the treatment is applied, pavement sections at various conditions are included in the project (referred as preservation units in WSPMS) when grouping several pavement sections together for a preservation unit. In other words, the index range of 45 to 50 corresponds to the average condition of the preservation unit within which there may be pavement sections with a range of conditions. As a result, within a project, there are pavement sections that are still in good condition and also pavement sections that are in fair to poor condition when a resurfacing treatment is placed. It was hypothesized that the pretreatment condition of the section will have an effect on the posttreatment performance of the treatment and the pavement as a whole. In order to investigate this hypothesis, data from the WSPMS were analyzed for asphalt pavements where resurfacing was triggered only by the PSC index.
The initial findings of the investigation showed no discernable relationship between the posttreatment performance of a treatment from the average performance and the pretreatment condition. Additional analyses were considered and conducted to identify possible reasons for the observed lack of correlation, including the following:
These additional analyses yielded a similar lack of correlation as the initial analysis, and the project team concluded that the data does not adequately reflect the effect of pretreatment condition on the AC overlay treatment performance as was expected.
Since the treatment mostly used by WSDOT is resurfacing (0.15 ft hot-mix asphalt (HMA) overlay or inlay), it was hypothesized that most of the measured cracks that affect the PSC are surface-initiated (top-down) cracks that have not damaged the integrity of the overall pavement structure. Therefore, by applying the rehabilitation treatment, the condition of the total project (all preservation units) is improved to a relatively uniform structural condition irrespective of the pretreatment condition.
Since it appears that most of the cracks are surface initiated, PSC does not fully capture the true structural condition of the pavement and it is more properly reflective of the pavement surface condition. The PSC also fluctuates once below 50 as a result of maintenance activities and its sensitivity to judgement calls for extent and severity of alligator cracking.(28) In addition, WSDOT staff explained that the power model is not reliable for communicating the actual pavement rehabilitation need past the point of resurfacing. Because of this, when forecasting assumptions are made, the number of years past due is used as an estimate of need for rehabilitation/reconstruction as opposed to following the power model or current PSC score. It may be that the surface condition alone can never approximate the true structural condition (past the point of resurfacing).
Finally, according to WSDOT staff, asphalt resurfacing was generally sufficiently funded during 1995–2005. As a result, asphalt roadways are rarely allowed to deteriorate to a point where significant rehabilitation or reconstruction costs were incurred.
Treatment Type Performance
The next consideration was given to investigating treatment performance, or time between treatments, for the various types of treatments of preservation, rehabilitation, and reconstruction. The objective was to identify whether there was a significant difference between the time between treatments for reconstruction, rehabilitation, and preservation. Based on the previous findings and the understanding that WSDOT pavements are generally considered to be structurally sound as well as knowledge of WSDOT practices (i.e., placing 0.15-ft resurfacing when index values reach between 45 and 50), significant differences in treatment life or time between treatments were not anticipated.
The analysis used the contracts table from the 2014 WSPMS research database to identify each treatment type under the contract type in the table. Reconstruction is directly identified as specified in the table. However, rehabilitation and preservation are not directly specified in the table because the contract type is listed as resurfacing. For the purpose of this analysis, preservation was considered as a resurfacing with thickness of 0.15 ft or less because this is a typical treatment applied by WSDOT. Rehabilitation was considered as a resurfacing with a thickness greater than 0.15 ft with an average of 0.36 ft for the sample. A small random sample of sections was analyzed. This sample only considered asphalt pavements and did not consider exceptions such as lane additions, widening, etc. The treatment life was determined as the average time between the treatment placement and the placement of next treatment of any type. It should be noted that many of the sections that were classified as rehabilitation based on the thickness of the resurfacing either were originally concrete pavements or had previously had a chip seal surface treatment placed prior to the rehabilitation. Therefore, the rehabilitation sample size was smaller because these pavements were not included.
Table 5 provides the summary statistics for the treatment life, and figure 6 depicts a histogram of the performance life of the treatments. Although table 5 shows that the mean and median time between treatments is greatest for reconstruction and least for preservation, as would be expected, these difference are not statistically significant.
| Treatment | Mean (years) | Median (years) | Standard Deviation |
|---|---|---|---|
| Reconstruction | 18.2 | 17.4 | 7.1 |
| Rehabilitation | 14.7 | 16 | 4.2 |
| Preservation | 14.5 | 14 | 4.1 |
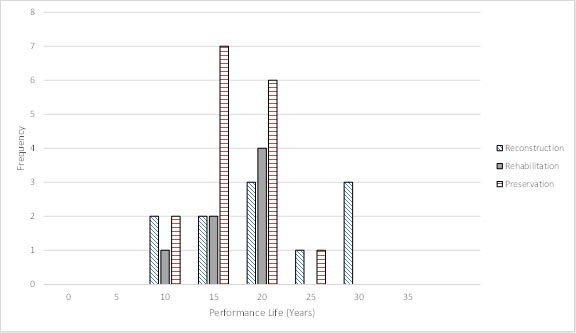
Figure 6. Histogram. Treatment life.
An analysis of variance (ANOVA) was performed on the three samples to determine whether the means were significantly different or not. Table 6 contains the ANOVA summary. Because the F statistic is less than the F-critical (Fcrit) (and the p-value is greater than alpha = 0.05), there is not enough statistical evidence to suggest that the means of the treatments are different (fail to reject the null hypothesis that all means are equal), meaning that there is not a statistically significant difference.
| Source | SS | df | MS | F | p-value | Fcrit |
|---|---|---|---|---|---|---|
| Between groups | 96.0 | 2 | 48.0 | 1.715 | 0.1965 | 3.305 |
| Within groups | 867.8 | 31 | 28.0 | |||
| Total | 963.8 | 33 | ||||
| df = Degrees of freedom. MS = Mean square. SS = Sum of squares. Blank cell = Not applicable. |
||||||
As a result of not being able to find either a correlation between pretreatment condition and treatment life or a significant difference between the performance life for the different treatments, the project team concluded that it would not be possible to validate the RSI concept using WSDOT data because the concept requires the use of a broader range of treatment options and trigger values.
This does not have negative connotations for WSDOT; on the contrary, it suggests that the agency has taken on a “pavement for life” approach in which pavements are repaired before the pavements have suffered significant structural damage. In addition, the project team found WSPMS to contain quality data, which aided in the analyses. The use of WebWSPMS was also easy to follow and beneficial in visualizing conditions and sections.
The overall goal of the strategic-level validation was to demonstrate and further develop the application of the pavement RSI concept using the HPMS 2010+ dataset. This validation used the FHWA PHT analysis tool. The analysis algorithms documented in chapter 2 were implemented into the PHT analysis tool via an RSI module developed as part of the project.
The PHT analysis tool was developed under an effort by the FHWA Office of Asset Management, as documented in PHT Analysis Tool, Summary Report.(29) The current version of the tool is 2.0. The PHT analysis tool was developed to work with HPMS 2010+ data or appropriately formatted State transportation department PMS data to predict various pavement condition and health indices based on pavement structure data, current condition, past performance, and assumed actions. However, the PHT analysis tool was developed before the RSI concept; therefore, the RSI concept was not included in the PHT analysis tool.
The PHT analysis tool uses a multicondition approach to estimate pavement RSL. The first step evaluates the structural condition as the time until the pavement structural condition deteriorates to renewal intervention level (e.g., excessive alligator cracking, transverse cracking, rutting, and faulting). The second step evaluates the functional condition as the period after which the pavement no longer provides the required level of service or desirable user ride quality. The user can choose to report the pavement section RSL as the weighted average or minimum of the RSL from the previous two steps.
The pavement distress models included in the PHT analysis tool are simplified forms of pavement distress models (i.e., IRI, cracking, etc.) used in the AASHTO MEPDG, along with construction and rehabilitation/maintenance history.(24) The models also allow self-calibration if historical data items are available.
The PHT analysis tool uses HPMS 2010+ data as input data. The pavement distress models used in the PHT analysis tool are very sensitive to some pavement data inputs. Performing analysis using the PHT analysis tool on pavement sections that are missing these data inputs is not recommended. As part of the PHT analysis, the input data must be validated. Sections that do not contain the required data or other requirements should be removed from the analysis. Default MEPDG values for data items such as climate zone or soil type may be used based on a given state and county.(24) The following data elements are req uired by the PHT analysis tool, and the pavement data items that are mandatory for the PHT analysis tool are bolded:
As part of this project, enhancement of the PHT analysis tool to incorporate the RSI concept was pursued for use in the validation of the RSI framework with HPMS 2010+ data for national-level application. The remainder of this section provides an overview of the PHT analysis tool using HPMS 2010+ data, development of the RSI module, the validation effort using the RSI module, and findings and conclusions.
The RSI module was developed under this project as a plug-in that was integrated with the PHT analysis tool for use with HPMS 2010+ data for the computation of RSI. The RSI module was to use the simplified MEPDG derived pavement performance models contained in the PHT analysis tool. No changes to the PHT analysis tool performance models were made.
The RSI module was designed and developed to provide a list of LCC optimized series of treatment, timing, and cost for each pavement section over the analysis period. The RSI module required inputs data such as HPMS 2010+ pavement sections, related data, analysis period, and minimum LOS to be maintained in addition to other constraints currently included in the PHT analysis tool. A threshold-based approach was used to trigger construction events because identification of optimum treatment timing required modifying the PHT analysis tool, which was not feasible at the time of this project.
Development of RSI Module
For the development of the RSI module, an RSI algorithm considering construction events and threshold limits, rules, and calculation of LCC was developed. The proposed RSI algorithm was to consider the following four types of construction events:
The RSI analysis sets the threshold limits for the pavement distresses used by the PHT analysis to levels that trigger preservation, rehabilitation, and reconstruction maintenance options to determine the RSL until each trigger level is reached. The specified threshold limits that trigger preservation, rehabilitation, and reconstruction for each distress, pavement type, and road classification are shown in table 7 through table 9, respectively.
| Surface Type | Class | IRI (inches/mi) | Cracking | Rutting (inch) | Faulting (inch) | |
|---|---|---|---|---|---|---|
| Percent | Length (ft/mi) | |||||
| AC | Interstate | 95 | 5 | 250 | 0.25 | |
| Primary | 100 | 5 | 1,000 | 0.25 | ||
| Secondary | 125 | 5 | 1,000 | 0.35 | ||
| Rigid | Interstate | 95 | 5 | 0.05 | ||
| Primary | 100 | 5 | 0.05 | |||
| Secondary | 125 | 5 | 0.10 | |||
| Blank cell = Measurement not appropriate for pavement type (e.g., no measurements taken). | ||||||
| Surface Type | Class | IRI (inches/mi) | Cracking | Rutting (inch) | Faulting (inch) | |
|---|---|---|---|---|---|---|
| Percent | Length (ft/mi) | |||||
| AC | Interstate | 125 | 10 | 1,000 | 0.35 | |
| Primary | 150 | 15 | 2,000 | 0.50 | ||
| Secondary | 150 | 20 | 2,000 | 0.50 | ||
| Rigid | Interstate | 150 | 10 | 0.10 | ||
| Primary | 150 | 10 | 0.10 | |||
| Secondary | 150 | 10 | 0.15 | |||
| Blank cell = Measurement not appropriate for pavement type (e.g., no measurements taken). | ||||||
| Surface Type | Class | IRI (inches/mi) | Cracking | Rutting (inch) | Faulting (inch) | |
|---|---|---|---|---|---|---|
| Percent | Length (ft/mi) | |||||
| AC | Interstate | 170 | 20 | 2,000 | 0.40 | |
| Primary | 220 | 30 | 2,000 | 0.60 | ||
| Secondary | 220 | 30 | 2,500 | 0.80 | ||
| Rigid | Interstate | 170 | 15 | 0.15 | ||
| Primary | 220 | 15 | 0.20 | |||
| Secondary | 220 | 20 | 0.20 | |||
| Blank cell = Measurement not appropriate for pavement type (e.g., no measurements taken). | ||||||
The following rules were used when considering the feasibility of construction events:
Table 10 provides the benefit for the various metrics based on construction event and as a function of percent decrease from the existing condition. For example, R&R remove all distress and reduce IRI to a minimum of 50 inches/mi, and preservation treatments reduce cracking length by 90 percent. Once a treatment is selected by the RSI module based on the existing conditions, the distress and IRI values are reset by applying the below percentages to the existing values and are considered the new condition after construction.
| Construction Event | Percent Cracking | Cracking Length | Rutting | IRI |
|---|---|---|---|---|
| Do nothing | 0 | 0 | 0 | 0 |
| Preservation | 100 | 90 | 50 | 20 |
| Rehabilitation | 100 | 100 | 100 | 100 (not less than 50 inches/mi) |
| Reconstruction | 100 | 100 | 100 | 100 (not less than 50 inches/mi) |
An overview of the relationship of the RSI module within the PHT analysis tool is provided in figure 7. It shows that the RSI analysis was executed using the selected highway sections obtained from the PHT analysis tool database. Once the RSI analysis was complete, the LLCCs for each highway section and the overall system were determined. The execution of the RSI analysis was done using the RSI subroutine explained in figure 3, as denoted by the double box symbol in figure 7.
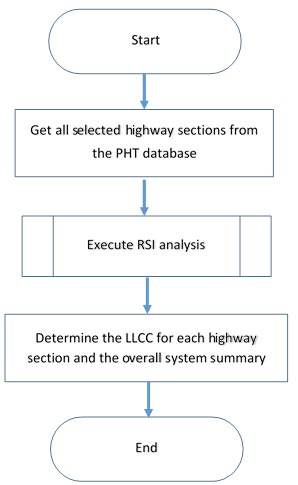
Figure 7. Flowchart. PHT RSI module overview.
The flowchart in figure 3 shows that the RSI algorithm used available highway sections to identify a year that triggered a construction event based on the prediction models (within PHT analysis tool). A 1-year time-step interval was used in this process. If the year identified did not reach the analysis period end and the treatment could be applied based on the rules listed previously, both a “do nothing” and an “apply treatment” scenario were created. When the rules listed did not allow the treatment to be applied, a “do nothing” scenario was created, the inputs were updated to change to the next level’s threshold value (i.e., from preservation to rehabilitation or rehabilitation to reconstruction), and the link was looped through the prediction models again until the analysis period was reached. This loop was performed to account for all construction thresholds (preservation, rehabilitation, and reconstruction). Once the end of the analysis period was reached, the LLCC option from all possible scenarios was selected and output to the summary table. Figure 8 provides more details of performing the prediction models, incrementing the input values, and updating the threshold values described as a part of the RSI algorithm in figure 3.
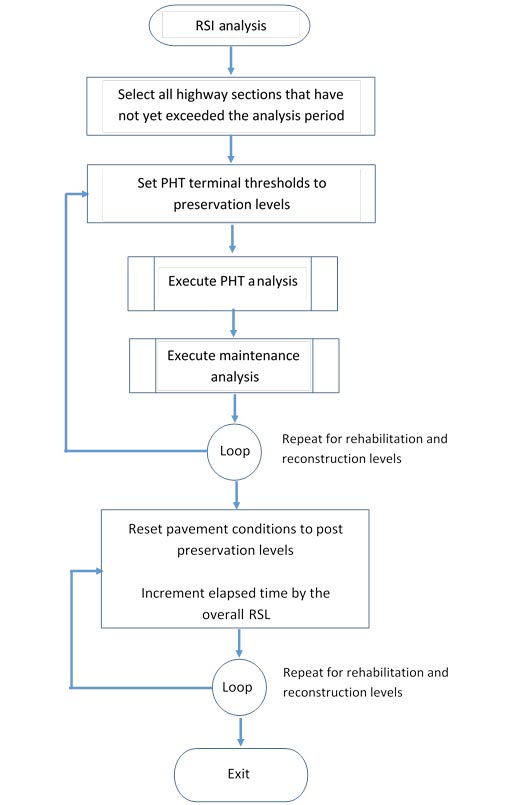
Figure 8. Flowchart. PHT analysis tool RSI algorithm.
Validation Using RSI Module
This section provides an overview of the validation effort using the RSI module developed for the PHT analysis tool. It was expected that the validation would use a representative sample of HPMS 2010+ data for national-level validation. However, the validation effort never reached that point, as is documented later in this section. The validation effort described during the remainder of this section represents the efforts undertaken during the RSI module testing and acceptance phase. The data used during this effort was a subset of HPMS 2010+ data from Idaho. This sample data was used as it passed the PHT analysis tool data validation stage. Within the PHT analysis tool, there are several validation rules that the data must pass such as various range and reasonableness checks. This sample also represented a range of various conditions and age of pavement as summarized in table 11. There were 100 sample sections, all of which were AC.
| Minimum | Maximum | Average | |
|---|---|---|---|
| AADT | 4,000 | 22,000 | 8,942 |
| IRI (inches/mi) | 91 | 190 | 126.5 |
| Rutting (inch) | 0.1 | 0.3 | 0.21 |
| Transverse cracking length (ft/mi) | 100 | 1,440 | 562.4 |
| Fatigue cracking ( percent) | 0 | 25 | 9.1 |
| Last year improved | 1970 | 2010 | 2008 |
| Last year constructed | 1962 | 1999 | 1974 |
| Thickness (inch) | 8 | 14 | 8.5 |
Figure 9 shows the maintenance thresholds used by the RSI module. These were input based on the values in table 7 through table 9.
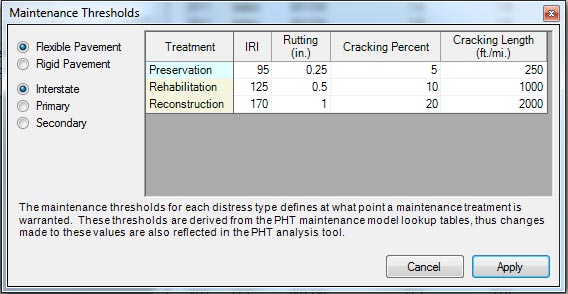
Figure 9. Screenshot. Maintenance thresholds.
The options that are available within the RSI module are depicted in figure 10 and include setting the maximum number of analysis iterations, discount rate (percent), ability to overwrite the limited pavement lives, application of minimum BCR to maintenace treatments, and the maintenace feasibility constraints. The feasiblity constraints allow the user to change the number of consectuive preservation treatments or the minimum number of years between rehabilitation or reconstruction treatments. The RSI module uses the same database input through the PHT analysis tool for analysis with these maintenance thresholds and RSI properties.
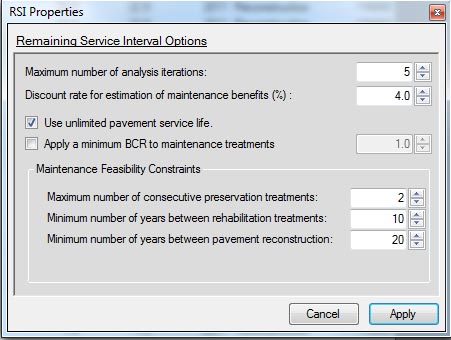
Figure 10. Screenshot. RSI properties options.
Running the RSI module produces sections and summary reports. The RSI sections report, as depicted in figure 11, shows each pavement section based on beginning and end points and the event year, type, and cost. For example, for pavement section ID 1, reconstruction is triggered in 2011 at a cost of $116,000 for the section. The summary report, as depicted in figure 12, provides a summary of the preservation, rehabilitation, and reconstruction costs for each year a treatment is required. For the sample data used, $4,454,400 and $116,000 are needed for reconstruction in years 2011 and 2014, respectively, while $16,800 is needed for preservation in 2016. The summary table is based on accumulating the costs for each pavement section for the specified event years and construction event types.
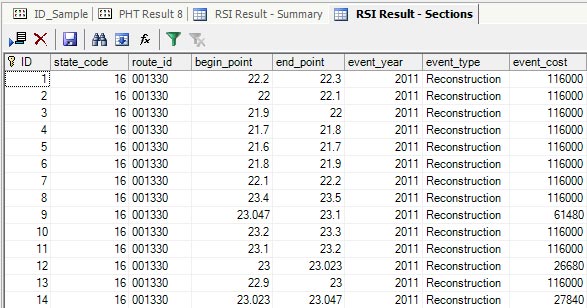
Figure 11. Screenshot. RSI results Idaho sections report.

Figure 12. Screenshot. RSI results summary report.
Although the pavement sections used for analysis varied by condition, age, and structure, 96percent of the sections triggered reconstruction in 2011, which triggered further investigation. It appeared that the pavement sections (even those that were classified as in good condition) were deteriorating beyond the reconstruction thresholds within a year’s time. The RSI module contains an analysis tab that was used for debugging purposes. This analysis tab contains each highway section and shows the possible RSI paths for each section as well as the historical dates, premaintenance conditions, and postmaintenance conditions. The data in this analysis tab were used to further investigate the possible cause of the overwhelming number of reconstruction triggered in 2011.
Figure 13 depicts a sample RSI analysis tab for a pavement section. Under the “Possible RSI Paths” portion of the tab, there are two distinct possible RSI paths. Both paths begin with a reconstruction in 2011 at a cost of $116,000. After the reconstruction, there are two scenarios: (1) preservation in 2013 at a cost of $16,800, followed by either preservation in 2015 (and many other treatments as denoted by the plus mark next to the path) or reconstruction in 2022 at a cost of $116,000, or (2) reconstruction in 2088 at a cost of $116,000. This is not logical, since in the first scenario, a preservation treatment is selected in 2013 followed by a reconstruction in 2022, while in the second scenario, no treatment is selected until 2088, when a reconstruction is warranted while still maintaining acceptable LOS. This shows a shortcoming of the models within the PHT analysis tool that is summarized under PHT Analysis Model Issues.
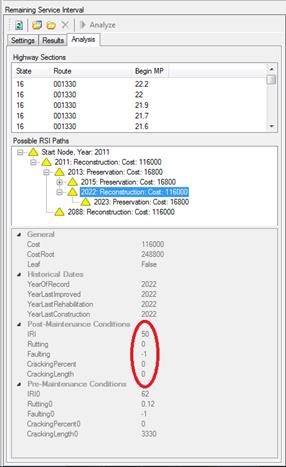
Figure 13. Screenshot. RSI module analysis tab, 2022 reconstruction.
Figure 14 is similar to figure 13 with the difference being the RSI path that is highlighted. Figure 13 shows the 2022 reconstruction, while figure 14 shows the 2023 preservation that follows the reconstruction in 2022. The importance of these figures is provided by the premaintenance and postmaintenance conditions for each treatment. As shown in figure 13, the postmaintenance conditions after the reconstruction in 2022 are an IRI of 50 inches/mi, rutting of 0 inch, cracking of 0 percent, and cracking length of 0 ft/mi. These values represent expected values after a reconstruction.
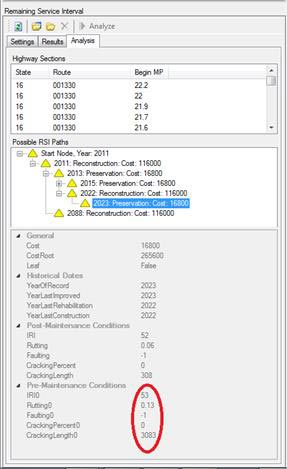
Figure 14. Screenshot. RSI module analysis tab, 2023 preservation.
The premaintenance conditions represent the conditions at the time that the treatment, in this case preservation, was suggested. For this example, the pretreatment conditions in figure 14 represent the condition in 2023 prior to placing the preservation treatment, which is an IRI of 53 inches/mi, rutting of 0.13 inch, cracking of 0 percent, and cracking length of 3,083 ft/mi. Based on there being a reconstruction in 2022 and the cracking length value being reset to 0ft/mi, such an exponential increase in cracking length 1 year later was not expected. This cracking length also exceeds the threshold for preservation (and reconstruction), which makes this RSI path a non-viable option. This is denoted by the RSI leaf in figure 13 being false. Within the RSI module, a node (e.g., 2022 reconstruction highlighted in figure 13) is categorized as true if its year is at the end of the analysis period and any of its children (e.g., future year treatments) is beyond the analysis period.
In this example, because the premaintenance values as depicted in figure 14 would trigger a reconstruction, and a reconstruction was placed in the previous year, this violates the rule of no reconstructions within a 20-year period of a reconstruction. Therefore, this RSI path is not valid, and the leaf was classified as false. Although the RSI path was not valid, this RSI path was beneficial because it showed a possible issue with the PHT analysis tool performance models used to predict the distress values. Since this is not a valid RSI path, it does not appear in either the RSI results sections or summary reports.
As a result of the unexpected results from the previous example, further investigation into the PHT analysis tool performance models, PHT analysis tool and RSI module input data (HPMS 2010+), and RSI computation module was pursued.
PHT Analysis Tool Model Issues
The PHT analysis tool uses simplified MEPDG-based pavement performance prediction models.(24) Although investigation into the appropriateness of these models is outside the scope of this RSI project, consideration into the model predictions was given during the testing and validation phase of the RSI module as a result of the seemingly inaccurate results the RSI module was producing. The investigation needed to determine whether the inaccuracies were due to the pavement prediction models used by the PHT analysis tool, the implementation of the RSI algorithm within the RSI module developed for the PHT analysis tool, the HPMS data inputs used by both the PHT analysis tool and the RSI module, or a combination of two or more of these factors.
As part of the investigation, the number of transverse cracks generated by PHT analysis tool was looked at in more detail because the projected value of 3,000 cracks/mi 1 year after reconstruction (see figure 14) seemed inaccurate. The forecasting models from the PHT analysis tool were obtained from the PHT analysis tool documentation.(4) Figure 15 provides the transverse cracking equation used by the PHT analysis tool, figure 16 provides the equation for the factor used in figure 15, and figure 17 provides the PHT analysis tool HMA binder viscosity equation. The air voids, percent passing, and mean annual air freeze-thaw cycles are statewide default values contained in the PHT analysis tool. Data for one section (from the dataset used for the validation) was used to test the equation. The default values shown in table 12 were used because they correspond to the Idaho values used earlier. The A and VTS values are the regression intercept and regression slope of viscosity temperature susceptibility for an HMA binder with performance grade 58-22. Using these default values, the projected number of transverse cracks per mi is 1.31, which seems reasonable for a pavement 1 year after reconstruction, but it does not compare well with the 3,000 cracks/mi projected by PHT analysis tool. It was found, however, that the PHT analysis tool reported value can be replicated if the temperature in the viscosity equation is reported in Fahrenheit instead of Rankine, as required. This is one example of the issues identified with the models used within the PHT analysis tool.
![]()
Figure 15. Equation. PHT analysis tool transverse cracking equation.
![]()
Figure 16. Equation. Factor equation.
Where:
TCRK = Number of transverse cracks per mi.
HHMA = HMA thickness, inches.
η = Aged viscosity at HMA surface, cP.
Va = HMA mix as-constructed air voids, percent.
PCT3/4 = Percent passing 3/4-inch sieve for the HMA mix.
FTCYC = Mean annual air freeze-thaw cycles.
![]()
Figure 17. PHT analysis tool HMA binder viscosity equation.
Where:
ηorig = Unaged HMA binder viscosity (at reference temperature 77 °F), cP.
TR = Temperature, Rankine (reference temperature is 77 °F, convert to Rankine).
Table 12. Input data for PHT analysis tool models.
| Variable | Value |
|---|---|
| Age | 1 year |
| HHMA | 9 inches |
| Va | 3.19 percent |
| FTCYC | 127.4 |
| A | 11.787 |
| VTS | -3.981 |
Concurrent with the investigation, members of the project team were also working on other FHWA-sponsored projects related to the performance models contained in the PHT analysis tool through both the HERS and the National Pavement Cost Model (NAPCOM). Through these projects, as well as with issues experienced during the FHWA-sponsored “Improving FHWA’s Ability to Asses Infrastructure Health” project with the PHT analysis tool, the project team concluded that there was enough evidence to suggest that there are issues with the simplified MEPDG models that are contained in various forms in the PHT analysis tool, HERS, and NAPCOM. (See references 4, 26, and 30.)
HPMS 2010+ Data Issues
There have been many studies that have investigated the quality, completeness, or issues of the HPMS 2010+ dataset. (See references 30 through 33.) A chapter in the Interstate Pavement Condition Sampling Phase I Report provides a literature review of these references.(34) Some of the highlights from the literature review that are relevant to the issues and challenges faced within this project include HPMS data consistency, completeness, data requirements, and algorithms for collection and use with national performance measures.
However, what these studies did not investigate fully, or at all in some instances, was the appropriateness of HPMS data across a section. These data need to be further investigated to determine whether elements such as total pavement structure, traffic demand, pavement condition (as a function of reported IRI, distress and rutting, or faulting), and climate are appropriate when used as inputs to models such as the PHT analysis tool. For example, an interstate pavement section with asphalt thickness of 3.5 inches placed 10 years ago and with an AADT of 50,000 vehicles that is showing no distress or rutting and acceptable IRI may be suspect because the asphalt thickness appears inadequate for the traffic level and time in service. As such, this section needs to be investigated to see if this thickness value is appropriate or not. This investigation could lead to findings such as the section expecting to see an exponential increase in cracking length after a reconstruction based on the factors considered or that it is unlikely that these reported values are actually reflective of the true pavement section.
Although further investigation of this issue is beyond the scope of the RSI project in question, the challenges and issues faced during this project resulted in recommendations regarding further investigation into the quality, completeness, and appropriateness of use of HPMS data in performance models for future research and that are presented in chapter 6.
RSI Computation Module
Notwithstanding the issues with the performance models and HPMS 2010+ data inputs, the project team needed to test the performance of the RSI module to check whether the computations within the module were accurately following the RSI algorithm. Although the results from the RSI module were not reliable as a result of the issues with the performance models as implemented within PHT analysis tool and input data, the functionality of the RSI module was tested for acceptance so that in the future, when the issues with the performance models and data inputs have been addressed, the RSI module will be available for use.
The testing of the RSI module included checking the accuracy of the condition values that triggered treatment against threshold values, resetting maintenance levels once a treatment was applied, and not including RSI paths that violated the rules set forth in the algorithm.
Additional datasets were created for a limited number of sections that included data that would be considered complete, consistent, and usable as inputs for performance models. Although these datasets addressed the issue with the input data, they still faced the issue with the performance models. Therefore, although these results may seem to have improved over previous results, they were still not reliable. However, these datasets did provide more insight into the performance of the RSI module.
Through these activities, the project team concluded that the RSI module was performing as expected and following the RSI algorithm accurately.
Based on the discussion of the issues associated with the PHT analysis tool performance models and use of HPMS 2010+ data as input to the PHT analysis tool and RSI modules, it was concluded that the PHT analysis tool in its current form cannot be used for the validation of the RSI concept. As a result, the RSI validation at the strategic level using HPMS 2010+ data could not be completed.
This chapter presented an overview of the application and validation of the RSI framework at the project, network, and strategic levels. Some of the issues and challenges faced with validating the RSI concept include the following:
Chapter 4 provides details on the project-level validation using LTPP data and CalME.