U.S. Department of Transportation
Federal Highway Administration
1200 New Jersey Avenue, SE
Washington, DC 20590
202-366-4000
Federal Highway Administration Research and Technology
Coordinating, Developing, and Delivering Highway Transportation Innovations
| REPORT |
| This report is an archived publication and may contain dated technical, contact, and link information |
|
| Publication Number: FHWA-HRT-16-053 Date: October 2016 |
Publication Number: FHWA-HRT-16-053 Date: October 2016 |
Data collected as part of the LTPP Program provided an excellent opportunity to apply the comprehensive LCCA-based RSI methodology in a project-level demonstration and subsequent reporting of project treatment needs within the context of the RSI concept and terminology. In practice, network-level LCCA is possible if each section in the network has detailed data, typically called project-level data; the analysis shown in this chapter can be extended to each project section in the network. In this example, LTPP data is being used as representative project-level data.
Thyagarajan et al. presented a methodology for incorporating structural measurements to track flexible pavement structural condition over time and assessing future rehabilitation needs at a network level to address structural adequacy in addition to surface condition at LLCC.(35) The article showed that mechanistic-empirical pavement analysis tools such as CalME can be used to determine structural performance extension from a selected treatment applied at a given condition.(5) The estimated benefit (performance extension) combined with treatment cost are used in the LCC analysis to identify the optimum treatment sequence. Mechanistic-empirical analysis also enables the quantification of the monetary loss of delaying the optimum treatment. This chapter describes the application of the methodology proposed by Thyagarajan et al. using data from LTPP test section 06-0505 in which both structural and function conditions have been monitored at regular interval as part of LTPP monitoring efforts.(35) Figure 18 depicts the flowchart for this methodology. Finally, the identified optimum treatments are reported using the RSI terminology.
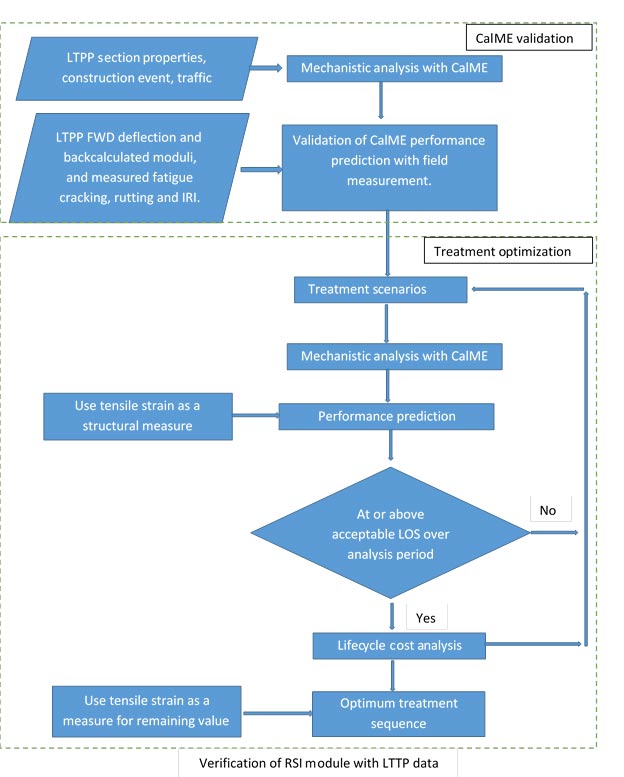
FWD = Falling weight deflectometer.
Figure 18. Flowchart. Project-level validation.
The LTPP database includes periodical measurements on distress performance, structural evaluation, and traffic for each monitored section. In addition, the data collection effort includes section inventory, material testing (laboratory and field), climate, and M&R data. LTPP InfoPaveTM offers a gateway to LTPP data as well as to findings from data analyses and extensive documentation for the many aspects of LTPP experiment design, data acquisition, quality control, and data dissemination. LTPP test section 06-0505 in California, which was part of LTPP’s Specific Pavement Studies on Rehabilitation of Asphalt Concrete Pavements (SPS-5 experiment) was used in this project.(36) The layer types and construction events for the selected section are summarized in table 13. The pavement section was constructed in June 1966, and the M&R history for the section was available from January 1987 when the section was included in the LTPP Program. The first recorded treatment event was a mill and overlay applied in February 1992. The section was taken out of study from the LTPP Program in June 2007.
| Layer Information | Construction Events | |||||
|---|---|---|---|---|---|---|
| CN 1: Initial Structure January 1987 | CN 2: Mill and Overlay February 1992 | CN 3: Crack Sealing March 2000 | CN 4: Resurfacing July 2000 | |||
| Layer Number | Layer Type | Layer Material Description | Thickness (inch) | Thickness (inch) | Thickness (inch) | Thickness (inch) |
| 1 | Subgrade (untreated) | Coarse-grained soils: poorly graded sand with silt | ||||
| 2 | Unbound (granular) subbase | Soil-aggregate mixture (predominantly coarse-grained) | 20 | 20 | 20 | 20 |
| 3 | Bound (treated) base | Cement aggregate mixture | 5.2 | 5.2 | 5.2 | 5.2 |
| 4 | AC layer | Hot mixed, hot laid AC, dense graded | 4.7 | 3 | 3 | 3 |
| 5 | AC layer | Hot mixed, hot laid AC, open graded | 0.5 | 0 | 0 | 0 |
| 6 | AC layer | Hot mixed, hot laid AC, dense graded | 3.1 | 3.1 | 3.1 | |
| 7 | AC layer | Plant mix (emulsified asphalt) material, cold laid | 0.2 | |||
| CN = Construction number. Blank cell = Layer 1 (subgrade) thickness is not measured (assumed to be semi-infinite) and/or layers 6 and/or 7 do not exist. |
||||||
Figure 19 shows the measured traffic loading for LTPP test section 06-0505. As shown in this figure, an annual traffic growth of 1 percent was computed by fitting a linear trend to the data. Figure 20 shows the measured pavement roughness (IRI), and figure 21 shows AC fatigue cracking and AC rutting for this test section over time. As shown in these figures, the construction events detailed in table 13 reduced the measured amount of roughness, rutting, and cracking.
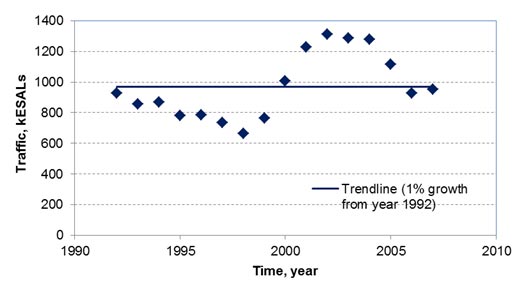
Figure 19. Graph. Annual traffic on LTPP test section 06-0505.
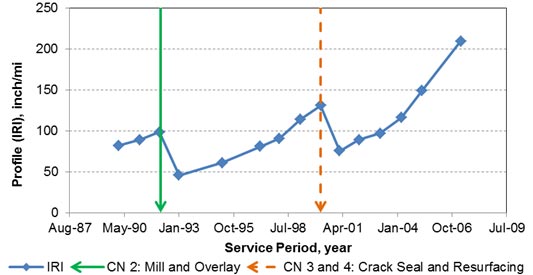
Figure 20. Graph. Measured profile on LTPP test section 06-0505.
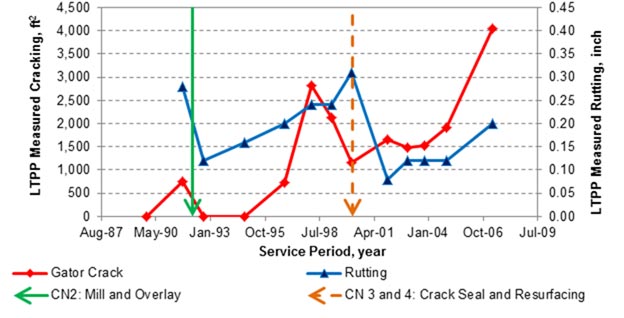
Figure 21. Graph. Measured fatigue cracking and AC rutting on LTPP test section 06-0505.
Figure 22 shows the resilient modulus value at different temperatures and monitoring periods for the AC mixes used in layers 4 and 6 (see table 13). As shown in this figure, at 77 °F, the resilient modulus of both AC mixes is about 1,300 ksi. The resilient modulus test was also performed on the subbase material in April 2003. Figure 23 shows the effect of confining pressure on resilient modulus for the granular subbase layer. The resilient modulus of subbase material at a confining pressure of 5 ksi is approximately 12 ksi.
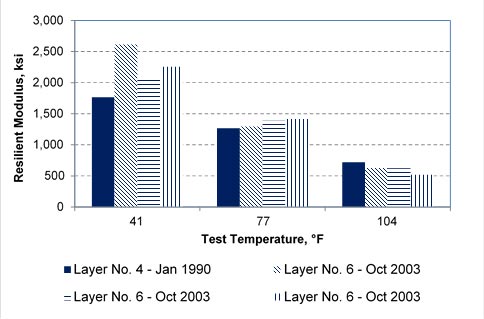
Figure 22. Graph. Resilient modulus of AC mix at different service periods for LTPP test section 06-0505.
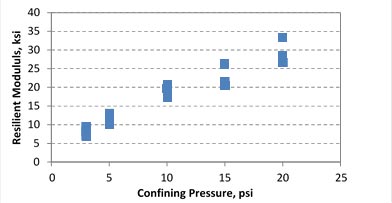
Figure 23. Graph. Resilient modulus of subbase material at different confining pressures for LTPP test section 06-0505.
Periodic FWD testing was conducted on LTPP test section 06-0505 starting in January 1990 prior to construction event 2 (mill and overlay; see table 13). LTTP InfoPaveTM also contained FWD-derived backcalculated layer moduli values for the section in question computed using the EVERCALC backcalculation program. Figure 24 presents the backcalculated modulus for each structural layer of LTPP test section 06-0505. The surface temperatures measured during FWD testing are available for after February 1992. The temperature correction procedure incorporated in the EVERCALC program was used to compute AC layer modulus at a reference temperature of 77 °F, and the resulting temperature-corrected AC layer moduli are also shown in figure 24 along with the trend line. For comparison purposes, the lab-measured AC resilient moduli from figure 22 are also shown in figure 24.
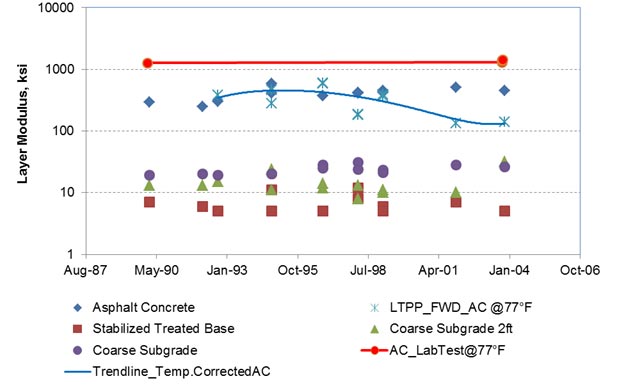
Figure 24. Graph. LTPP backcalculated layer moduli for LTPP test section 06-0505.
The CalME analysis software was used in this project to predict past and future performance and then to compare the predicted performance with the measured LTPP performance. The CalME software takes into account the progressive deterioration of the pavement structure over the design period and can also consider sequence of treatments during the analysis period to preserve and provide acceptable or above acceptable LOS over the analysis period. It is important to note that the CalME transfer functions were calibrated for California conditions and are therefore applicable to the LTPP test section 06-0505.
Barstow Daggett County Airport in California is the closest first-order weather station for LTPP test section 06-0505; it is about 12 mi west of the section. Figure 25 shows the hourly air temperature profile for the section over a 3-year period. The monthly average temperature shown in the figure is the temperature used in the CalME analysis.
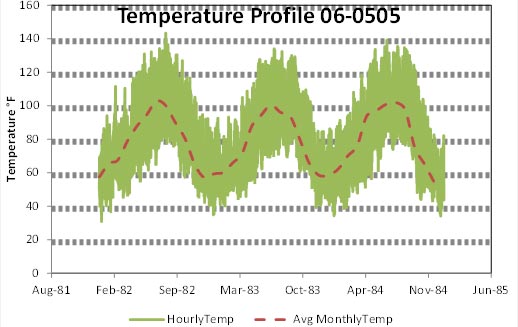
Figure 25. Graph. Three-year air temperature profile near LTPP test section 06-0505.
Figure 26 shows the layer moduli computed by CalME using the pavement section, layer properties, traffic, and climate data for LTPP test section 06-0505. The section was already in service when included in the LTPP Program; therefore, the AC properties at the time of initial construction were not available. Accordingly, default AC layer properties were assumed for layer 4 defined in table 13. Figure 26 shows the effect of seasonal fluctuation and structural deterioration on the computed layer moduli. The AC layer moduli for layers 4 and 6 show a gradual decrease over the analysis period. For comparison purposes, the AC resilient moduli from the laboratory and the FWD backcalculation (temperature corrected) and the subbase resilient moduli from the laboratory are also included in the figure. Note that all AC layers are treated as a single layer for backcalculation; therefore, the FWD-derived AC moduli are an estimate of the combined AC layers at the time of FWD testing. As shown in figure 26, significant differences exist between the laboratory-derived AC moduli and those derived from FWD backcalculation. Both sets of data were obtained directly from the LTPP database.
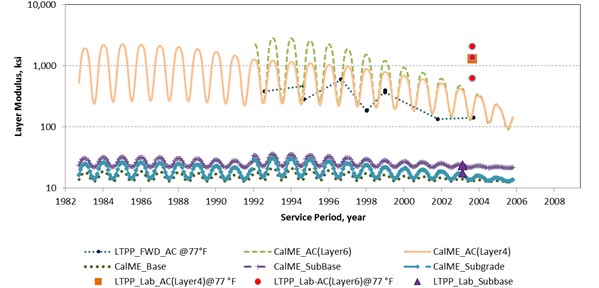
Figure 26. Graph. CalME-computed layer moduli for test section 06-0505.
Figure 27 and figure 28 compare the CalME estimated and LTPP measured fatigue cracking and rutting, respectively. These two figures clearly show that the CalME program can replicate actual field performance and therefore can be used with confidence in scheduling future treatment activities.
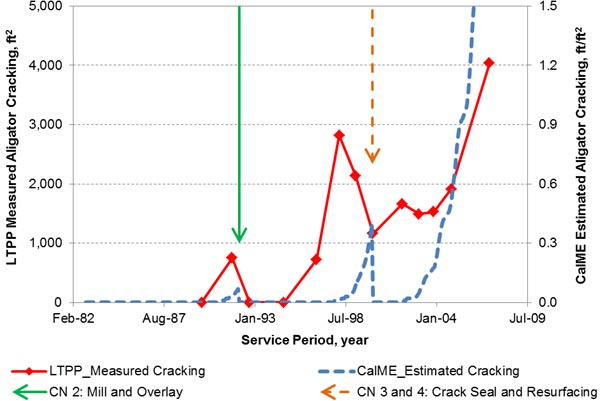
Figure 27. Graph. LTPP-measured versus CalME-estimated fatigue cracking for LTPP test section 06-0505.
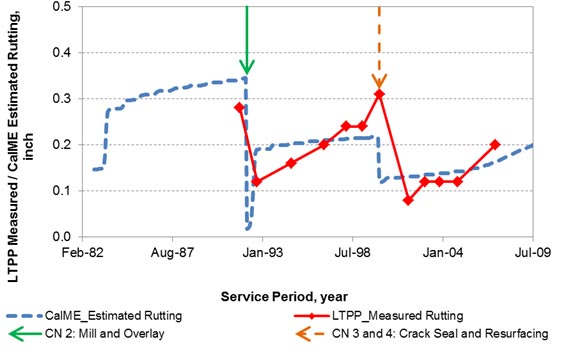
Figure 28. Graph. LTPP-measured versus CalME-estimated rutting for test section 06-0505.
In this section, the optimum treatments were scheduled for LTPP test section 06-0505 based on pavement conditions in 1997. The methodology proposed in Thyagarajan et.al was used to couple both mechanistic and LCC analyses and to identify the optimum sequence of treatment types and timings that minimizes the LCC.(35)
In 1997, the last treatment applied to LTPP test section 06-0505 was mill and overlay (CN 2; see table 13) as part of the LTPP SPS-5 experiment (AC overlays on existing AC pavements).(36) A resurfacing was applied in 2000 when significant cracking was observed on the surface. Preservation treatments such as resurfacing often retard the pavement deterioration and therefore are effective when the pavement structural condition is still good. Preservation treatment applied to structurally weak pavement only temporarily conceals the structural deterioration that occurs under the surface, thereby limiting future treatments to only costlier treatments such as thick overlays. The availability of continuous pavement structural data coupled with integrated mechanistic and LCC analysis would identify the appropriateness of the selected treatment type (preservation versus rehabilitation) in serving the objective of maintaining the pavement at or above an acceptable LOS while minimizing LCC over its service period.
Five different treatment scenarios were evaluated with the CalME program using the LTPP test section 06-0505 pavement condition data for 1997. In all scenarios, the minimum LOS was established as maintaining the pavement below an IRI threshold value of 140 inches/mi. The five scenarios were as follows:
Figure 29 shows the amount of fatigue cracking estimated by CalME for these five scenarios. As expected, the fatigue performance is a function of both treatment type and its time of application. Table 14 shows the LCCA for the five treatment scenarios. The table includes the performance extension computed by CalME for each treatment scenario to reach a cracking level of 0.15ft/ft2. The costs for the resurfacing, mill and overlay, and mill and thicker overlay treatments were assumed to be $60,000, $300,000, and $400,000, respectively. A 4-percent discount rate was used in the LCCA. In 1997, the tensile strain at the bottom of the AC layers due to the application of a 9,000-lb load with 120-psi tire pressure and 12-inch dual tire spacing was estimated to be 163 microstrain, as computed by Jacob Uzan Layered Elastic Analysis (JULEA) using the CalME computed modulus.(37)
In-service pavements may be subjected to a sequence of construction events. Accordingly, in a network-level LCCA, the asset value of each pavement section at the analysis year is an important parameter required for comparing equivalent treatment strategies. For this analysis, the asset value of the section was assumed to be $250,000. The net present value (NPV) and EUAC are also shown in table 14.
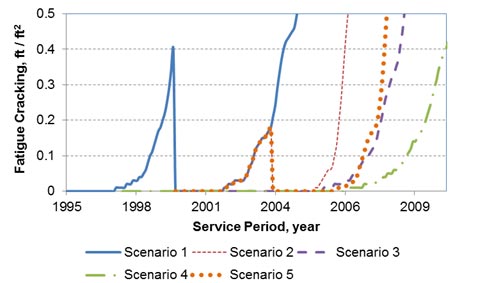
Figure 29. Graph. CalME-estimated fatigue cracking for five treatment scenarios on LTPP test section 06-0505.
| Scenario | Overlay Treatment | Performance Extension from 1997 (years) | NPV of Future Treatment Cost in 1997 ($) | EUAC ($) | Pretreatment Tensile Strain, microstrain (year) | Tensile Strain in 2003 (microstrain) | NPV to Bring the Pavement to State of Good Repair ($) | Revised EUAC ($) |
|---|---|---|---|---|---|---|---|---|
| 1 | Resurfacing in 2000 (current LTPP scenario) |
5.8 | 53,340 | 59,636 | 242 (2000) | 362 | 369,466 | 75,152 |
| 2 | Resurfacing in 2000 + mill and overlay in 2003 | 9 | 290,434 | 72,685 | 362 (2003) | 162 | 290,434 | 72,685 |
| 3 | Mill and overlay in 2000 | 10.2 | 266,699 | 62,684 | 242 (2000) | 148 | 266,699 | 62,684 |
| 4 | Mill and overlay in 1998 | 11.8 | 288,462 | 58,136 | 179 (1998) | 141 | 288,462 | 58,136 |
| 5 | Resurfacing in 2000 + mill and thicker overlay in 2003 | 10.2 | 369,466 | 75,152 | 362 (2003) | 147 | 369,466 | 75,152 |
Mill and overlay treatments applied in 1998, 2000, and 2003 (scenarios 4, 3, and 2, respectively) yielded different performances, as shown by the performance extension in table 14. Mill and overlay treatment applied in 1998 (scenario 4), when there was little or no surface cracking, yielded the best performance in terms of time extension. Comparing scenario 2 and 3, the latter of the two (mill and overlay in 2000 instead of resurfacing in 2000 and mill and overlay in 2003) is a more optimal treatment sequence. In scenario 2, the AC layer has been significantly damaged by 2003, when the mill and overlay was applied. As such, the delayed mill and overlay (scenario 2) did not perform as well as if it had been applied when the structure was still in good condition, as is the case with scenarios 3 and 4.
Table 14 also shows that the mill and overlay in 1998 (scenario 4), prior to the appearance of surface cracks, is the optimum treatment. When surface distresses such as fatigue cracking are used as the pavement structural indicator, it is difficult to identify the optimum treatment timing because by the time surface distresses appear, the pavement structure may already have deteriorated to a point where lower-level treatments, such as preservation, may not be effective. Accordingly, fatigue cracking can be viewed as a lagging indicator of pavement structural condition, which limits cost-effective alternatives that would otherwise have been possible. Also, the fatigue cracking measured at the pavement surface is effectively covered by any surface treatment and therefore may not be a reliable pavement structural measure in subsequent assessments.
Structural parameters computed from deflection measurements can be used as leading pavement structural indicators instead of lagging indicators such as surface cracking. Continuous pavement structural evaluations, such as those performed using traffic speed deflection devices (TSDDs) provide an excellent opportunity to identify the optimum treatment that yields the LLCC and thereby leading to more efficient PMSs.(38) Past studies have used curvature indices computed from deflection basins to correlate with the horizontal tensile strain at the bottom of the AC layer (hereafter referred simply as tensile strain).(35,39–46) The correlation was verified on the test section used in this analysis. The CalME computed layer moduli values for LTPP test section 06-0505 were used along with the JULEA program to compute tensile strains and the Surface Curvature Index as a function of time, as shown in figure 30.(37) Surface Curvature Index is defined as the difference between the measured deflection at the center of the load and the deflection 12 inches away from the load. A strong correlation between tensile strain and Surface Curvature Index is shown in figure 31.
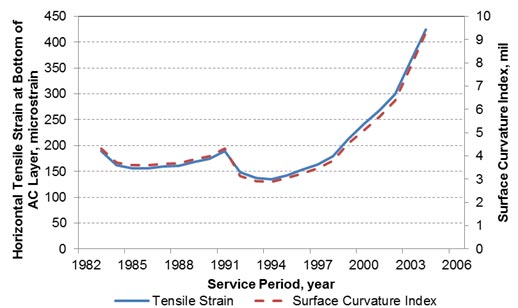
Figure 30. Graph. Tensile strain and Surface Curvature Index as a function of time for LTPP test section 06-0505.
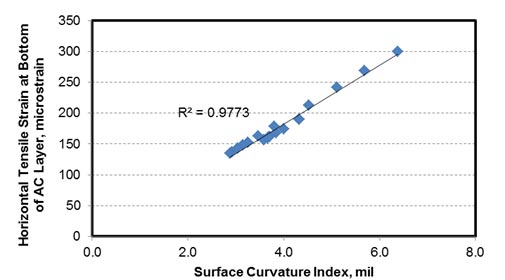
Figure 31. Graph. Tensile strain and Surface Curvature Index correlation for LTPP test section 06-0505.
Figure 32 shows tensile strains as a function of time for the five scenarios under consideration, which were computed using the JULEA program based on the CalME computed layer moduli values.(37) The figure shows that tensile strains can be a structural evaluation parameter that, unlike fatigue cracking, can continue to be an effective structural indicator after surface treatments. Also, the use of tensile strain as structural performance indicator provides continuity in tracking structural condition even after any given M&R activity.
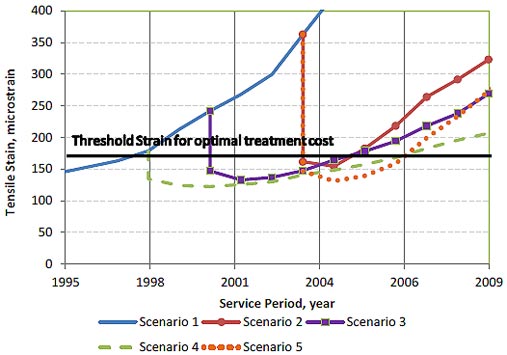
Figure 32. Graph. Tensile strain computed from the CalME layer modulus for different scenarios.
Comparing figure 29 and figure 32, the relative merits of using tensile strains instead of fatigue cracking as a structural indicator are summarized as follows:
Reasonable remaining values for pavements at the end of an analysis period can also be computed using tensile strains because they consider the total remaining structural capacity of the pavement rather than using prorated values based on the last treatment. Therefore, in contrast to surface condition measures such as cracking (which are ineffective pavement structural condition indicators once new treatments are applied), tensile strains computed from deflection measurements are able to continuously track the structural deterioration of the pavement system as a whole. This includes contributions from future treatments, including both rehabilitation treatments that add to structural capacity and preservation treatments that often slow down further deterioration.
In the LCCA, tensile strains were used in comparing the five scenarios and in identifying optimum treatment. For the last treatment sequence in each scenario, pretreatment tensile strains and the year of treatment application were also included in table 14. In addition, tensile strain at 2003 (for a 6-year analysis period) was included in the table. Based on EUAC, scenarios 1 and 4 have the lowest cost and would be considered the optimum treatments because both scenarios provide acceptable or above acceptable LOS over the analysis period. However, in 2003, the pavement in scenario 1 would have high deterioration, as shown by the high tensile strain value of 362, while the pavement in scenario 4 would still be in good structural condition, as shown by the tensile strain of 141. Therefore, with a short analysis period (such as 6 years), preventive treatments that have low costs associated with them would be selected, which can lead to rapid deterioration of the pavement structure. Accordingly, for comparison of treatment strategies, it is important to include the remaining value of the pavement or to include the treatment cost that will bring the pavement to a state of good repair at the end of the analysis period. In this LCCA, standardization was obtained by choosing the treatments that produce a pavement with a tensile strain around 150 microstrain at the end of the analysis period. The cost of the thicker overlay required to bring the pavement to such tensile strain level was added to scenario 1, and the revised EUAC is shown in the last column in table 14 for each scenario.
Comparing the revised EUAC, scenario 4 was found to be the optimum one. Table 15 shows the RSI computed for LTPP test section 06-0505 using the comprehensive LCCA methodology. A similar approach to each pavement section in a network can provide a planned sequence of treatments from which unconstrained budget requirements for PMS can be estimated. Table 15 also includes the RSI for the current treatment scenarios used in the LTPP test section.
| Scenario Type | RSI Preservation (year) | RSI Rehabilitation (year) | RSI Reconstruction (year) |
|---|---|---|---|
| Current | 2000 | 1992 | |
| Optimum | 1992, 1998 | ||
| Blank cell = Not applicable. | |||
The following observations sumarize the most important findings and conclusions from the RSI concept validation effort presented in this chapter: