U.S. Department of Transportation
Federal Highway Administration
1200 New Jersey Avenue, SE
Washington, DC 20590
202-366-4000
Federal Highway Administration Research and Technology
Coordinating, Developing, and Delivering Highway Transportation Innovations
| REPORT |
| This report is an archived publication and may contain dated technical, contact, and link information |
|
| Publication Number: FHWA-HRT-15-049 Date: April 2015 |
Publication Number: FHWA-HRT-15-049 Date: April 2015 |
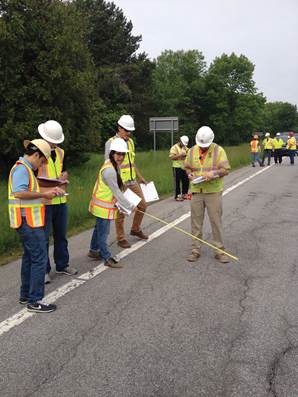 The challenge in LTPP data collection is to capture research-quality data of diverse types using highly specialized, state-of-the-art equipment with the involvement of many people across different geographical areas. |
Since 1989, millions upon millions of discrete data have been gathered and collected from pavement test sections across North America by highway agency personnel and the LTPP program through its contractor staff using a myriad of methods and equipment. The procedures and equipment used in the collection process were subject to careful planning and systematic quality controls designed to ensure that the data would be as consistent, comparable, and useful as possible for future research.
LTPP data collection focuses on understanding the performance of pavements from a mechanistic engineering perspective–the attempt to define a structure's performance by modeling the factors that lead to performance degradation and the need for maintenance, rehabilitation, or reconstruction. Figure 6.1 illustrates the relationships between data collection categories for mechanistic-based pavement performance modeling. Climate and traffic loading are two primary factors affecting a pavement structure's performance. Climate affects mainly the properties of the materials contained in the pavement structure. Traffic loads are directly supported by the pavement structure. Traffic loads and climate create responses in the materials contained in the pavement structure and subgrade that lead to various forms of distress. The data collection design for the LTPP program aims to measure, characterize, and quantify the factors that explain how and why a pavement performs as it does.
Providing high-quality data is of paramount importance to the LTPP program. Thus, collecting data with careful quality control/quality assurance (QC/QA) processes in place has been and continues to be a primary focus of the program (chapter 9). This chapter describes the development of LTPP's data collection procedures. The key data collection activities that have been adopted and continuously refined over the course of the program are the following:
| Key Milestones in Data Collection | |||
|---|---|---|---|
| 1987 | First edition of Distress Identification Manual published | 2003 | GPR study of SPS test section layer thicknesses conducted |
| 1987 | Inventory data collection begins | 2003 | FWD maintenance and overhaul manual developed |
| 1988 | First manual distress survey performed | 2004 | FWD Calibration Center and Operational Improvements Pooled-Fund Study initiated |
| 1988 | First FWD equipment purchased | 2005 | GPS data updated for test sites, weather stations, and weigh-in-motion scales |
| 1989 | FWD Operational Field Guidelines published | 2008 | Automated Weather Station data collection phase-out begins |
| 1989 | FWD data collection begins | 2009 | LTPP protocols adopted for AASHTO FWD calibration standard |
| 1989 | First inertial profiling equipment purchased | 2010 | Operation of FWD calibration centers transferred to AASHTO MRL |
| 1989 | First automated distress surveys (PASCO) performed | 2011 | FWD calibration protocol updated |
| 1991 | First FWD calibration protocol published |
2013 | FWD equipment and software upgraded |
| 1991 | First manual distress workshop conducted | 2013 | Profiling equipment and software upgraded |
| 1992 | First FWD calibration center opens | 2013 | Climate data upgraded |
| 1992 | Climate data collection begins | 2014 | Fifth edition of Distress Identification Manual published |
| 1994 | Automated Weather Station installations begin | ||
| 1994 | Global Positioning System units purchased |
||
| 2001 | LTPP SPS Traffic Data Collection Pooled-Fund Study initiated | ||
The data collection processes have involved both the highway agencies and the LTPP program's contractors. The highway agencies agreed to collect the materials and traffic data as well as friction data. In some cases, the highway agencies were not able to provide all of the data needed by the LTPP program to perform critical data analysis projects or studies. Therefore, the program initiated special data collection efforts such as the Materials Action Plan and the LTPP Specific Pavement Study Traffic Data Collection Pooled-Fund Study to collect these critical data elements (chapter 7). The remaining pavement-related data were collected by LTPP's contractor staff: regional support contractors, the technical support services contractor, equipment vendors, and service contractors.
Data QC was integral to data collection activities. Each regional support contractor is required to have a Quality Control Plan and Working Guide covering all aspects of data collection and review. The plan must be implemented and maintained. Through the years, the LTPP program has managed quality issues using various mechanisms such as unannounced field or office visits to observe data collection and processing procedures, conference calls, Data Analysis and Operations Feedback Reports, Operational Problem Reports, and Software Problem Reports.
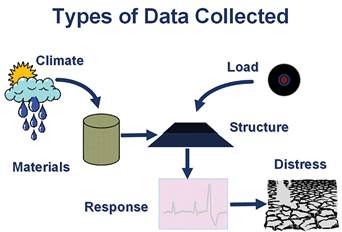 FIGURE 6.1. LTPP data collection categories. |
The different data types described in this chapter are collected at both the General Pavement Study (GPS) and Specific Pavement Study (SPS) experiments with few exceptions. Early in the LTPP program, most of the data elements were collected annually. However, as the funding levels for the program were reduced, the frequency of data collection was reduced.1,2 Some data elements have been collected more frequently for certain LTPP experiments, but nearly all of the experiments have annual monitoring data (e.g., distress, deflection, profile) in addition to inventory, and maintenance and rehabilitation data. These data elements are stored in the LTPP database in tables that are organized by modules, listed in table 6.1.
The source, type, method of capture, quality, and quantity of the different data elements are quite varied. With the exception of the Administration module, which contains no performance-related data and therefore is not discussed here, the remainder of this chapter describes each of the LTPP database modules and its associated data element(s).
It is important to mention that LTPP data are also used to develop special data sets. One example is the Mechanistic-Empirical Pavement Design Guide (MEPDG) data sets, used by highway agencies to calibrate the design models for their local pavement conditions. The MEPDG data sets, which are part of the Traffic data module, are computed data. Nearly all of the LTPP data modules have computed data'not collected or measured data'such as dynamic load response data, falling weight deflectometer backcalculation, and equivalent single-axle load values. Also, the SPS data module actually refers to inventory data for the SPS projects (as discussed later in this chapter).
| Database Modules |
|---|
| Administration (ADM) |
| Automated Weather Station (AWS) |
| Climate (CLM) |
| Dynamic Load Response (DLR) |
| Ground Penetrating Radar (GPR) |
| Inventory (as-built) (INV) |
| Maintenance and Rehabilitation (MNT and RHB) |
| Materials Testing (TST) |
| Monitoring (MON) |
|
|
|
|
|
|
|
| Seasonal Monitoring Program (SMP) |
| Specific Pavement Studies (SPS) Inventory |
| Traffic (TRF) |
Data collection for the LTPP program aims to measure, characterize, and quantify the factors that explain how and why a pavement performs as it does. Consequently, data collection was established to support the envisioned data analyses and product development.
Automated weather station (AWS) data collected from the LTPP test sections include site-specific weather information: air temperature, humidity, precipitation, solar radiation, wind direction, and wind speed. To understand the influence of various environmental conditions on the performance of a specific type of pavement, one must first learn what those conditions are.
Weather stations with remote data collection capabilities were installed at newly constructed SPS-1 (structural factors for flexible pavements), -2 (structural factors for rigid pavements), and -8 (environmental effects in the absence of heavy loads) projects. At some locations, particularly in Delaware, Nevada, Ohio, and Wisconsin, multiple SPS projects were located within a short distance of each other, reducing the number of weather stations required. Thus, it was cost beneficial to install a single AWS at these study sites.
The weather stations collected data at 15-minute intervals: air temperature, relative humidity, precipitation, solar radiation, and wind speed and direction. These data were accumulated into hourly, daily, and monthly statistics. Measurements began in August 1994 and continued through December 2008, with the start and end of data collection varying from one weather station to another. The automated weather stations were also intended to validate the data from the virtual weather stations (discussed in the climate data section).
Before data collection began, a review of commercially available weather stations was conducted, after which a Campbell Scientific, Inc. (CSI) unit was selected and installed on the grounds of the Federal Highway Administration (FHWA) research center for further evaluation. During the evaluation period, the LTPP technical support services contractor developed an automated weather station manual covering the installation of the weather stations, data collection, and maintenance.3 The initial training for installation occurred near Phoenix, Arizona, in July 1994. In September 1994, the LTPP program issued a directive (a written communication circulated program-wide to ensure uniformity in data collection) for its contractors to follow that described the installation, data collection, and maintenance activities required for the weather station.4 As weather station activities changed, the program issued subsequent directives to update procedures and complement or change instructions provided in the AWS Installation and Data Collection Guide.5 These directives covered such topics as parts replacement, sensor calibration, remote data collection, and preventive maintenance plans.
The weather instrumentation and equipment were centrally purchased by FHWA and shipped to the LTPP regional support contractors to install at the SPS sites. In addition to providing the instrumentation, the LTPP program also performed the data collection and maintenance activities through the regional support contractor staff. The highway agency sponsoring the site provided the concrete pad for the weather tower, the tipping bucket base, and compound fencing (figure 6.2). In most cases, telecommunication and power costs were assumed by the highway agency. See appendix C for more information on the type of AWS equipment and software used to collect, store, and process the weather data.
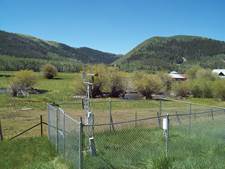 FIGURE 6.2. Complete automated weather station installation with protective fencing. |
Maintenance became a major issue for the weather stations. One of the problems encountered at the weather stations was the tipping buckets would become clogged with various types of debris. Similarly, the relative humidity probe filter would become plugged, retain moisture, and provide false high readings. Remote access was often an issue, as the modems used to connect the dataloggers with the LTPP regional support contractor's office computers were prone to lightning damage. The onsite storage modules were also prone to data retrieval problems that required returns to the office for data extraction.
Site visits were needed more frequently than had been anticipated. Maintenance was performed on the weather stations every 2 years, and exchange of instrumentation was part of the maintenance procedure. In addition, when collecting other LTPP data elements at a site, the regional support contractors visited the weather stations to inspect the equipment and perform minor maintenance (such as unclogging a tipping bucket rain gauge). However, at some locations, the highway agencies assisted with minor maintenance. Any instrumentation that needed to be returned to the regional support contractor's office was checked for accuracy using the manufacturers' guidelines. Out-of-tolerance instruments were either calibrated in-house (figure 6.3) or returned to the manufacturer for calibration. Most of the regional support contractors purchased equipment and spare parts for servicing the tipping bucket rain gauges and the wind monitors, but preferred to return the relative humidity/air temperature probe units and pyranometers to the vendor for calibration. In addition to maintaining the instrumentation, there was often a need to service the dataloggers, storage modules, and modems or to replace batteries.
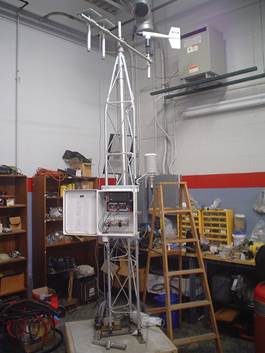 FIGURE 6.3. Prototype automated weather station used by the LTPP regional support contractors for in-house training of staff and to calibrate equipment components. |
Two DOS-based programs were developed to check the quality of the AWS data. The first was AWSScan, which performed basic data checks in the field including range, time-series consistency, and required data elements. One of the key functions of the AWSScan program was to make sure the measurement equipment was operating properly and alert the field technician to potential issues that could be corrected in the field. AWSScan was used at the time data were being downloaded, whether onsite or remotely. The second program, AWSCheck, was developed for office processing purposes and was used to combine raw data files, edit/remove invalid data, allow for time stamp corrections (that correspond with standard/daylight saving time), view additional graphical outputs for time-series consistency and logical ordering of climate statistics (i.e., maximum ≥ average ≥ minimum), generate upload files for entry into the LTPP database, re-compute daily statistics when bad hourly measurement values were deleted, and replicate the QC checks that would be performed after the data had been uploaded into the database. The time stamps needed adjustment because the time in the dataloggers did not change with standard/daylight saving time. All of the AWS data in the database are in local time (based on the location of each station's time zone). User guides for AWSScan and AWSCheck were developed in 1995 and 1996, respectively.6
The LTPP automated weather stations received regular maintenance and instrumentation replacement at 2-year intervals until 2006, when the decision was made to continue servicing only those stations that could be maintained with minimal investment of time and expenditure. As stations started to require maintenance due to component failure, they were dismantled or turned over to the respective highway agencies. Phase-out was completed in December 2008, and all sites were decommissioned. At the conclusion of the AWS data collection activities, 9 to 13 years of weather data had been collected from the SPS-1, -2, and -8 projects and stored in the LTPP database.
Unlike the AWS data which cover detailed data for a subset of the LTPP test sections, the climate data'precipitation, temperature, wind, and humidity'cover all test sections. The climate conditions at the GPS and SPS test sites have been obtained from the United States National Climatic Data Center (NCDC) and the Canadian Climate Center (CCC). The climate module includes data from both operating weather stations and 'virtual' weather stations. However, efforts are underway to improve the coverage, completeness, and quality of the LTPP climate data through the use of Modern Era-Retrospective Analysis for Research and Applications (MERRA)7 data from the National Aeronautics and Space Administration (NASA). These efforts are still ongoing, and hence the focus of this section is on the legacy approach that relied on NCDC and CCC data.
Because the LTPP test sites were not typically co-located with operating weather stations, it was necessary to extract data from nearby operating weather stations and, using a distance-weighted averaging function, create virtual weather statistics for each LTPP test site. One of the first steps in creating a virtual (i.e., statistical) weather station was to identify up to five operating weather stations (see example in figure 6.4) that met the following criteria in the order listed:
In the early years of the program, the services of a climate specialty contractor were used to obtain NCDC and CCC data, perform initial weather station selection based on the above criteria, and provide daily data from the operating weather stations to the LTPP program in ASCII format. Subsequent processing created the daily, monthly, and annual summaries for the virtual weather stations.
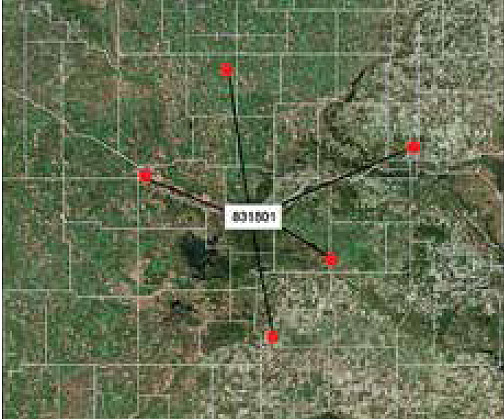 FIGURE 6.4. A virtual weather station (VWS). This example shows the locations of five operating weather stations used to create the VWS for GPS section 831801 on Trans-Canada Highway 1 in southwestern Manitoba. (Source: Esri, Digital Globe, i-cubed, Earthstar Geographics, CNES/Airbus DS, USDA, USGS, AEX, Getmapping, Aerogrid, IGN, IGP, Swisstopo, and the GIS User Community; created in ArcGIS 10.1) |
The climate data provided by the LTPP program are "computed parameters." In other words, they are estimates derived from measured values. Daily statistics (temperature, rainfall, wind speed, and humidity) are obtained from the operating weather stations and subjected to range and logic checks as defined in the LTPP QC Manual.8 Only data passing all data checks are used to compute the daily virtual weather station statistics. The daily statistics are aggregated into monthly and annual statistical summaries. Automated QC checks are performed on the monthly and annual statistics to verify reasonable ranges and logical relationships.
The last update of the climate data was performed in 2013 and included data through 2012, the most up-to-date data available at the time. This update used the raw data collected from the NCDC and CCC. The LTPP program has also incorporated into the Climate module data from NASA's MERRA project, which provides much finer spatial resolution and offers more data elements that can be implemented without the use of virtual weather station interpolation concepts.
The LTPP database contains data that measure the pavement response under controlled loading conditions for two SPS projects. These data, known as dynamic load response or DLR data, were collected in North Carolina and Ohio from 1996 to 1997.
In North Carolina, four Portland cement concrete (PCC) pavement sections at the SPS-2 project were instrumented to collect DLR data. In Ohio, asphalt concrete (AC) and PCC pavement test sections from the SPS-1 and SPS-2, respectively, were instrumented to monitor the DLR of vehicles with known weights.
Three types of instrumentation were installed at the project sites:
Thus, at each project site, a comprehensive set of data was collected-DLR measurements within the pavement and on the pavement surface, subsurface moisture and temperature conditions, and ambient conditions.
Results of the DLR initiative are discussed in LTPP Data Analysis: Influence of Design and Construction Features on the Response and Performance of New Flexible and Rigid Pavements.9 The North Carolina DLR data are included in the LTPP database. An update and reinterpretation of the DLR data collected between 1996 and 1997 from the SPS-1 and -2 sites in Ohio were made available in the LTPP database starting in 2013.
Pavement structure is one of the four primary factors whose separate and combined effects influence the performance of a pavement. To understand how pavement thicknesses vary along LTPP test sections, which are generally 500 ft (152 m) long, ground penetrating radar (GPR) measurements were performed on a subset of LTPP test sections. GPR is a nondestructive technique based on reflection of radio waves transmitted in the ground to determine subsurface changes in material properties. For pavement applications GPR is typically used to determine the thickness of pavement layers and the dielectric constant of paving materials. Among other potential applications are detection of subsurface voids and moisture concentrations.
The primary interest in GPR technology by the LTPP program was to measure pavement layer thicknesses. In 1994, a study of 10 GPS LTPP asphalt test sections in the southern and eastern United States concluded that GPR could be used to accurately characterize asphalt thickness.10 In 2002, the LTPP program initiated plans to collect GPR measurements on all SPS-1 test sections and at 1 jointed plain concrete pavement section at the Arizona SPS-2 site, 10 AC overlay sections at the Oklahoma SPS-5 (rehabilitation of AC pavements) site, and 5 test sections at the Oklahoma SPS-6 (rehabilitation of jointed PCC pavements) project site. Nineteen SPS sites consisting of multiple test sections were surveyed in 17 States within a 6-week timeframe in 2003.11
To ensure the collection of high-quality data, GPR measurements took place only on dry pavement surfaces. GPR data were collected along both wheelpaths at posted highway speeds. To precisely locate the GPR data for each pass, a photo-reflective laser switch, mounted to the rear of a survey vehicle, transmitted and received a signal pulse from polarized reflectors set up along each test section. These position pulses were automatically recorded in the GPR data files for each pass. The depth of the AC, treated base, and aggregate layers can be shown in a GPR report.
Only the interpretations of the GPR data from the 2003 measurements were included in the DLR module in the LTPP database; data from the 1994 study were not included. While no report on the findings from the 2003 GPR measurements was published, the LTPP program did not implement GPR measurement technology as a routine pavement measurement device on LTPP test sections.
Inventory data include location (e.g., latitude, longitude, state, county, route, milepost) of the test section, pavement type, layer thicknesses and types, material properties, composition, previous construction improvements, and other background information. Inventory information was collected for all GPS test sections and for SPS sections originally classified as maintenance and rehabilitation experiments. The inventory data in the LTPP database are supplied by the State and Provincial highway agencies. Structural information, such as shoulder width and milepost, was derived from highway agency project records or measurements taken at the test sections by the LTPP program. The inventory data includes:
Inventory data collection began in 1988 and continues with the inclusion of the latest LTPP experiments (warm-mix asphalt and pavement preservation experiments). Because some inventory data were incorrect or missing, various efforts have been undertaken to collect or correct the missing data. This was the case with the Program Assessment and Improvement Campaign in the mid-1990s, which looked at the availability of data for the LTPP test sections (chapter 11). The regional support contractors have worked very closely with the highway agencies to collect this information, and they continue to obtain inventory data from highway agencies whenever a maintenance or rehabilitation activity occurs at a test site. The inventory data module contains structural and location data for each LTPP test section, which are discussed below.
Collecting the structural data (layer types and thicknesses) presented challenges. Significant time and effort were needed to process huge amounts of data onto forms. Highway agencies often did not have the resources (staff, time, or funds) to locate data and complete data forms. Some data elements had not been collected by agencies, and some historical data had been discarded over time and were no longer available.
The LTPP program worked with the highway agencies to retrieve as much data as possible. Some agencies sent all of their data to the LTPP regional support contractor, who completed the required forms for the agencies. In other cases, the regional support contractors visited agencies to help collect data and complete the LTPP forms.
Agency data were not necessarily representative of the test sections'the data covered highway lengths of from 1 to 10 mi (1.6 to 16.1 km) while the LTPP sections were only a 500-ft (152-m) segment of that distance. Data had to be processed to determine a 'best fit' scenario for LTPP use.
The purpose for this data element was to establish accurate location information for every LTPP test section using maps, satellite technology, and other methods. The effort began with the agencies collecting latitude and longitude coordinates, and elevation data. After some initial investigations, discrepancies were found; for example, some data had been interpolated from maps that were only approximations of accurate measurements.
In 1994, first-generation Garmin® Global Positioning System units were purchased, and a new inventory form was developed to collect data onsite.12 Around 2001, newer generation global positioning units were acquired, as the technology had improved dramatically. Magellan® global positioning tracking devices were used. Then, in 2005, updated coordinates were collected from pavement test sections using modern global positioning system receivers.13 A test section's coordinates were also collected for AWS and weigh-in-motion (WIM) scale installations. The Garmin eTrex® Global Positioning System receiver (GPSr) with trip and waypoint (Model Legend C) was employed for this purpose. Data were typically collected by the LTPP regional support contractors, coinciding with manual distress surveys. Measurements were verified by comparing the coordinates with previous measurements and plotting the locations on digital maps. In cases where field measurements could not be performed, up-to-date mapping software (MapSource® 6.0 or Google Earth™ mapping service) was used. Measurements and location estimates were based on the World Geodetic System 84 datum. The original latitude, longitude, and elevation data were replaced with the new and more accurate data, which are stored in the LTPP database.
In 2007, the global positioning component of the location data was moved from the Inventory module and placed in the Administration module. Accurate global positioning coordinates are now available for all LTPP sites. In 2013, the LTPP program began collecting location data using the new GPSr equipment connected to the falling weight deflectomter and profile units.
The maintenance and rehabilitation data tables in the LTPP database have been consolidated in a single module. The maintenance tables contain information about treatments-seal coats, patches, joint resealing, grinding, milling less than 25 mm (1 inch), and grooving-applied to test sections after (and in some cases before) the section's inclusion in the LTPP program. The rehabilitation tables contain information on resurfacing, reconstruction, joint repair, and similar activities, which typically alter pavement structure.
Maintenance-type treatments that are reported by highway agencies and stored in the LTPP database include thin surface treatments, crack sealing, joint sealing, and patching performed on in-service test sections. Obtaining the data elements that are needed to accurately and completely document maintenance activities performed on GPS and SPS test sections has been a challenge throughout the LTPP program. This effort has been complicated by the wide variations in maintenance policies, practices, and data collection procedures among agencies, and the need for coordination between the agencies and the LTPP program.
LTPP maintenance data document surface treatments that do not change pavement structure-seal coats, crack sealing, patching, joint sealing, grinding, grooving, and shallow milling.
The highway agencies were asked to follow a maintenance policy that required coordination with the LTPP regional support contractor responsible for data collection at sections located within their State or Province. Through this coordination and advanced notification that a maintenance activity is scheduled to take place, the value of the data obtained from a test section after it had been monitored for a number of years would be increased significantly because a set of performance data could be obtained prior to and after the maintenance treatment. Maintenance decisions and agreements between each agency and the LTPP program were worked out with a cooperative spirit, with consideration for the needs of the agency. The agency was asked to provide all details of the maintenance activity on the LTPP maintenance data sheets to facilitate entry into the LTPP database.
Although this cooperative spirit existed between the highway agency and the LTPP program, on many occasions a maintenance activity was completed without the program's knowledge. As a result, the last data point before maintenance took place, which is critical to understanding a pavement's long-term performance, was not collected. Also, sufficient data were not always available to establish a new starting point for the LTPP section after maintenance took place. In these cases, the LTPP regional support contractor made every effort, working with the highway agency, to obtain the details of the maintenance activity that had been performed. These efforts included visiting agencies, searching through files and archives, and talking with staff who were at the job site when maintenance was performed. Often, further information was retrieved, but some maintenance data remain missing.
The collected maintenance data provide information such as when the activity was performed and the materials, construction equipment, and practices used. The following guides have been used in collecting the data: Long-Term Pavement Performance Maintenance & Rehabilitation Data Collection Guide;14 Specific Pavement Studies, Data Collection Guidelines for Experiment SPS-3, Maintenance Effectiveness for Asphalt Concrete Pavements;15 and Specific Pavement Studies, Data Collection Guidelines for Experiment SPS-4, Maintenance Effectiveness for Portland Cement Concrete Pavements.16 LTPP program directives also provide additional information.17
LTPP rehabilitation data document a change to the pavement's original structure.
Most rehabilitation procedures, such as recycling or placing overlays, produced a test section with a modified pavement structure. Other procedures, such as undersealing, were considered to restore the existing pavement structure. Reworking shoulders and placement of edge drains are other examples of improvements that could be made without changing the primary pavement structure.
Highway agencies were asked to notify the LTPP program whenever rehabilitation was planned, so that the condition of the pavement could be observed and recorded prior to the rehabilitation activity. They were also responsible for providing the program with information about the treatment.
The LTPP program had to ensure that all rehabilitation data were complete and processed promptly and thoroughly because these data were key to successful data analyses. In many cases, not all of the required information was provided to give a new starting point for the LTPP test section. More intensive searches on the part of the LTPP regional support contractors, as with maintenance data, yielded positive results. However, rehabilitation data for many LTPP test sections are still missing. Although this missing data can be added to the LTPP database if the highway agencies are able to provide it, the rehabilitation test sections where data continues to be lacking may provide little to no value for certain data analysis studies.
LTPP documents provide guidelines regarding when a section that had undergone rehabilitation could continue to be monitored by the program. These documents include the Long-Term Pavement Performance Maintenance & Rehabilitation Data Collection Guide,18 guidelines specific to SPS sections,19 and LTPP program directives.20 Some of the rehabilitation treatment types caused a section to be removed from further study. Others resulted in the test section being moved to a new experiment. In some cases, there was overlap between SPS-5, -6, -7 (rehabilitation studies), and GPS-6 and -7 (overlays of AC and PCC) rehabilitation data. Some data for the SPS rehabilitation experiments are stored in the maintenance and rehabilitation module and not in the respective SPS module. Access to these data has been streamlined in the new LTPP InfoPave' system.
The LTPP database has materials sampling and testing information for all test sections. The primary objective for performing materials sampling and testing was to provide a comprehensive evaluation of the pavement layer structure and layer thicknesses of the pavement materials used in each section or project. The material testing data represent the condition of the material at the time of sampling and testing. The work was accomplished by core drilling, augering, test pit opening, sampling, and nuclear density testing, followed by performing a suite of laboratory material characterization tests (see sidebar, next page). To help with data collection, standard material sampling and laboratory testing protocols with data entry sheets were developed to record the data collected in the field and in the laboratory.
The GPS and SPS experiments followed different approaches to materials sampling. For GPS experiments, FHWA contracted out this task, and a drilling supervisor from the LTPP regional support contractor's office was responsible for QC. For SPS experiments, the highway agencies were tasked with the drilling. In addition, the sampling approach for each SPS experiment was different. A material sampling guide was prepared for the GPS experiments, and specific sampling guides were prepared for each of the SPS experiments.
The initial GPS Materials Sampling and Testing Guidelines were issued in May 199021 and finalized in February 1991.22 A series of SPS Materials Testing and Sampling Guidelines was developed between November 1989 and February 1996. The Laboratory Testing Guidelines were finalized in May 1992, but a series of revisions was issued between October 1992 and September 2001. In 2007, the Long-Term Pavement Performance Project Laboratory Materials Testing and Handling Guide was issued.23
For projects that received overlays that were still to be monitored by the LTPP the program, the agencies would obtain the materials with assistance from the LTPP regional support contractors, who were responsible for getting the right materials to the right location for testing. The regional staff assisted the agencies' drilling crews during the sampling operations to ensure that the onsite sampling operations were completed accurately, efficiently, and safely. The safety of the operating crews as well as the traveling public was of the utmost importance.
Before going to each of the LTPP sites to collect samples, a formal plan was prepared indicating the sections, locations of the samples, and different layers that were to be collected from each location. The location numbers and sample numbers also needed to be defined. For each SPS project, a unique sampling and testing plan had been prepared before the project was constructed. The SPS experiment-specific guidelines provided the approach to be used in preparing the project-specific plans before, during, and after construction of the SPS sections. The advance planning ensured a smooth process of sample collection, labeling, wrapping, and transportation to the designated labs.
All samples collected were marked with a pen or labeled with a keel chalk immediately after sampling. Blue (AC samples), white (PCC samples), or yellow (granular material) labels were also prepared for each sample and taped or inserted inside the bag or the box where the sample was to be stored. Labels contained the State code and LTPP test section ID, sample location, sample number, sample date, and field set number.
While the core samples were set aside to dry, the regional staff measured and recorded the length of the cores and the quality of the samples before they left the site. Cores were also marked to indicate the direction of traffic. Once the cores had dried, they were wrapped with transparent plastic film and bubble wrap to prevent damage and packaged for shipment to the designated laboratories.
Materials data included information necessary to characterize the various layers of each test section. The testing was performed by highway agency laboratories and by laboratories contracted by FHWA. For example, a laboratory hired by FHWA performed all of the resilient modulus tests. In addition, the concrete laboratory at FHWA's highway research center performed the PCC coefficient of thermal expansion testing. Each laboratory has an ID number in the LTPP database.
MATERIALS SAMPLING AND STORAGESampling Activities Materials sampling activities are performed at the LTPP test sections using special equipment such as the dynamic cone penetrometer, shown below. The materials collected are tested in a laboratory, the data are stored in the LTPP database to provide information for pavement analyses, and the samples are stored in the Materials Reference Library (MRL).
Materials Reference Library The MRL was created in the late 1980s under the Strategic Highway Research Program (SHRP) in Austin, Texas, to provide a central storage facility for asphalt cement and aggregate samples collected under the Asphalt Research program and for pavement and subsurface materials samples collected from the LTPP test sites across the United States and Canada. One of the facility's main objectives is to address a problem associated with the original American Association of State Highway Officials Road Test, conducted in Ohio in the 1950s, where there was a shortage of materials available for subsequent research. In 1993, the FHWA-LTPP program took over management of the MRL facility and moved it from Austin, Texas, to Reno, Nevada. The MRL continues to be managed by FHWA to store materials samples for the LTPP test locations. Over the years, other pavement research programs, such as the Asphalt Research Consortium, WesTrack, the FHWA Crumb Rubber Modifier Project, and the WesTrack Project have sent samples from their test sections for storage in the MRL. Materials from the research conducted at the National Center for Asphalt Technology and the Western Research Institute are also stored there. The MRL stores over 1,000 tons of asphalt cement, Portland cement, natural aggregates, and combinations of these materials in both loose and core forms. In addition to storing the samples, the MRL maintains a temperature-controlled room to house photographic film records of distress collected from the LTPP test sites. Most of the materials at the MRL are from LTPP projects, including samples taken during construction of the SPS test sections. The materials samples have been used to support more than 30 national highway research projects. The samples enable the application of as-yet undeveloped test methods to LTPP materials, thereby enabling updates of the LTPP data to reflect new technologies. The MRL will continue to provide a common pool of materials for future research. The samples are available to the public, and more detail is available at the MRL Web site (http://192.186.205.27/ltppt/mrl).
|
In the early stages of the LTPP program, all samples collected from GPS sites were sent to LTPP contractor laboratories to perform the required laboratory tests. Later, when an overlay was placed at a site, some of the cores were sent to the highway agency's laboratory for testing in addition to the LTPP contactor laboratory that ran resilient modulus tests on these cores.
The samples collected from the SPS projects before, during, and after construction were sent to both the agency lab for testing and to the LTPP contactor laboratory that ran resilient modulus testing and other tests. It is important to note that the quality of the SPS materials test data was always a concern for the LTPP program as testing was done by numerous laboratories (i.e., a different laboratory for each highway agency or, in many cases, agencies had more than one laboratory perform the testing). As a result, the LTPP program kept the option open to repeat some of the tests performed by the highway agencies. Some SPS projects were still missing materials data, as was discovered during an LTPP program assessment,24 so the LTPP program developed a plan to collect this missing data. The details of the Materials Action Plan are described in the following chapter, Special LTPP Data Collection Efforts.
Just south of Winston-Salem in North Carolina, a pilot study was conducted to field test the Materials Sampling and Testing plan and the falling weight deflectometer protocol testing patterns. The pilot took place December 7, 1988, but due to a rare snow storm that hit Winston-Salem that day, the testing was completed on December 8. This GPS test section, 373807, was the first site where data were collected for the LTPP program. Officially, LTPP data collection began in 1989.
The monitoring data module contains pavement performance information that is collected primarily by LTPP contractors. Since 1988, with the first materials and falling weight deflectometer data collected at LTPP test section 373807 in North Carolina, the LTPP program has been collecting distress, drainage, friction, rutting, and longitudinal and transverse profile data, with some exceptions. (Friction data were collected by the highway agencies and submitted to the program for inclusion in the LTPP database. The drainage data were collected by LTPP contractors for only a subset of LTPP test sections for a few months.) More information about each data type is discussed in this section.
One of the six objectives of the LTPP program is to improve pavement prediction and design models (as discussed in chapter 1). A variable needed to accomplish this objective is the change in seasonal and long-term response to pavement loads. For both GPS and SPS sections, the LTPP program uses the falling weight deflectometer (FWD) to measure the deflection response of a pavement to a load of known magnitude. The program has conducted basin tests on AC and PCC pavements and load transfer tests on PCC pavements.
LTPP program efforts have significantly improved the accuracy and precision in measuring pavement strength. Ultimately, efforts within the program to achieve greater reliability and precision in FWD data resulted in the establishment of calibration centers around the country and the development of much-improved nationwide calibration standards: LTPP protocols formed the basis for American Association of State Highway and Transportation Officials (AASHTO) Standard Recommended Practice R 32-09, Calibrating the Load Cell and Deflection Sensors for a Falling Weight Deflectometer, adopted in 2009 by AASHTO, and updated as Standard Recommended Practice R 32-11.25,26 This section highlights some of the activities that culminated in those advancements, which are detailed in chapter 10.
LTPP activities in FWD calibration led to the adoption of a national FWD calibration standard: AASHTO Standard Recommended Practice R 32-11.
FWD Data Collection and Equipment
Parts of the FWD data collection process are automated'the computer controls the operation, acquiring and processing the data at high speed. In addition to sensing and recording load and deflection data, the system measures and collects air and surface temperature, time, and distance traveled on the roadway data. Some manual measurements are required, however: the FWD operator uses a probe to measure the subsurface temperature. Initially in the LTPP program, the subsurface temperature measurements were taken at three depths, but later these measurements were taken at five depths depending on the pavement structure. In 2003, the FWD gradient temperature data collection changed from drilling temperature holes at 25 mm from the top, at the middle, and 25 mm (1 inch) from bottom of the pavement surface layers to set intervals of 25, 50, 100, 200, and 300 mm (1, 2, 4, 8, 12 inches) from the top of the pavement surface. The operator also measures the width of joints when testing load transfer efficiency on rigid pavements. Any cracks or surface distresses that might affect the measurements are included in the operator's report.
During the early years of the LTPP program, under the Strategic Highway Research Program (SHRP) and later under the management of FHWA, each LTPP regional support contractor was responsible for storing, maintaining, and operating an FWD unit and its towing vehicle. The first four FWD units were purchased in 1988. The FWD equipment has been replaced or upgraded four times over the course of the program (in 1995, 2000, 2002, and 2014), and when FWD data collection was expanded in 1995 to meet the added demands of the SMP and new SPS sites, one additional FWD was purchased for each region to permit the expanded data collection resulting from these new demands.
Figure 6.5 shows an FWD used by the LTPP program to collect deflection data. See appendix C for more information on the type of FWD equipment and software used to collect, store, and process the data over the years.
FWD equipment comparisons were held periodically, where the FWDs from the four LTPP regions were brought together to assess their performance. Referred to as 'FWD thump-offs,' these comparisons were used to qualify newly purchased equipment for acceptance and program use, to perform periodic evaluations of the equipment's operational status, and to conduct cross-training exercises for regional contractor staff (figure 6.6). The thump-offs were later dropped in favor of FWD User Group meetings, where regional FWD operators and coordinators had an opportunity to review problems and exchange information on the operation and maintenance of the FWD equipment and analysis of FWD data.
 FIGURE 6.5. Van-towed falling weight deflectometer equipment used in the LTPP program. |
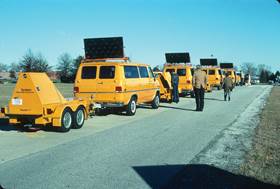 FIGURE 6.6. Falling weight deflectometer equipment at the first LTPP 'thump-off,' which was held at Purdue University in November 1988. |
FWD Maintenance
Continuous preventive maintenance is necessary to keep the complex hydraulic-electrical-mechanical FWDs operating under demanding conditions to collect high quality data and pass rigorous annual reference calibrations. The LTPP program developed a preventative maintenance plan to ensure that the FWDs (and other equipment) are maintained to a high standard. The manufacturer's owner's manual provides guidance on most repairs and troubleshooting; however, eventually, after years of service, FWDs require a complete overhaul, which the program has successfully done in recent years.
In spring 2003, the LTPP Southern Regional Support Contractor overhauled one of the FWDs operated for the LTPP program, documenting the complete disassembly and reassembly with instructions and photographs. This maintenance and overhaul manual provides FWD owners, operators, and technicians with instructions and guidelines that supplement the Dynatest 8000 owner's manual (figure 6.7).27 In 2014, the LTPP regional support contractors completely overhauled all of the FWD equipment with the Southern Region playing a key role in this activity.
FWD Quality Control Checks
Five validity checks (roll-off, nondecreasing deflections, overflow, load variation, and deflection variation) were built into the FWD software to alert the operator of possible problems.28 To further check the integrity of the data, the FWDScan software was created for use in the field and again in the office to check data files for completeness and readability and to flag potential problems before data are loaded to the LTPP database. Similarly, the LTPP program developed FWDCheck to allow for subdividing the FWD deflections into uniform sections and provide statistical information on the FWD readings. This check was developed because earlier backcalculation exercises lacked uniform sections, which influenced the FWD results. FWDCheck also generated an overall structural capacity in terms of effective Structural Number.
 FIGURE 6.7. The cover of the FWD maintenance manual, used to keep the units operating at peak performance. |
Another QC check used by the LTPP program is a deflection sensor location program called SLIC (an acronym for the authors Stubstad, Lukanen, Irwin, Clevenson).29 This program was developed and tested on FWD data collected by the LTPP program. Its LTPP use is summarized in Study of Long-Term Pavement Performance (LTPP): Pavement Deflections.30 SLIC was a QC check for the sensor locations. The LTPP regional support contractors used engineering judgment to determine whether or not to use the FWD data based on the data's overall quality.
Because the FWD data are intended for research use, the collection protocols required many more data than would be needed for routine pavement evaluation and rehabilitation purposes. Four drop-heights of equivalent 6,000-, 9,000-, 12,000-, and 16,000-lbf loadings (26, 40, 53, and 71 kN) were selected for AC pavements and three drop-heights of 9,000-, 12,000-, and 16,000-lbf loadings for rigid pavements. Random errors in readings were handled by taking four drops at each height. Sensor history data were collected for each sensor and the load cell at the fourth drop of each height. A 60-millisecond window was used to capture the history data.31' Just as the FWD equipment has been updated over the years to improve data collection, the various software procedures used to ensure quality deflection data have also been updated as needed (appendix C).
Establishment of FWD Calibration Centers
At the first FWD thump-off, in 1988, SHRP recognized the need to ensure that data being collected from each FWD unit be comparable across the LTPP program. As a result, the early program managers developed a methodology to calibrate FWDs to an independent reference standard and established centers to carry out the calibrations.
The Dynatest FWD, which has been used by the program, repeats itself very well, but comparison of the FWDs among the regions revealed statistical differences. Efforts were begun to reference-calibrate the FWDs by adjusting the sensor readings to a reference sensor to reduce significant statistical differences between the units. The prototype for this calibration procedure was developed at Cornell University in Ithaca, New York, in 1988.32 Initial trial comparisons were conducted at Purdue University with the participation of all four LTPP regional FWDs. The results of the comparisons showed that, when calibrated, the four SHRP FWDs could be used interchangeably. A calibration protocol was published in 1991,33,34 updated in 1994,35 and revised in 2011.36
The first production calibration center was built at the Pennsylvania Department of Transportation (PennDOT) Bridge and Maintenance Office in Harrisburg and operations began in 1992. In the same year and using the same protocol, additional calibration centers were opened in Texas, Nevada, and Minnesota. At the completion of the calibration centers, a round robin "Cal Off" was conducted with all four SHRP-LTPP regional FWDs. This comparison indicated there was minimal difference between the calibration centers, although some problems specific to individual centers were noted. This activity also allowed the FWD operators to compare their regions' procedures with the other regions and refine them, if needed.
The LTPP program provided the calibration centers (1) annual QA review and certification of the center operators and (2) technical services'training, troubleshooting, equipment replacement, and annual reference load cell calibration. Figure 6.8 shows an FWD readied for testing in an LTPP calibration center.
When the need to upgrade the calibration centers exceeded LTPP program resources, FHWA initiated, in 2004, Transportation Pooled-Fund Study TPF-5(039): Falling Weight Deflectometer (FWD) Calibration Center and Operational Improvements.37 This study resulted in new, highly portable calibration equipment and in updates and improvements in the FWD calibration procedure.38 The new procedure is demonstrated in a video available at the LTPP program's InfoPave Web site.
Also among the pooled-fund study's several objectives was to identify a source of support for the calibration centers over the long term. The study determined that the AASHTO Materials Reference Laboratory (AMRL) was qualified to continue providing these calibration center support services in the future. FHWA and AASHTO worked together on transitional activities over 2 years, resulting in a complete transfer of calibration center support to AMRL on September 1, 2010.39,40 AMRL now provides the centers the review, certification, and technical services previously provided by the LTPP program.
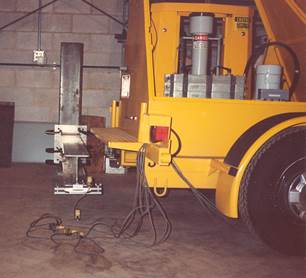 FIGURE 6.8. An FWD being calibrated at the PennDOT regional calibration center early in the LTPP program. |
Frequency of FWD Calibrations
The LTPP program requires the regional FWDs to have annual reference calibrations, every 9 to 14 months and following any repairs or major maintenance of FWD sensors or processor.41,42
While the FWD calibration procedures have been updated over the years, the load cell calibration remained unchanged. However, the deflection sensor calibrations were modified to allow for a group of sensors to be calibrated in a stand with an accelerometer versus the linear variable differential transformer (a deformation measurement device) used as the reference device. This simplified the procedure and made it less dependent on soil and slab condition.
FWD Manuals
In 1989, the SHRP-LTPP Manual for FWD Operational Field Guidelines, Version 1.0, was published, outlining the requirements for test setups for both flexible and rigid pavements, monthly relative calibrations, and temperature data collection requirements.43 In 1992, six sets of SPS site-specific guidelines were also issued. Interim changes in protocol were provided to the LTPP regional support contractors in the form of program directives, and the FWD manuals were updated to incorporate the SPS-related guidelines, revised calibration procedures, software changes, and step-by-step instructions for FWD data collection in 1993 (version 2.0),44 2000 (versions 3.0 and 3.1),45 2005 (version 4.0),46 and 2006 (version 4.1).47
Major changes in the guidelines were occasioned by implementation of the Dynatest25 (Dyna25) software in 2000 and FWDWin in 2005. After the Texas 1996 reference center calibration comparisons and operator exchange session, the LTPP regions performed follow-up testing with the Dyna25 software, and in September 2000 were directed to fully implement the new software and Operational Field Guidelines, Version 3.1. Subsequent versions simplified some of the earlier instructions and incorporated LTPP program directives into the text.
FWD Meetings
FWD comparisons were conducted and provided an opportunity to review problems and allow for exchange of information among FWD operators. These comparisons were later dropped in favor of attendance by the LTPP regional FWD coordinators at FWD User Group meetings, which were also a venue for FWD calibration center meetings. These annual meetings were formed as a means for the exchange of information on the operation, maintenance, and analysis of FWD data. These meetings gave the LTPP program an opportunity to meet with highway agency staff which was very important in the early days of the program.
Distress surveys are performed to document the condition of the surface of LTPP test sections in terms of visible distresses-such as cracking, defects, deformations, joint deficiencies, rutting-by severity and quantity. Distress data have been collected using both photographic (film-based) surveys and manual surveys. Photographic surveys were the priority with manual surveys serving as backup at the start of the LTPP program. However, significant differences were noticed between the two methods, and so the program gradually began to depend more on the manual survey because of the known limitations with the photographic survey and the increased confidence in the distress rater accreditation process.
Photographic Distress Surveys
The photographic distress survey's objective was to provide a record of distress for data interpretation and archival purposes. Under SHRP management, a contract was awarded in 1989 to Pacific Aerial Survey Company (PASCO USA) of Japan to collect the permanent distress records for all test sections in each of the four LTPP regions beginning in the fall of that year. PASCO was the only vendor able to record cracks as small as 1 mm in width using backlit cameras and 35-mm film. Between contracts, PASCO sold their North American rights and equipment to Cumberledge, Gramling and Hunt (CGH) around 2000, who subsequently bid and were successful in retaining the contract with FHWA.
In the early part of the LTPP program, photographic surveys were conducted once every 2 years. As time passed, surveys were subject to budget constraints and typically occurred once every 3 to 5 years. Due to funding limitations, 2004 was the last year that CGH performed photographic surveys. At the conclusion of the last photographic survey contract, the LTPP program began collecting detailed photographs of the test sections with each manual survey, so in effect the program is still collecting a photographic record of the LTPP test sections.
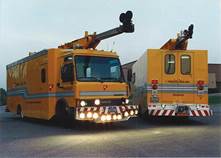
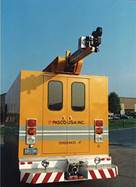
The photographic distress permanent record systems in the early 1990s were housed in vans (figure 6.9). The distress was recorded on high-resolution 35-mm black-and-white motion picture film from overhead cameras directed at the pavement. Testing was conducted at night using artificial lighting to produce the highest quality images and minimize disruption to traffic.
Photographic distress or permanent record surveys had to be performed under dry conditions and were not taken at remote locations (e.g., Hawaii, Alaska, Puerto Rico, and Newfoundland). Also if the PASCO unit was not able to get to a test section prior to maintenance, rehabilitation, or closeout activities, then a manual distress survey was performed. Due to limitations with the PASCO data collection system (such as not being able to detect low-severity hairline cracking (< 1 mm) or to rate joint seal damage and crack sealant, faulting, and severity of potholes), the LTPP regional support contractors began to concentrate on doing manual distress surveys when visiting the test sites for other reasons, such as FWD testing. This ensured that distress data would be available and that data elements that were not available from the PASCO film could be obtained.
Photographic Distress Interpretation
PASCO/CGH performed the initial distress rating, and sent the film to the technical support services contractor, who performed the secondary review and QA, performed distress ratings, and electronically logged the resulting distress types, severities, and quantities. The electronic copy of the data was provided to the regional support contractors for additional QA and to load into the LTPP database, and hard-copy outputs were provided for review and historical records. Computer-generated distress maps were also produced (figure 6.10).
The SHRP Distress Identification Manual (described in the Manual Distress Surveys section) for rating distress was used to determine the severity and extent of each distress. Some distress types could not be easily determined from the film. These are listed below by pavement type:
 |
 |
 |
| FIGURE 6.9. Mobile equipment used to photograph pavement distress. Mounted on a boom extending from the front of the vehicle is the motion picture camera, synchronized with vehicle speed for continuous filming; flood lights are mounted on the custom front bumper. On a boom extending from the rear of the vehicle is a 35-mm pulse camera, which collects transverse profile. The camera is controlled by a distance measuring instrument that can trigger the camera at preset intervals; a strobe projector is mounted on the rear bumper. | ||
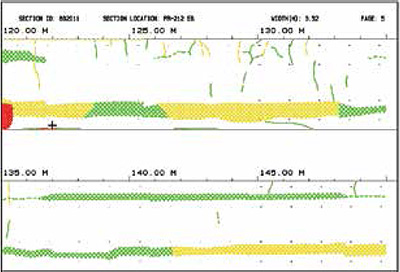 FIGURE 6.10. Sample of a computer-generated distress map from PADIAS 4.2 software. |
The film images were rated using the Film Motion Analyzer (figure 6.11) which PASCO USA had developed for the LTPP program. This device projected the film image onto a digitizing board. Because the film was on spools, the apparatus included a system to move the film through the projector. Initially a grid system, Pavement Distress Analysis System (PADIAS) 1.0, was used to determine the area and length of distresses; later a vector system, PADIAS 4.2, was developed. A study of LTPP distress data variability in the late 1990s found that 'Although differences in data interpreted with the PADIAS v1.x and v4.x systems exist, there is excellent overall agreement between the two systems for all pavement types, especially for total distress quantities and for cracking-related distresses.'48
Photographic Distress Quality Control Checks
The four LTPP regional support contractors performed a QA check on 10 percent of the distress data interpreted by the technical support services contractor from the film images before accepting it for loading to the database. The regions had a similar but somewhat less sophisticated apparatus and setup for checking the film as compared to the technical support services contractor. Three copies of the film were produced: a copy retained by PASCO, a copy provided to the technical support contractor for rating (which was then forwarded to the regions for secondary review and storage), and a third copy for the highway agency. Due to the sensitive nature of the film and to preserve the film's images, the canisters that were stored at the regional offices early in the program were later transferred to an environmentally controlled room at what is now the LTPP Materials Reference Library in Sparks, Nevada. (The reference library was begun under the SHRP asphalt program and later transferred to FHWA-LTPP management.)
QC/QA procedures were put in place with the automated distress survey contractor. Initial data reviews found discrepancies in the database between the photographic and manual distress ratings. This was particularly noticeable when using Distress Viewer and Analysis (DiVA), a stand-alone software tool developed in 2000 by the LTPP program to plot the historical changes in distress over time.49 This resulted in a decision to redo the ratings on all the film (except SPS-3 and -4) using the PADIAS 4.2 software.
As part of the QC/QA procedures, film distress raters were required to attend distress rater accreditation workshops to become accredited FHWA-LTPP distress raters. This was to ensure that qualified personnel were performing the distress interpretations and that the ratings would be similar to those of the manual distress surveys. Due to the different data collection methods, some discrepancies were still sometimes evident between the photographic and manual distress survey methods.
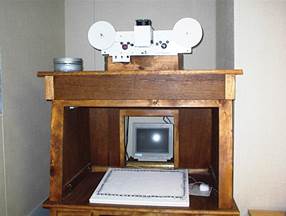 FIGURE 6.11. Film Motion Analyzer. |
Manual Distress Surveys
Manual distress surveys were initially instituted as a backup to the permanent film record distress method. These "walking surveys" were performed by trained and accredited raters. Before becoming a designated scheduled LTPP activity, manual distress surveys were not routinely performed by the LTPP regional support contractors except in the Southern Region, where manual distress surveys were performed at all sites as part of the site selection and verification process and later at sites visited for FWD testing. In 1995, the LTPP program issued a directive that outlined the measurement frequency and priorities for manual distress surveys.50
Stringent guidelines for the identification, interpretation, measurement of the quantity, and determination of the severity of the distress, and documentation of the findings were followed. Raters were also required to provide manually prepared distress maps, photographs, videos, and distress data forms as needed to record the conditions at the time of the survey and any unusual distresses observed. These requirements were described in the SHRP Distress Identification Manual (DIM), which was used to conduct the surveys. Development of the initial manual was funded by FHWA prior to the launching of SHRP, to be used in the distress data collection that would be performed under the original SHRP program. The manual was written by SHRP's technical assistance contractor and drew on various Federal and State/Provincial manuals. The photographs included came mainly from these documents.51 The manual contains the forms that surveyors use to record and summarize cracks, faulting, and other surface distresses observed on the pavement during a manual survey (figure 6.12). These forms provide input to the LTPP manual distress data module.
After a second DIM was published in 1990,52 ratings became more consistent among all of the LTPP regions. The third version of the DIM was issued in 1993,53,54 and the fourth version, released in 2003, incorporated refinements, changes, and LTPP program directives that had been issued since the previous edition.55,56 The DIM was updated in 2014 in its fifth version.57
Following release of the fourth version, the LTPP program developed four pocket editions to assist field engineers in conducting manual distress surveys. Plasticized and durable, the pocket guides covered distress identification for AC, PCC, and CRCP, with an additional AC guide designed for local agencies.58 The pocket guides were developed by the North Dakota Local Technical Assistance Program Center for use by local agencies with funding from FHWA. The Baltimore FHWA Resource Center reprinted a modified version. Both the technical assistance program center and resource center versions were printed in 2005.
The DIM is also used in workshops to provide examination and accreditation to LTPP distress raters in identifying various pavement distresses. These workshops were initiated early in the program to ensure consistency in data collection among different raters throughout the LTPP regions.
Over the course of the LTPP program, procedures for manual surveys changed as technical developments occurred or funding was adjusted. Some examples follow:
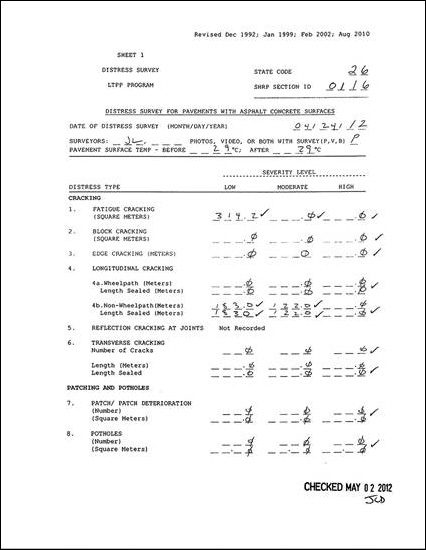 FIGURE 6.12. Example of the multipage forms used to record distresses observed during LTPP manual distress surveys. For each pavement type, a different form is used to record surface distresses. This is page 1 of the form for asphalt concrete pavement. |
Manual Distress Workshops
The first manual distress workshop was conducted in Arlington, Texas, in 1991, with representatives from all four LTPP regions attending. There were many discussions on what constituted distress, how it should be categorized, and what parameters should be used for ratings. There was also a distinct difference between how individuals from the north perceived distress and severity levels versus those coming from the south. Based on this workshop, it was evident that work would be required to get a consensus on what distresses would be categorized and how. For example, some of the more significant issues that required resolution were how to rate the distresses in the wheelpath, identify the cracks (e.g., longitudinal, fatigue), and rate the extent and severity of each distress.
Early reviews of regional distress surveys for consistency between raters indicated a need for training and standardization. Therefore, the LTPP program developed a workshop for accreditation of the LTPP regional distress raters.61 The raters were to be trained within the region and would attend the workshop to be accredited to conduct distress surveys for the LTPP program. Distress accreditation workshops were conducted every 2 years and included a distress presentation, field review of distresses, distress rating on flexible and rigid pavements, and the accreditation. The distress workshops were rotated among the regions, and accreditation expired after 24 months (or could be extended to the next available workshop). Other requirements, such as the need to conduct a minimum of 15 manual distress surveys each year, were added to ensure that only experienced raters were performing the manual distress survey duties, thus ensuring research-quality results.62 Between 1991 and 2014, the LTPP program has held 38 manual distress workshops, 32 for LTPP regional support contractor raters, and six for PASCO/CGH raters. In the early years of the program, two to three workshops were held each year; currently one workshop is held each year. Figure 6.13 shows a field exercise at a manual distress workshop.
Office Review of Surveys
Internal LTPP regional office reviews of distress surveys are also conducted. They include detailed checks for errors in math, summarization, and visual comparison with previous surveys regarding distress types and quantities.
After the initial mathematics checks and overall review, the manual distress survey is compared to the last visit for a time-series check. When noticeable discrepancies from survey to survey were found, a program directive was issued allowing the rater to take the prior survey maps into the field. Once the survey had been performed and summed, it was checked against the prior survey while on site. This allowed an explanation of the differences in distress before leaving the site.63
Back in the office, the LTPP regional support contractors conducted reviews of the distress data entered into the database. In 2004, the DiVA software was issued for use as an integral part of the regional office QC/QA activities, as well in the time-series evaluation of distress data (figure 6.14).64 The purpose for this software has been served, and it is no longer being used by the LTPP program for distress reviews.
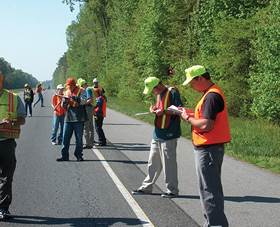 FIGURE 6.13. Participants in a field review of distresses at an LTPP distress accreditation workshop. |
The drainage data contain information on the inspection of drainage features and, more specifically, information on the condition of the edge drain systems and the location of the lateral-side drainage structures. Drainage information gathered includes the presence and type of subsurface drainage features, such as permeable layers, transverse drains, and longitudinal drains. The best source of information on the effect of in-pavement drainage systems will be from comparison of the drained and undrained sections on SPS-1 and SPS-2 projects.
Two investigations were performed to explore the condition of the edge drains at the SPS-1, SPS-2, and SPS-6 projects. Although some GPS projects contain edge drains, they were not included as a primary experimental factor.
The first investigation included a video survey, wherein a camera on the end of a semi-flexible cord was inserted into the outlet and pushed into the drain pipe, recording the condition of the outlet itself as well as the drain pipes' condition (figure 6.15). Observations included crushed pipes; sags; ponding water; pipes clogged with dirt, silt and construction debris; and numerous animals and their nests. The intent of this investigation was to determine the degree to which the pipes were properly constructed, and, if it was necessary to clean them out to ensure proper operation. Edge drain videos and reports were sent to the respective highway agencies, and the completed inspection forms (and associated data) were entered into the LTPP database.
The second drainage investigation conducted at the LTPP test sites included field investigations to evaluate the effectiveness of the drains themselves. As part of the study, Effects of Subsurface Drainage on Performance of Asphalt and Concrete Pavements: Further Evaluation and Analysis of LTPP SPS-1 and SPS-2 Field Sections (NCHRP 01-34D), liquid with dye was injected into holes drilled in the pavement surface at a set distance from the drain outlet, and the length of time required for the dyed water to be detected exiting the drainage outlets was measured. In some cases the dye appeared very quickly, and in others it never appeared at all.65 This information may help explain anomalous findings in pavement performance and drainage effectiveness predictions.
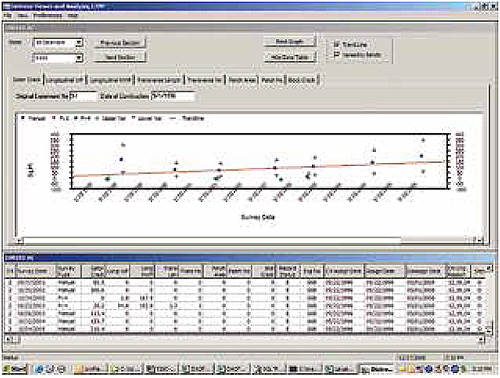 FIGURE 6.14. Screen shot from DiVA software showing a time-series chart of a pavement distress along with the table for all distresses for a test section. |
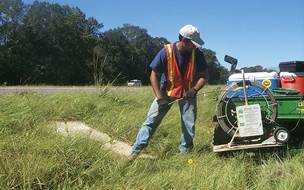 FIGURE 6.15. Edge drain inspection using videography. |
The LTPP database contains the results of friction tests on pavement sections where the State/Provincial highway agency was willing to provide the data. Because friction data hold the potential risk for litigation, submission was made voluntary.
The LTPP data collection guidelines for friction data recommend using the ASTM E-274 (AASHTO T 242) procedure as the preferred method for obtaining data. The ASTM E-274 procedure uses a locked-wheel skid tester in a trailer assembly (figure 6.16). Friction test results are reported as Skid Numbers. It should be noted that although the LTPP program provided guidelines for friction testing, the program has no control over the data collection method, measurement equipment, or calibration of the equipment used for these measurements. In addition, prior to 2014, the LTPP database did not contain surface texture data or related information that are traditionally used to link pavement properties to measured friction levels.
Profile data are collected because pavement smoothness/roughness is perhaps the most important user parameter (i.e., level of service). Profile data and smoothness indices are used to track the performance of the section and provide input to the development of models, especially models that are related to user cost and benefits. Research-quality data require a state-of-the-art profiler to collect ride statistics and longitudinal profiles for long-term comparisons and the' development of future smoothness indices.
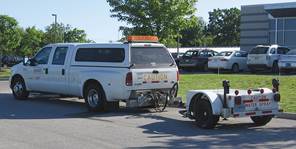 FIGURE 6.16. Locked-wheel skid tester currently in use for collecting friction data. |
Longitudinal profile data are collected almost exclusively by automated profilers, and manual Dipstick® measurements as well as rod and level measurements are sometimes used as a backup. The Dipstick is the backup device in the event an inertial profiler is unable to be scheduled or for remote sections that can not be visited due to distance (e.g., Hawaii and Puerto Rico). The Dipstick is still used for longitudinal profile comparisons because it is an ASTM standard profile measuring device. A list of profile data collection equipment used by the LTPP program over the years is shown in appendix C.
Inertial Profiler and Dipstick Equipment and Verification Tests
Inertial profiling equipment was first purchased in 1989 and was replaced in 1996, 2002, and 2013 as technologies improved and as equipment deteriorated. The profilers, purchased by SHRP and then FHWA, underwent rigorous testing to ensure that they met the requirements specified in the contract documents. After each LTPP regional support contractor took delivery of a replacement profiler, a comparison of the new and old profilers was performed before the new profiler was put into service. These verification tests compared the output from the old and new equipment.
When the first profilers were delivered to the LTPP regional support contractors in 1989 (shown in figure 6.17), some of the regions added video cameras to the equipment to provide backup evidence of pavement condition at the time of survey. The videotaping also helped in determining if maintenance had occurred at the test sections.
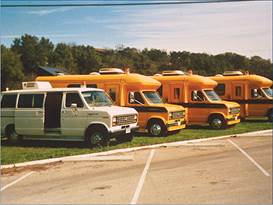 FIGURE 6.17. The first (DNC 690) Profilometers used in the LTPP program. Three were mounted in the Champion motor home chassis with Ford underpinning with dual rear wheels, and the fourth in a Ford E350 van chassis. |
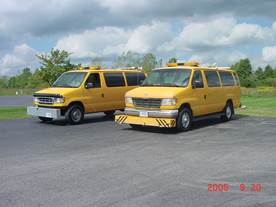 FIGURE 6.18. The T6600 Profilometer, in use from 1996 to 2002. |
 FIGURE 6.19. ICC profiler MDR 4086L3 (Ford E350 van), in use from 2002 to 2013. |
 FIGURE 6.20. Ames profiler in Ford E150 van, acquired in 2013. |
The T6600 Profilometer and the ICC profiler are pictured in figure 6.18 and figure 6.19, respectively. In 2013, through a competitive process, the LTPP program replaced the ICC profilers with state-of-the-art Ames Engineering, Inc. profilers with added capabilities: macrotexture measurements are a new data collection element, and all of the data, including ambient and surface temperature, are referenced with Global Positioning System coordinates (figure 6.20). The new system's software was designed through a collaborative manufacturer/LTPP program process.
As stated earlier, the LTPP program has used the Dipstick over the years in addition to the high-speed profilers to collect profile data. (A manual Dipstick is shown in figure 6.21.) A comparison study of the profiler, the manual Dipstick, and a portable rolling surface profiler manufactured by Face was conducted at the Virginia I-95 LTPP test section (511023) to provide data for use in developing software for the manual collection of longitudinal profile data. The portable rolling profiler was found not to be an ideal tool for the LTPP program's purposes. Safety issues arose with the collection of transverse profiles because it was necessary to roll the profiler past the centerline in the adjacent lane to capture the profile at the centerline.
In 2003, issues were identified with the distance as recorded from the various Dipsticks and the actual length of a section. To compensate for these differences, the LTPP program developed a procedure to determine the 'effective Dipstick footpad spacing' as determined by applying the difference between the foot pad distance and actual distance. The Dipstick survey for the MnROAD profile comparison used the 'effective' spacing and determined that it provided a more accurate distance when collecting Dipstick profiles.66
Comparison studies (sometimes called profile rodeos or rough-offs) are conducted at regular intervals to compare the output from the four LTPP profilers. For each study, several test sections are laid out, and reference profile measurements along each wheelpath are obtained using the Dipstick. Thereafter, profile measurements are performed on the test sections by the inertial profilers. The primary method for checking if the profilers are functioning accurately is to compare the International Roughness Index (IRI) values computed from Dipstick data with the values computed from the data obtained from the profilers. The repeatability of the profilers is evaluated by analyzing the standard deviations of the IRI, which are computed using the IRI values obtained from repeat measurements on a test section. In the profiler comparison studies that have been performed since 1998, in addition to comparing the IRI values, profiles obtained by the profilers are compared to evaluate profiler repeatability and reproducibility. These are just some of the activities that the profile rodeo data analysis covers. The LTPP program has held 10 profiler rodeos in various locations across the country (see sidebar). Some of the rodeos have led to improvements, such as the integration of an updated calibration oscillator into the ICC profiler processor in 2003. Profilers and profile coordinators at the 2007 rodeo are shown in figure 6.22. A summary of the profiler comparisons, Guide to LTPP Profiler Comparison Resource (2010), is available from the LTPP Customer Support Service Center (Email: ltppinfo@dot.gov). In 2013, the program held a training session in College Station, Texas, to accept delivery of the new profilers and teach the profile coordinators how to operate them (figure 6.23). In addition to the rodeos, in 2004, an analysis was undertaken to quantify and resolve the differences in the longitudinal profile and roughness indices that are attributable to the different profilers that have been used in the LTPP program. The analysis indicated good agreement of IRI values among the different inertial profilers.67
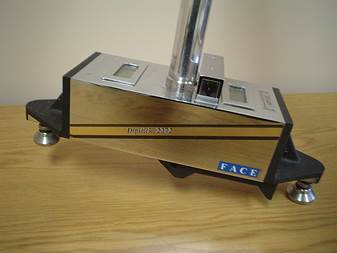 FIGURE 6.21. Manual Face® Dipstick® used to collect profile data in the LTPP program. |
|
LTPP Profiler Rodeos
|
The highway agencies often use FHWA-LTPP profile data as a reference for checking or calibrating their own profilers. Numerous profile comparisons have been performed among the FHWA-LTPP, agency, and contractor' profilers.
Profiler Quality Control Checks
The LTPP program developed ProQual, which is a DOS-based software used to QC profilometer data collected at LTPP test sections. The major features were the ability to check for repeatability between runs (as 5 error-free runs were required) and to generate ride quality indices other than IRI.68 ProQual was later updated to have the ability to identify spikes due to "lost lock" and "saturation" (which was a common problem with the incandescent profile system) and to accept longitudinal and transverse Dipstick data. Issues with the calculation of IRI (related to smoothing) and slope variance (related to sample interval and sharp slopes) were identified and addressed in 1996 (Tech Memo, March 1996). ProQual was further developed to incorporate office QC and calibration routines, and updated with additional features.
 FIGURE 6.22. Profile coordinators with four ICC profilers and the last K. J. Law Profilometer (center), gathered for a rodeo at MnROAD in 2007. |
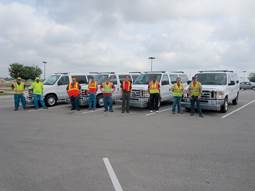 FIGURE 6.23. Profile coordinators gather in College Station, TX, in 2013 to receive training from the LTPP program on the new Ames profiler units. |
A Windows-based version of ProQual with additional features was issued in 2002. In particular, the ability to handle multiple years of data and the refinement of sub-sectioning SPS projects were added.69 ProQual 2002 was updated again in 2005 to add the ability to backup data and files and to address issues identified by the LTPP regional support contractors to further enhance the software.70 ProQual became the basis for FHWA's profile processing software package, ProVAL, which was first released in 2001.71,72 ProXport was developed to create 25-mm data in the new industry-accepted text file format (.erd) developed by the Michigan Transportation Research Institute's Engineering Research Division.73 ProQual 2012 was designed to efficiently and effectively process all data being collected with the latest profilers, Dipstick, and SurPRO; this version introduced the Sidekick' program to process the new macrotexture measurement data elements as well as the new temperature and GPS coordinate data. ProQual 2014 is the latest version of the ProQual software. This version combines all of the previous exterior programs (ProXport, Sidekick) into one robust modern language software package.
Profile Manual
In 1989, the first profile manual, Manual for Profile Measurement: Operational Field Guidelines, was developed and distributed to the LTPP regions for their use in collecting pavement longitudinal and transverse profile data.74 As profile equipment changed and data collection activities improved with technology, the LTPP program updated the manual to reflect these changes in 1994,75 1997,76 1999,77 and 2002.78 Subsequent updates of the manual in 2004,79 2008,80 and 201381,82 carry the title "LTPP Manual for Profile Measurements and Processing." The manual contains procedures for collecting data using automated profiler equipment, the Dipstick, and the rod and level; performing calibration tests and calibrating and maintaining the equipment; recordkeeping; office processing of data collected in the field; and guidelines for performing interregional comparison tests.
While rutting information derived from PASCO's semi-automated transverse profile methods was the primary method at the start of the LTPP program, the backup manual method was initially based on a 4-ft (1.2-m) straightedge (figure 6.24). The straightedge rut-depth method is based on positioning the straightedge at various locations in each half of the lane until the maximum displacement from the bottom of the straightedge to the top of the pavement surface is found. Only the maximum rut depths in the left and right wheelpath are reported from this measurement and stored in the LTPP database.
The 4-ft straightedge method was based on the rut measurement protocol from the American Association of State Highway Officials (AASHO) Road Test. It is important to note that the wheelpath locations at the road test were marked with paint to channelize this early form of accelerated pavement test. In the early implementation tests of the automated transverse profile measurement equipment, it was discovered that on public highways, it was not uncommon for the depressions in the wheelpaths to be wider than 4 ft (1.2 m). This was particularly noticeable on wider lanes. Because the baseline reference of the 4-ft straight edge would sometimes fit inside the wheelpath depression, the resulting rut depth measurement was less than the actual depth.
Although the eventual manual backup method to the semi-automated procedure to measure transverse profile was through the use of a Dipstick, rut data measurements using the 4-ft straightedge method were required for all SPS-3 (preventive maintenance of flexible pavements) test sections. The 4-ft straightedge method was only in use in the LTPP program from 1989 to 1991.
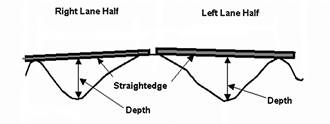 FIGURE 6.24. Measuring rut depth with the 4-ft straightedge. |
In the early stages of the LTPP program, transverse profile was determined from 35-mm picture frames by the string line method/algorithm. A string was stretched over the high spots and the vertical distance measured at the deepest depression in the wheelpaths. This interpretation was performed by PASCO.
Photographic and manual techniques have been used to represent the transverse profile of the test section pavements and to calculate rut depth and cross slope. With photographic techniques, images are obtained using an automated film-based profiler system mounted on the back of the PASCO/CGH survey vehicle, and these images were translated into points of data. With manual techniques, Dipstick measurements must also be translated to be comparable with profiler data. The LTPP regional support contractors are responsible for collecting manual transverse profile data for their regions. The national data collection contractor that took the photographic distress measurements also took the photographic transverse profile measurements. Measurements were typically taken at 15.25-m (50-ft) intervals. The data collected from photographic transverse profiling were used to compute the rutting data found in the LTPP database.83
Automated Transverse Profiling
Initially, the primary method used by the LTPP program to capture distortions in a pavement's transverse profile was photographic, using the ROADRECON-75 equipment manufactured by PASCO. The system used a 35-mm black-and-white optical imagery photographic technique. A pulse camera mounted on the survey vehicle photographs hairline optical bars projected onto the pavement surface (figure 6.25). The camera shutter and hairline projector are synchronized with vehicle speed, allowing the distance between measurement locations to be specified.
The initial analog-to-digital conversion of the transverse surface profile was obtained by projecting the recorded image of the hairline on the pavement onto a digitizing table and tracing its shape using a high precision mouse (figure 6.26). Up to 30 transverse and vertical (X-Y) points in the transverse profile shape were captured. As illustrated in figure 6.27, the elevations in the initial digital profile are then converted to 'normalized' elevations using the geometric relationships between the hairline projector and camera, simple trigonometry relationships, and proprietary calibration factors to account for optical distortions from the camera lens. Due to the limitations of this technology, the shape of the transverse profile from these measurements is normalized so that the beginning and end points of the profile are assigned a zero elevation. Thus while these measurements provide information on many aspects of the characteristics of the distortion in the shape of the transverse profile, they do not provide an indication of the pavement's cross slope.
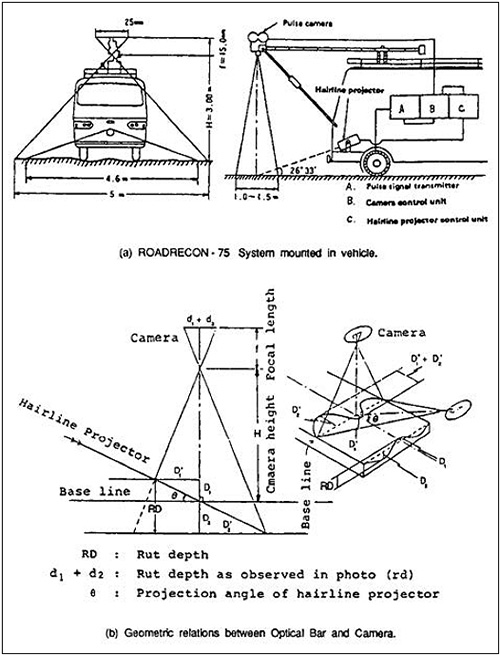 FIGURE 6.25. Diagrams of the PASCO/CGH ROADRECON-75 showing (a) the transverse surface profiler system mounted in a vehicle; and (b) the geometric relations between the system's optical bar and camera. |
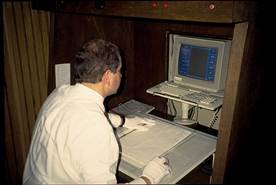 FIGURE 6.26. Translating photographs produced by the automatic profilers into digital format. Transverse profile/rutting was determined from 35-mm picture frames by the string line method/algorithm. Generally 30 points defined the transverse profile. |
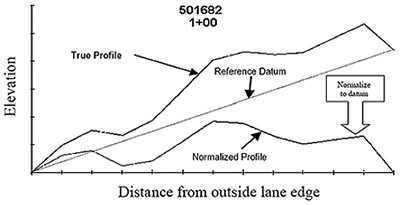 FIGURE 6.27. Normalization of transverse profiler measurements to lane edges. The transverse elevations are adjusted to a reference line through the endpoints so that the elevations of the endpoints are zero. |
Dipstick Becomes Choice for Collecting Transverse Profile and Cross-Slope Information
As noted earlier, simple rut-depth measurements using a 4-ft (1.2-m) straightedge did not sufficiently measure the actual rut depths in all cases or capture all features of interest in the transverse profile. In an early comparison of rut depth indices derived from PASCO and Dipstick measurements on a sample set of test sections, the two devices were found to provide repeatable results within the realm of engineering accuracy.84 Consequently, the Dipstick was adopted by the LTPP program in 1992 as the manually operated measurement device to perform transverse profile measurements because it is an ASTM standard profile measuring device.
Dipstick data were collected in conjunction with manual distress surveys. The Dipstick's principle of operation is that it measures the difference in elevation between its two reference elevation feet located 1 ft (305 mm) apart. For transverse profile measurements, each transverse profile measurement start point is assigned a zero elevation. By adding the cumulative elevation differences between readings this measurement device is capable of recording the elevation difference between the beginning and end points of a transverse pavement surface profile. To conform to the transverse measurement protocol from the PASCO ROADRECON-75 system initially adopted by the LTPP program, all Dipstick transverse profile measurements are stored as normalized elevations in the LTPP database. Three different models of Dipstick have been used during the program, Face' models 1500, 2000, and 2200, as shown in figure 6.28.
Dipstick calibration is performed on a per-site basis, using the zero check (to ensure meter's elevation reading is the same when rotated 180') and the calibration block check (if elevation reading is zero, the result from this check should be 3.2 mm or very close to the height of the block) before and after each site visit. The calibration procedures followed are detailed in an LTPP program directive,85 the Distress Identification Manual,86 and Profile Manual.87
Dipstick data are entered to update the transverse profile database using the ProQual software. Header information and graphical displays of the forward and backward passes and of the normalized elevations can be reviewed. Output files of the normalized elevations (rounded to the nearest millimeter) and cross slope are stored in the LTPP database.
In 2003, the LTPP program decided to capture the pavement cross-slope information contained in the Dipstick manual transverse profile measurements by reinterpreting the raw data from previous measurements and performing one round of manual transverse profile measurements using the Dipstick on PCC-surfaced pavements. The objective was to extract the cross-slope information contained in the raw dipstick measurements to enable translations of the normalized profiles into actual transverse pavement profiles. The motivation for this action was to provide an analytical basis on the potential of ruts to hold water within the cross-elevation profile and to provide cross-slope data for other analysis objectives. The first release of the cross-slope data was in 2004. In 2012, another round of transverse profile measurements was begun on active PCC test sections.
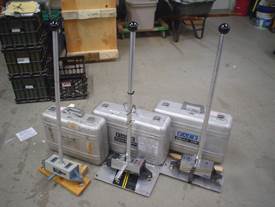 FIGURE 6.28. Three Face® Dipstick® profile measuring devices with carrying cases. Left to right are the 1500, 2000, and 2200 models. |
PCC Transverse Profiles
In the early years of the program, transverse profile measurements were performed on both AC- and PCC-surfaced test sections using the PASCO automated measurement device. In more recent years, transverse profile images on PCC-surfaced test sections have not been interpreted due to program budget cuts. A little-known fact is that the LTPP program has collected data which show that PCC pavements also exhibit depressions in the wheelpath. The LTPP database contains information on distortion in the transverse profile of PCC-surfaced pavements that is not available elsewhere.
Temperature and moisture-related changes in pavement structures, both within a day, from season-to-season, over the course of a year, and from year-to-year, can have significant impact on the structural characteristics of pavement layers, thus affecting the pavement's response to traffic loads and, ultimately, its useful life. To attain a fundamental understanding of the magnitude and impact of temporal (daily, seasonal, and annual) variations in pavement response and material properties due to the separate and combined effects of temperature and moisture variations, SHRP envisioned the SMP. The study concept received strong support from the LTPP stakeholder community and was also endorsed by the Transportation Research Board (TRB) LTPP Pavement Performance Advisory Committee.
Because the SMP was not part of the original LTPP program plan and has involved a large investment of resources, its development and implementation under FHWA are discussed in chapter 7. The chapter describes the scope, equipment, data collection procedures, data collected (onsite air temperature and precipitation data, subsurface temperature and moisture content data, and frost-related measurements), and monitoring frequency.
SPS experiments that were newly constructed (SPS-1, -2, -8, and some -9) made it possible for the LTPP program to collect the construction and materials data for these test sites. Therefore, a separate data module was created in the LTPP database specifically for the SPS experiments to store what is essentially inventory data.
Because the constructed SPS test sections were built to meet specific requirements, data associated with the construction of each project were recorded for the purpose of evaluating the performance of each test section within the project. After each SPS project was completed, a report was prepared by the LTPP regional support contractor with information collected during the different stages of construction. Many of the construction reports included details of meetings that took place in preparation for the construction of the SPS sections as well as sampling and testing performed before, during, and after the new pavement layers were constructed. Any data collected and pertinent drawings were included in the reports, which are available on the LTPP InfoPave Web site. The reports' appendices included a correspondence section, any materials or QC data provided by the agency or the contractor on site, photos of the different equipment and activities performed during construction, and a summary explaining any deviation from the experiment guidelines that was documented during the different stages of construction.
In addition to the data collected on site by the LTPP regional support contractor, the highway agency had the responsibility of submitting information about the SPS experiments: for example, inventory forms for overlay SPS experiments, construction sheets from all SPS experiments, and information about the asphalt or concrete plant and other equipment and procedures used during construction. The submitted inventory and construction data were not always complete. In some cases, the LTPP regional support contractors, through agency visits and archive searches, retrieved further information, but some SPS construction data are still missing and are likely to remain missing despite many attempts to collect these data.
Since the beginning of the LTPP program, highway agencies have committed to provide traffic loading (weight), classification, and volume data for each LTPP test site. The LTPP database contains historical and monitored traffic data, which are discussed in the following sections. A special traffic data collection effort, initiated by FHWA under a pooled-fund study that was supported by the State/Provincial partners, is discussed in chapter 7.
"Historical data" is defined as data collected during a period beginning at the initial opening of the pavement to traffic (or the most recent overlay or rehabilitation project) and extending through 1989 and applies only to GPS test sections. The purpose of collecting historical traffic data was to determine the best estimate of annual traffic levels at each test section before LTPP performance monitoring began at the pavement section. "Monitored data" is defined as data collected at the initiation of LTPP performance monitoring of the pavement test section to date.
Historical traffic data on sections in service before and after the start of LTPP monitoring in 1990, were provided by the highway agency. There were occasions when the traffic characteristics of a site were either not known or questionable, and this required effort from the LTPP program and the highway agency, working together, to obtain this information. Figure 6.29 shows an LTPP traffic data sheet that the highway agencies use to submit historical traffic data.
Monitored traffic data are usually collected separately for each lane being monitored. For the LTPP program, data collection was planned only for the outside lane (test lane) in one direction. Earlier in the program, the highway agencies were encouraged to provide traffic data from all lanes to populate the average annual daily traffic (AADT) tables. Monitored traffic data are submitted on a monthly, quarterly, or annual basis depending on the practices of the individual agencies.
Traffic data include distribution of traffic by vehicle classes, days of data collected, and distribution of axle loads for single, tandem, tridem, and quad axles by vehicle class. For locations where traffic data have been submitted for all lanes, the data could include AADT and percent trucks. Beginning in 1990, data have been submitted in one of the electronic record formats documented in FHWA's Traffic Monitoring Guide, second through fifth editions, issued in 1992, 1995, 2001, and 2013.88
Highway agencies submit traffic information on individual data reporting forms, 16 in all, which provide historical and estimated volume and load data for the test site. The LTPP regional support contractor is responsible for tracking the data transmittal sheets, soliciting them from agencies when required, checking them for reasonableness, and entering them into the LTPP database.
Although every effort has been made by both the highway agencies and the LTPP program, there are still gaps in the traffic data. Collecting traffic data at the LTPP test sections has not been as straightforward as collecting the other data described in this chapter. Many challenges existed, such as different types of traffic data collection equipment used by different highway agencies and the lack of equipment calibration. These are just two of the challenges which the LTPP program sought to remedy in the early to mid 2000s. One approach was to collect at least 1 week of continuous classification data at those sites where no traffic data existed in the LTPP database (internal memorandum, 'Minimum Standards for Traffic Monitoring Data Collection on LTPP Sites,' January 21, 2009). The other approach required partnering with as many agencies as possible because it involved substantial funding and personnel resources to successfully carry out. This particular effort, better known as the LTPP SPS Traffic Data Collection Pooled-Fund Study, TPF-5(004), is covered in more detail in chapter 7.
 FIGURE 6.29. A sample data transmittal form used by the highway agency to submit historical traffic data to the LTPP regional support contractor. |
Equipment used to collect traffic data by the highway agencies varied from different kinds of piezoelectric cables to bending plates to load cells. In the design of the LTPP program, the expectation was that all sites would be instrumented with reliable, low-cost ($5,000) weigh-in-motion (WIM) scales. However, the original estimated cost and assumed reliability of equipment were not realistic. Therefore expectations for traffic data collection were redefined, and were described using three levels of effort:89
Data collection was to occur near the test section wherever possible. Where the pavement section under study and the traffic monitoring equipment were not co-located, which was true for nearly 15 percent of the pavement test sections, highway agencies were asked to provide measured data to determine the differences in traffic between the two locations. This information was not provided, however, by every highway agency.
Several years into the program it became clear that many agencies did not have the resources to meet even the minimum option at most locations. For sites for which monitored traffic data are not being collected, highway agencies are asked to provide the LTPP program with estimates of the traffic at the site using the traffic data sheet shown in figure 6.30.
Two new LTPP protocols, detailing the guidelines and procedures for traffic data collection and calibration of data collection equipment, were issued in April 1998.90,91 The equipment calibration protocol was issued because of significant anecdotal information that equipment was being installed without calibration or subsequent validation.
Because high-quality traffic data collection requires verification of what is being collected, suggested practices were developed for agency use. After further minor revisions, in April 2000, the LTPP program implemented the Guide to LTPP Traffic Data Collection and Processing.92 Updated in 2001,93 and 2009,94 the guide contains all sheets required to be submitted with historical, calibration, and electronic traffic data submissions.
The LTPP program encouraged the highway agencies to check and calibrate, if necessary, their equipment every time it was used to collect data for the LTPP program. In addition, permanent WIM scales are expected to have their calibration settings field validated (and updated as necessary) at least twice a year, and data were to be monitored on a monthly basis to ensure that the scales remain calibrated. This calibration check was to include both the weight and vehicle classification data produced by the equipment. It was recommended that data collected from an improperly functioning WIM device not be sent to the LTPP program for inclusion in the database. However, it was apparent to the LTPP program that some data were sent for uncalibrated traffic data collection equipment.
By the late 1990s, it had become clear that the spatial distribution, timeliness, quantity, and quality of the traffic monitoring data needed to be improved. Issues included non-uniform data collection equipment between highway agencies, infrequent or no calibration of the equipment, and insufficient checking of collected data. These deficiencies in the data motivated the LTPP program to develop a plan to collect traffic data of the quality that would be needed for future data analysis studies. This data collection effort was managed by the program from 2001 to 2014 and is covered in more detail in chapter 7.
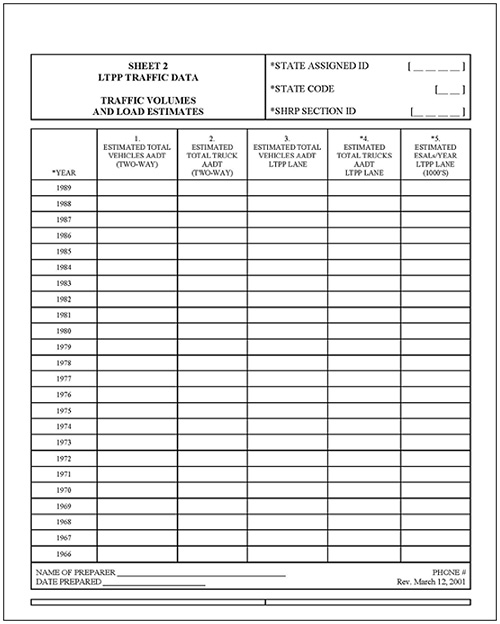 FIGURE 6.30. A sample data transmittal form used by the highway agency to submit traffic estimates to the LTPP regional support contractor. |
Data collection is the primary activity in the LTPP program, which supplies the information from which all productive activities follow–data analysis, product development, and standards. The challenge'to capture research-quality data of diverse types using highly specialized, state-of-the-art equipment with the involvement of many different people spread across North America–is great. Documentation of the processes used has been essential, and as the LTPP program advanced, data collection guidelines, QC procedures, and equipment specifications have been created of necessity to assure the integrity of the data. These program documents have become models for other data collection efforts and have led in several cases to national industry standards. The program has kept pace with advances in technology by investing in improved data collection equipment and software, and has undertaken major efforts over the years to assure that the LTPP data are of sufficient quality and quantity to support pavement performance research. These efforts are discussed in the next chapter.