U.S. Department of Transportation
Federal Highway Administration
1200 New Jersey Avenue, SE
Washington, DC 20590
202-366-4000
Federal Highway Administration Research and Technology
Coordinating, Developing, and Delivering Highway Transportation Innovations
| REPORT |
| This report is an archived publication and may contain dated technical, contact, and link information |
|
| Publication Number: FHWA-HRT-13-066 Date: August 2013 |
Publication Number: FHWA-HRT-13-066 Date: August 2013 |
The combined series of tests performed in Defiance County and at TFHRC make up a parametric study where the following parameters were investigated: (1) aggregate type, (2) compaction, (3) gradation, (4) bearing bed reinforcement, (5) reinforcement strength, (6) similar ratios of reinforcement strength to spacing, (Tf/Sv), and (7) facing.
The aggregate selected has a large impact on the performance and composite behavior of GRS; both the size (i.e., dmax) and the strength (i.e., c,Φ) of the backfill selected are important. In PTs, it is very difficult to isolate one backfill variable over another to determine the individual contributions to GRS performance. Instead, general conclusions based on aggregate classification and angularity can be drawn using PT results; however, advanced computer modeling is a potential avenue to better understand the component contributions of particular fill materials.
The majority of GRS– Integrated bridge systems (IBSs) built across the country use an open-graded aggregate for the abutment backfill. Commonly, an AASHTO No. 89 has been employed; an early performance test performed in Defiance County shows the behavior of a GRS composite with this backfill and 4,800 lb/ft reinforcement spaced at 7⅝ inches.(1) To create a database of PT results with alternate aggregate types, while providing an opportunity to demonstrate the construction of a PT to FHWA Division Offices, Federal Lands Highway Division, and the Resource Center through the EDC GRS-IBS Validation Sessions, a series of tests were conducted in this study (table 9). Note that since these PTs were conducted as demonstration piers, the level of compaction control on each lift was not consistent or uniform.
Table 9. Parametric study on aggregate size.
Test |
Backfill |
Reinforcement |
Facing |
||||
|---|---|---|---|---|---|---|---|
Type |
Φ |
c |
dmax |
Tf |
Sv |
||
DC-1 |
8 |
54 |
0 |
½ |
4,800 |
7⅝** |
CMU |
DC-2 |
8P* |
46 |
0 |
¾ |
4,800 |
7⅝** |
CMU |
DC-3 |
57 |
52 |
0 |
1 |
4,800 |
7⅝** |
CMU |
DC-4 |
9 |
49 |
0 |
⅜ |
4,800 |
7⅝** |
CMU |
Φ = the peak friction angle, c = the cohesion, Tf = the MARV value of the wide width tensile strength, and Sv = the spacing.
*Rounded pea-gravel angularity.
**Two courses of bearing bed reinforcement placed at the top of the PT.
Based on the results (table 10), no relationship can be determined with respect to the strength limit for open-graded aggregates since there are only two PTs conducted to failure of the GRS composite. The largest aggregate tested, the No. 57 stone, had the lowest service limit of all the tests, indicating more deformation under an applied load. In addition, the rounded pea gravel had a lower strength and service limit than the more angular aggregate meeting the same gradation specifications for an AASHTO No. 8 material.
Table 10. Effect of aggregate type results.
|
Maximum Tested |
Strength Limit |
Design Limit |
Service Limit |
||
|---|---|---|---|---|---|---|
Test |
qmax |
ε max(%) |
qult,emp |
q@ε≤ 5% |
Vallow = |
q@ε≤5% |
DC-1 |
23,310 |
7.95 |
23,310 |
19,983 |
5,709 |
3,065 |
DC-2 |
22,709 |
7.07 |
22,709 |
19,399 |
5,543 |
2,171 |
DC-3 |
18,447 |
5.82 |
N/A |
16,182 |
4,623 |
1,324 |
DC-4 |
26,730 |
7.64 |
N/A |
17,350 |
4,957 |
2,212 |
qmax = the maximum applied pressure during testing,εmax the maximum recorded vertical strain, qult,emp = the measured failure pressure,q@ε≤5% = the applied stress at 5-percent vertical strain, Vallow,emp = the total allowable pressure on the GRS,(1)q@ε≤5% = the applied stress at 0.5-percent vertical strain.
The effect of compaction for open-graded materials was investigated through two PTs conducted in Defiance County, OH (table 11). The testing conditions were identical except for the compaction effort. DC-1 was compacted to non-movement while DC-5 involved no compaction effort beyond end dumping the material and leveling for each lift of fill. The results show a similar vertical capacity (23,310 psf versus 21,539 psf for DC-1 and DC-5, respectively); however, the higher strength for DC-1 is likely due to the increased locked-in stresses induced due to compaction. Note that the friction angle of both composites is reported as the same; however, the degree of compaction may have a small impact for open-graded aggregates (larger for well-graded backfills). This effect is currently being investigated.
While the capacity of the specimens was similar, the deformation response was different (figure 57). As expected, Test DC-5 had a softer response resulting from not being compacted. The modulus of the primary settlement portion of the curve for the uncompacted composite (DC-5) is about 270 ksf while the modulus for the compacted composite (DC-1) is 430 ksf (table 11).
Table 11. Parametric study on compaction.
Test |
Backfill |
Reinforcement |
Facing |
E° |
qult,emp (psf) |
|||
|---|---|---|---|---|---|---|---|---|
Type |
Φ |
c |
Tf |
Sv |
||||
DC-1 |
8 |
54 |
0 |
4,800 |
7⅝** |
CMU |
430 |
23,310 |
DC-5 |
8*** |
54 |
0 |
4,800 |
7⅝** |
CMU |
270 |
21,539 |
Φ = the peak friction angle, c = the cohesion, Tf = the MARV value of the wide width tensile strength, Sv = the spacing, Eo = the initial stress-strain ratio, and qult,emp = the measured vertical capacity.
**Two courses of bearing bed reinforcement placed at the top of the PT.
***Uncompacted sample.
At the service limit state of 0.5 percent vertical strain, the allowable stress is limited to 316 psf for the uncompacted GRS composite, but 3,065 psf for the same composite compacted to non-movement (table 8); however, if negating the initial immediate settlement resulting from the first load increment, before the onset of primary deformation of the uncompacted sample, the allowable stress is about 1,345 psf (figure 58).
The ratio of strain for the uncompacted (DC-5) and compacted (DC-1) GRS composite (εv,uncompact /ε v,compact), accounting for the immediate deformation related to the uncompacted composite (DC-5), decreases with increasing applied pressure (figure 59). For the particular GRS composite tested (table 11, figure 58), at an in-service dead load of 4,000 psf, an uncompacted abutment will experience about 3 times the strain as a compacted abutment; however, near failure, at about 20,000 psf, an uncompacted abutment will experience about 1.7 times the strain as a compacted abutment. Note that in the evaluation of tolerable settlements for highway bridge design, FHWA recommends the construction-point concept, whereby the settlements between critical construction points (such as between application of dead load and opening to traffic) are evaluated.(29)
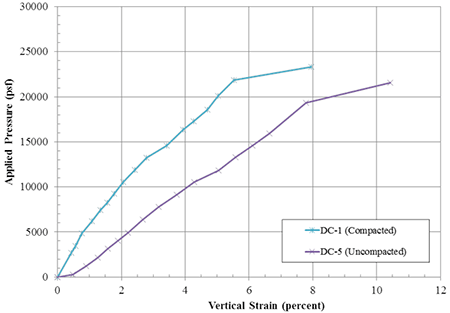
Figure 57. Graph. Comparison between compacted and uncompacted GRS composites.
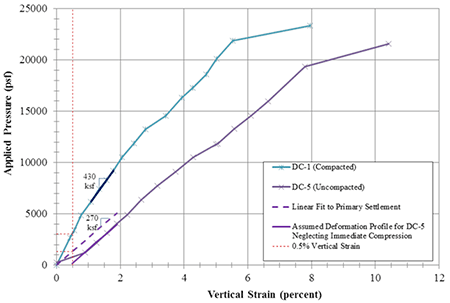
Figure 58. Design service limit for uncompacted sample DC-5.
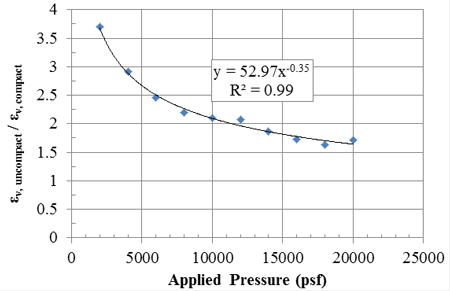
Figure 59. Graph. Comparison of compacted and uncompacted strains between the DC-1 and DC-5 tests.
Bearing bed reinforcement, where the reinforcement is spaced at half the primary spacing, is recommended in at least the top five courses of CMU facing elements for GRS abutments to aid in serviceability.(1) To investigate the impact of the bearing bed, two PTs were conducted with identical parameters, except one (TF-8) had two courses of bearing bed reinforcement, as recommended in the empirical design procedure using performance testing by Adams et al. 2011a (table 12); the other (TF-7) had no bearing bed reinforcement(1) The axial behavior results indicate that the bearing bed provides some added vertical capacity; however, vertical deformation is not improved at low strain levels (figure 60). The modulus for primary compression is similar whether or not the bearing bed is present (table 12).
Table 12. Parametric study on bearing bed reinforcement.
Test No. |
Backfill |
Reinforcement |
Facing |
Eo |
qult,emp |
||||
|---|---|---|---|---|---|---|---|---|---|
Type |
Φ |
c |
dmax |
Tf |
Sv |
||||
TF-7 |
21A |
53 |
115 |
1 |
4,800 |
7⅝ |
no CMU |
320 |
26,546 |
TF-8 |
21A |
53 |
115 |
1 |
4,800 |
7⅝** |
no CMU |
320 |
29,134 |
Φ = the peak friction angle, c = the cohesion, Tf = the MARV value of the wide width tensile strength, Sv = the spacing, Eo = the initial stress-strain ratio, and qult,emp = the measured vertical capacity.
**Two courses of bearing bed reinforcement placed at the top of the PT.
Looking at the lateral deformation characteristics for both tests at an applied stress of about 3,600 psf, typical of bridge loads (figure 61), the bearing bed reinforcement serves to limit deformation in the zone of its placement. The approximate location of the bearing bed reinforcement is illustrated with red dashed lines in figure 61. At considerably higher loads, around 26,600 psf, the same effect is observed (figure 62). Note that the LVDT located at the bottom of the PT for the TF-7 test was damaged during testing due to sloughing of the fill material so no values were recorded in the later stages of the test; the full lateral displacement curves for all of the PTs will be presented in a separate report.
At service loads, when bearing bed reinforcement is present (TF-8), the maximum lateral deformation is lower and occurs at about mid-height (38 ⅛ inches from the top) whereas when bearing bed reinforcement is excluded (TF-7), the maximum lateral deformation occurs near the top (7⅝ inches from the top). The lateral deformation at 7⅝ inches below the top of the GRS PT is 0.16 inches for TF-7 (no bearing bed) and 0.07 inches for TF-8 (with bearing bed reinforcement); the bearing bed reduced the lateral deformation by about half at 3,600 psf applied vertical pressure. At larger loads, the difference in the measured lateral deformation between including a bearing bed and not diminishes considerably at the top of wall. Note that since the results are based on only two PTs, additional testing is required to verify the conclusions for different aggregate and reinforcement materials and to investigate the depth of influence for the bearing bed.
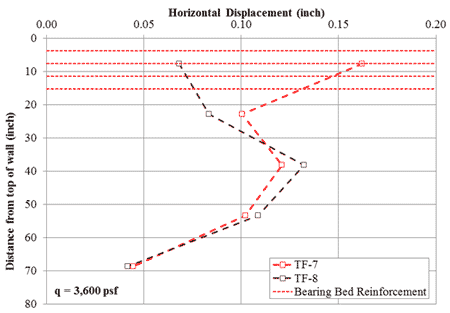
Figure 61. Graph. Measured lateral deformation at 3,600 psf applied stress for TF-7 (no bearing bed reinforcement) and TF-8 (2 courses of bearing bed reinforcement).
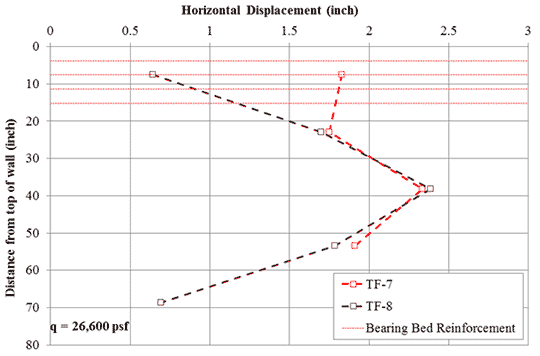
Figure 62. Graph. Measured lateral deformation at 26,600 psf applied stress for TF-7 (no bearing bed reinforcement) and TF-8 (2 courses of bearing bed reinforcement).
For the GRS-IBS, both open-graded and well-graded materials that meet the specifications in the Interim Implementation Guide are acceptable for use in the GRS abutment; however, there are advantages and disadvantages of both.(1) Open-graded materials are free draining, easier to work with, and their use in construction is independent of weather conditions; however, they are less stiff than well-graded materials, which can achieve greater density under the same compactive effort. In addition, the classical bell-shaped Proctor curves cannot be attained with open-graded materials. The primary disadvantage of working with well-graded fill is compaction control and maintaining the optimum moisture content for efficient compaction.
PTs TF-1 and TF-2 are identical except for the backfill material type; TF-1 used an open-graded AASHTO No. 8 while TF-2 used a well-graded AASHTO A-1-a backfill (table 13). The friction angle for both tests were similar (55° versus 53° for TF-1 and TF-2, respectively), but the well-graded material (TF-2) had cohesion of 115 psf. The corresponding soil shear strengths at a given applied stress (figure 40) are therefore only 5 percent different, with TF-2 having slightly higher shear strength.
Table 13. Parametric study on gradation (Tf = 2,400 lb/ft, Sv = 7⅝ inches).
Test |
Backfill |
Reinforcement |
Facing |
Eo |
qult,emp |
||||
Type |
Φ |
c |
dmax |
Tf |
Sv |
||||
TF-1++ |
8 |
55 |
0 |
½ |
2,400 |
7⅝ |
CMU |
320 |
20,487 |
TF-2 |
21A |
53 |
115 |
1 |
2,400 |
7⅝ |
CMU |
710 |
25,260 |
Φ = the peak friction angle, c = the cohesion, Tf = the MARV value of the wide width tensile strength, Sv = the spacing, Eo = the initial stress-strain ratio, and qult,emp = the measured vertical capacity.
++Technical difficulties resulted in unloading/reloading of the composite.
The resulting load-deformation profiles are shown in figure 63. The well-graded material is considerably stiffer than the open-graded material. At an applied pressure of 4,000 psf, the vertical strain is about 1.1 percent for TF-1 (open-graded) and 0.4 percent for TF-2 (well-graded). The modulus of the composite tested in TF-1 is 320 ksf (table 13) compared to 710 ksf for the composite tested in TF-2; TF-1 (open-graded) is 55 percent less stiff than TF-2 (well-graded). In terms of bearing capacity, TF-1 was 20 percent less strong than TF-2. The results indicate that the gradation, and perhaps cohesion, impacts the stiffness more so than strength, indicating that well-graded fills have an advantage with respect to serviceability. As previously discussed in section 6.1, isolating the effect of cohesion on the performance is difficult using PTs, although based on the soil-geosynthetic capacity equation (figure 8), it will serve to improve capacity, although its contribution should not be considered in design.
Comparing DC-1 and TF-6 also provides similar insight into the modulus difference between open-graded and well-graded composites, respectively (table 14). Note that DC-1 included two courses of bearing bed reinforcement; however, it was previously shown that the bearing bed reinforcement does not impact the modulus at low strain levels, but the capacity is slightly improved with the two additional layers of reinforcement at the top. The modulus of the composite with open-graded backfill (DC-1) was 430 ksf, whereas the modulus of the composite with well-graded backfill (TF-6) was 750 ksf. Both are slightly larger than the measured modulus of similar composites with lower reinforcement strengths (table 13)
.Table 14. Parametric study on gradation (Tf = 4,800 lb/ft, Sv = 7⅝ inches.)
Test No. |
Backfill |
Reinforcement |
Facing |
Eo |
qult,emp |
||||
|---|---|---|---|---|---|---|---|---|---|
Type |
Φ |
c |
dmax |
Tf |
Sv |
||||
DC-1 |
8 |
54 |
0 |
½ |
4,800 |
7⅝** |
CMU |
430 |
23,310 |
TF-6++ |
21A |
53 |
115 |
1 |
4,800 |
7⅝ |
CMU |
750 |
43,763 |
Φ = the peak friction angle, c = the cohesion, Tf = the MARV value of the wide width tensile strength, Sv = the spacing, Eo = the initial stress-strain ratio, and qult,emp = the measured vertical capacity.
**Two courses of bearing bed reinforcement placed at the top of the PT.
++Technical difficulties resulted in unloading/reloading of the composite.
The impact of reinforcement strength on the behavior of a GRS composite was investigated for both open-graded (table 15) and well-graded aggregates (table 16).
Table 15. Parametric study on reinforcement strength with open-graded aggregates.
Test |
Backfill |
Reinforcement |
Facing |
Eo |
qult,emp |
||||
|---|---|---|---|---|---|---|---|---|---|
Type |
|
C |
dmax |
Tf |
Sv |
||||
DC-1 |
8 |
54 |
0 |
½ |
4,800 |
7⅝** |
CMU |
430 |
23,310 |
TF-1++ |
8 |
55 |
0 |
½ |
2,400 |
7⅝ |
CMU |
320 |
20,487 |
Φ= the peak friction angle, c = the cohesion, Tf = the MARV value of the wide width tensile strength, Sv = the spacing, Eo = the initial stress-strain ratio, and qult,emp = the measured vertical capacity.
**Two courses of bearing bed reinforcement placed at the top of the PT.
++ Technical difficulties resulted in unloading/reloading of the composite.
Table 16 . Parametric study on reinforcement strength with well-graded aggregates.
Test |
Backfill |
Reinforcement |
Facing |
Eo |
qult,emp |
||||
|---|---|---|---|---|---|---|---|---|---|
Type |
Φ |
C |
dmax |
Tf |
Sv |
||||
TF-2 |
21A |
53 |
115 |
1 |
2,400 |
7⅝ |
CMU |
710 |
25,260 |
TF-6++ |
21A |
53 |
115 |
1 |
4,800 |
7⅝ |
CMU |
750 |
43,763 |
Φ= the peak friction angle, c = the cohesion, Tf = the MARV value of the wide width tensile strength, Sv = the spacing, Eo= the initial stress-strain ratio, and qult,emp = the measured vertical capacity.
++Technical difficulties resulted in unloading/reloading of the composite.
DC-1 and TF-1 both tested similar open-graded aggregates (AASTHO No. 8s) at the same reinforcement spacing of 7⅝ inches, but DC-1 used a 4,800 lb/ft geotextile while TF-1 used a 2,400 lb/ft geotextile (table 15). The response indicates that the higher reinforcement strength (4,800 lb/ft) produces a stiffer and stronger response than the lower reinforcement strength (2,400 lb/ft) for open-graded backfill. By doubling the reinforcement strength, the results indicate an increase by a factor of 1.14 for capacity and 1.34 for the initial stress-strain ratio.
Comparing the effect of reinforcement strength with a well-graded AASHTO A-1-a aggregate, with and without facing, it was found that increasing the ultimate reinforcement strength (MARV) by a factor of two from 2,400 lb/ft (TF-2) to 4,800 lb/ft (TF-6) at the same reinforcement spacing (Sv = 7⅝ inches) results in an increase in the measured capacity and initial stress-strain ratio by a factor of 1.73 and 1.06, respectively for CMU facing (table 16). When no facing is present, the same increase in reinforcement strength from 2,400 lb/ft (TF-3) to 4,800 lb/ft (TF-7) at a spacing of 7⅝ inches results in an increase in the measured capacity by a factor of 1.5. For open-graded aggregates, the percent increase in capacity is less than for the well-graded material tested which may be due to the increased cohesion and maximum density of the well-graded material, thus leading to higher soil shear strengths and increased stiffness properties.
The current AASHTO LRFD Bridge Design Specifications (2012) do not distinguish between MSE technology and closely-spaced GRS technology.(30) In AASHTO (2012), reinforcement spacing is linearly proportional to the reinforcement strength, leading engineers to prefer larger spaced systems with proportionally greater reinforcement strengths.(10) Research on closely spaced systems, however, indicates that reinforcement spacing plays a significantly larger role than the reinforcement strength.(5,11 ,25 ,31)
To investigate the relationship between the MARV wide width reinforcement tensile strength (Tf) and spacing (Sv), several PTs were designed to keep the same Tf /Sv ratios, both with (table 17) and without facing elements (table 18). The strength of the reinforcement was assumed to be the manufacturer supplied MARV (table 6). Within the data set of this study, there are three pairs of tests (with and without facing) at a constant Tf /Sv ratio (table 19). For a Tf /Sv ratio of 3,800 lb/ft2, the load-test curves for the tests with facing are presented in figure 64 and the load-test curves for the tests without facing are presented in figure 65.
Table 17. Parametric study for 3,800 lb/ft2 Tf/Sv ratio (with facing).
Test |
Backfill |
Reinforcement |
Facing |
Eo (ksf) |
qult,emp |
||||
|---|---|---|---|---|---|---|---|---|---|
Type |
Φ |
c |
dmax |
Tf |
Sv |
||||
TF-2 |
21A |
53 |
115 |
1 |
2,400 |
7⅝ |
CMU |
710 |
25,260 |
TF-9 |
21A |
53 |
115 |
1 |
4,800 |
15¼ |
CMU |
550 |
22,310 |
TF-14 |
21A |
53 |
115 |
1 |
3,600 |
11¼ |
CMU |
460 |
23,562 |
Φ = the peak friction angle, c = the cohesion, Tf = the MARV value of the wide width tensile strength, Sv = the spacing, Eo = the initial stress-strain ratio, and qult,emp = the measured vertical capacity.
Table 18. Parametric study for 3,800 lb/ft2 Tf/Sv ratio (with no facing).
Test |
Backfill |
Reinforcement |
Facing |
Eo (ksf) |
qult,emp |
||||
Type |
Φ |
c |
dmax |
Tf |
Sv |
||||
TF-3 |
21A |
53 |
115 |
1 |
2,400 |
7⅝ |
no CMU |
330 |
17,491 |
TF-10 |
21A |
53 |
115 |
1 |
4,800 |
15¼ |
no CMU |
260 |
10,330 |
TF-13 |
21A |
53 |
115 |
1 |
3,600 |
11¼ |
no CMU |
260 |
12,960 |
Φ = the peak friction angle, c = the cohesion, Tf = the MARV value of the wide width tensile strength, Sv = the spacing, Eo = the initial stress-strain ratio, and qult,emp = the measured vertical capacity.
Table 19. Tf/Sv ratios for each PT.
No. |
Tf/Sv |
|||||
3,800 lb/ft2 |
4,400 lb/ft2 |
7,600 lb/ft2 |
||||
CMU Facing |
No Facing |
CMU Facing |
No Facing |
CMU Facing |
No Facing |
|
1 |
TF-2 |
TF-3 |
TF-12 |
TF-11 |
TF-6 |
TF-7 |
2 |
TF-9 |
TF-10 |
|
|
TF-8 |
|
3 |
TF-14 |
TF-13 |
|
|
DC-1 |
|
4 |
TF-1 |
|
|
|
DC-2 |
|
5 |
|
|
|
|
DC-3 |
|
6 |
|
|
|
|
DC-4 |
|
7 |
|
|
|
|
DC-5 |
|
Note: The table shows which sets of tests were performed at a particular Tf/Sv ratio, thus some cells are blank.
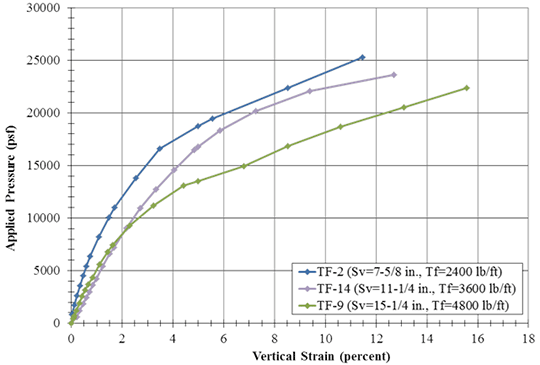
Figure 64. Graph. Stress-strain curves for PTs with CMUs at Tf/Sv = 3,800 psf
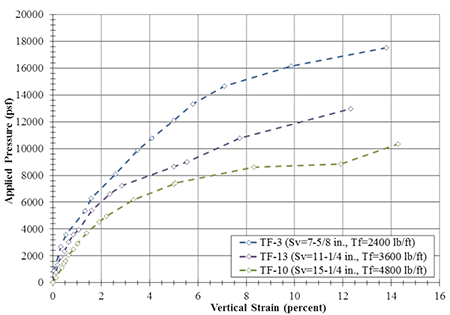
Figure 65. Graph. Stress-strain curves for PTs with no CMU facing at Tf/Sv = 3,800 psf
For a Tf/Sv ratio of 3,800 lb/ft2, as the reinforcement spacing increased, the vertical capacity decreased for the same Tf/Sv ratio, whether a CMU facing was absent (figure 66) or present (figure 67). Contrary to MSE design theory, as reinforcement strength increased, while increasing the spacing proportionally, the vertical capacity decreased, whether a CMU facing was absent (figure 68) or present (figure 69).
This suggests that the relationship between reinforcement strength and spacing is not proportional to capacity as outlined in current MSE design; a GRS abutment with a given Tf and Sv will not have the same strength figure as a GRS abutment with twice the strength (2Tf) and reinforcement spacing (2Sv).
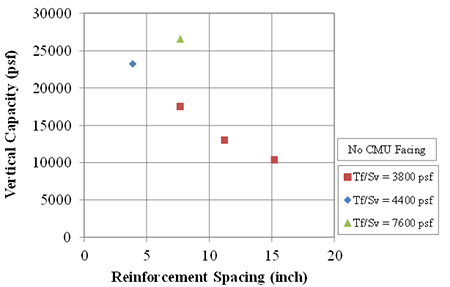
Figure 66. Graph. Capacity of GRS with no CMU facing at various reinforcement spacing for different Tf/Sv ratios.
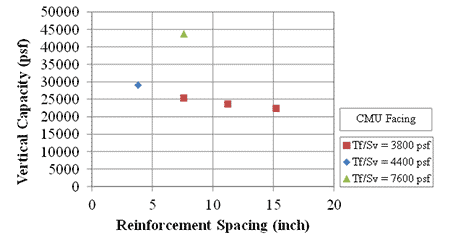
Figure 67. Graph. Capacity of GRS with CMU facing at various reinforcement spacing for different Tf/Sv ratios.
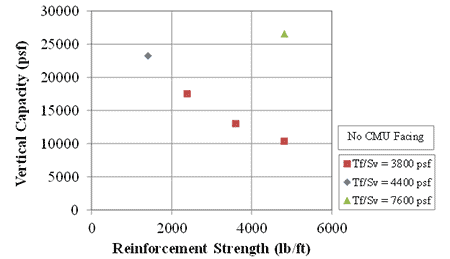
Figure 68. Graph. Capacity of GRS with no CMU facing at various reinforcement strength for different Tf/Sv ratios.
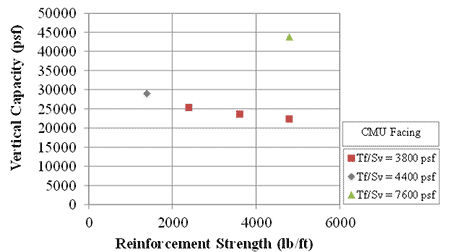
Figure 69. Graph. Capacity of GRS with CMU facing at various reinforcement strength for different Tf/Sv ratios.
At the same Tf/Sv ratio of 3,800 lb/ft2, increasing the reinforcement spacing and reinforcement strength by a factor of two from 7⅝ to 15¼ inches and 2,400 to 4,800 lb/ft, respectively, resulted in a reduction of the capacity by a factor of 0.9 and 0.6 for CMU facing and no facing, respectively. According to the design theory employed by AASHTO (2012), there would be no reduction in capacity.(10) The relationship between reinforcement strength and spacing is therefore not directly proportional. The results are similar to those reported by Pham (2009).(25)
In the GRS-IBS Interim Implementation Guide, the effect of the facing is ignored in determining the capacity of a GRS composite (i.e., confining stress is equal to zero in figure 8).(1) The PTs provide insight on the magnitude of the impact CMU facing elements have on the performance of GRS composites. Of the nineteen tests included in this study, there were five pairs of identical GRS composites constructed with the well-graded aggregate; each pair consisted of one test with a frictionally connected CMU facing and another test without the CMU facing (table 21). The stress-strain response for each pair is shown in figure 70 through figure 74.
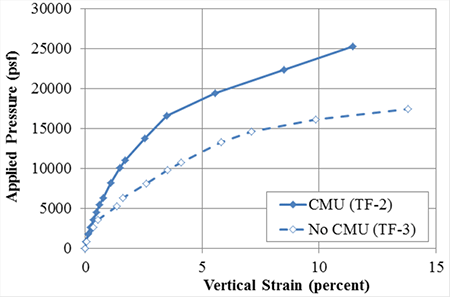
Figure 70. Graph. Stress-strain response for TF-2 (CMU facing) and TF-3 (no CMU facing) with Sv = 7⅝ inches and Tf = 2,400 lb/ft.
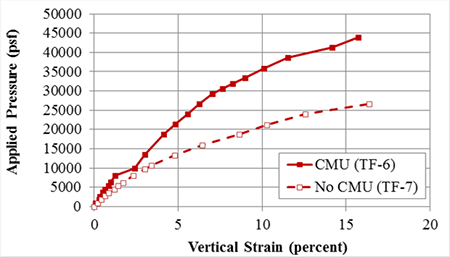
Figure 71. Stress-strain response for TF-6 (CMU facing) and TF-7 (no CMU facing) with Sv = 7⅝ inches and Tf = 4,800 lb/ft.
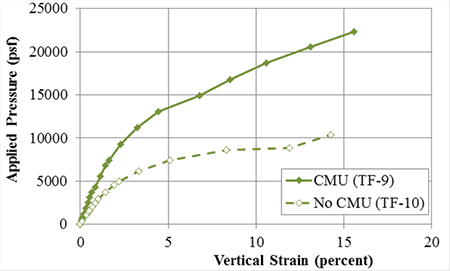
Figure 72. Graph. Stress-strain response for TF-9 (CMU facing) and TF-10 (No CMU facing) with Sv = 15¼ inches and Tf = 4,800 lb/ft.
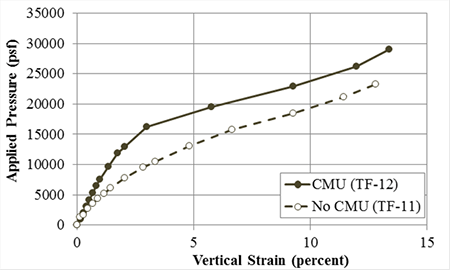
Figure 73. Graph. Stress-strain Response for TF-12 (CMU facing) and TF-11 (no CMU facing) with Sv = 3-13/16 inches and Tf = 1,400 lb/ft.
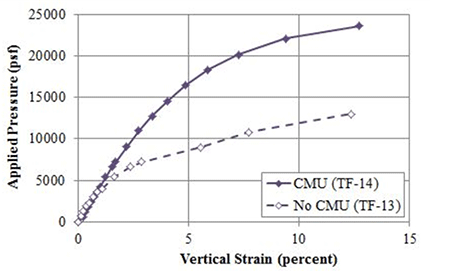
Figure 74. Graph. Stress-strain response for TF-14 (CMU facing) and TF-13 (no CMU facing) with Sv = 11¼ inches and Tf = 3,600 lb/ft.
The frictionally connected CMU facing has an impact on the performance of GRS; it provides confinement, leading to a stiffer response and an increased capacity compared to a GRS composite with no facing element (table 20). In addition, at the current service stress limit (applied stress, q, of 4,000 psf), the ratio of service vertical strain with no facing to service vertical strain with a CMU facing ranges from 1.2 to 2.2 (table 21). The largest impact was for the 15⅝-inch spaced GRS composite (TF-9 and TF-10). At ultimate failure, the ratio is considerably closer, ranging from 0.8 to 1.2.
Table 20 . Effect of CMU facing on stiffness and capacity.
Test |
Facing |
Sv |
Tf/Sv |
Eo |
Eo,CMU |
qult,emp |
qult, emp CMU |
TF-2 |
CMU |
7⅝ |
3,800 |
710 |
2.15 |
25,260 |
1.44 |
TF-3 |
None |
330 |
17,491 |
||||
TF-6 |
CMU |
7⅝ |
7,600 |
750 |
2.34 |
43,763 |
1.65 |
TF-7 |
None |
320 |
26,546 |
||||
TF-9 |
CMU |
15¼ |
3,800 |
550 |
2.12 |
22,310 |
2.16 |
TF-10 |
None |
260 |
10,330 |
||||
TF-12 |
CMU |
3-13/16 |
4,400 |
810 |
2.08 |
29,030 |
1.25 |
TF-11 |
None |
390 |
23,249 |
||||
TF-14 |
CMU |
11¼ |
3,800 |
460 |
2.09 |
23,562 |
1.82 |
TF-13 |
None |
220 |
12,960 |
Sv = the reinforcement spacing, Tf = the MARV value of the wide width tensile strength,
Eo = the initial stress-strain ratio, Eo,CMU = the initial stress-strain ratio for tests with CMU facing,
Eo, no CMU = the initial stress-strain ratio for tests without any facing, qult,emp = the measured vertical capacity, qult,emp CMU = the measured failure pressure for tests with CMU facing, and qult,emp no CMU = the measured failure pressure for tests without any facing.
Table 21 . Effect of CMU facing on strain.
Test |
Facing |
Sv |
Tf/Sv (psf) |
ε@q=4000psf |
ε@q=4000psf, no CMU |
ε@qult |
ε@qult, no CMU |
|---|---|---|---|---|---|---|---|
TF-2 |
CMU |
7⅝ |
3,800 |
0.39 |
1.84 |
11.46 |
1.20 |
TF-3 |
None |
0.73 |
13.80 |
||||
TF-6 |
CMU |
7⅝ |
7,600 |
0.55 |
1.86 |
15.70 |
0.80 |
TF-7 |
None |
1.02 |
12.50 |
||||
TF-9 |
CMU |
15¼ |
3,800 |
0.74 |
2.16 |
15.60 |
0.91 |
TF-10 |
None |
1.59 |
14.27 |
||||
TF-12 |
CMU |
3 13/16 |
4,400 |
0.50 |
1.59 |
13.37 |
0.96 |
TF-11 |
None |
0.79 |
12.79 |
||||
TF-14 |
CMU |
11¼ |
3,800 |
0.93 |
1.17 |
12.69 |
0.97 |
TF-13 |
None |
1.09 |
12.32 |
Sv = the reinforcement spacing, Tf = the MARV value of the wide width tensile strength, ε@q=4000psf = the measured strain at an applied load of 4,000 psf, and ε@qult = the measured strain at failure.
From table 20, the facing more than doubles the initial stress-strain ratio as compared to the PTs without any facing. In terms of capacity, the facing plays the biggest and smallest role for the largest spaced (Sv = 15¼ inches) and the closest spaced (Sv = 3 13/16 inches) system tested, respectively. The design assumption to not include the effect of confinement from the face in determining the capacity and required reinforcement strength is therefore conservative.(1)
While the magnitude of strain at failure is similar for a given GRS composite tested with or without a facing (table 21), the ultimate capacity is increased when a facing element is present (table 20 and figure 75). For the five pairs of tests conducted at TF (table 21), including the CMU facing produced an improved ultimate capacity between 1.25 and 2.2 times greater than the GRS composite without any facing (a similar trend to the strain at the current 4,000 psf service limit).
For the same Tf/Sv ratio of 3,800 lb/ft2, there is a linear relationship between the reinforcement spacing (Sv) and the ratio of capacity with CMU facing (qult,emp CMU) to the capacity without a facing (qult,emp no CMU) (figure 75). Similarly, there is a linear relationship with reinforcement strength (figure 76). To further investigate this, additional tests should be conducted at other Tf /Sv ratios (4,400 and 7,600 psf) and at larger reinforcement spacing.
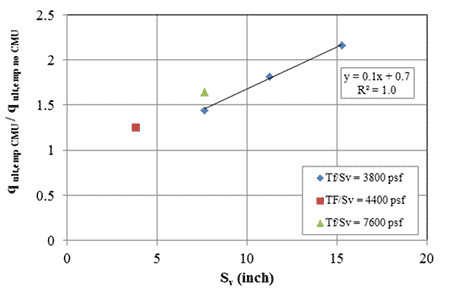
Figure 75. Graph. Effect of CMU facing on ultimate capacity as a function of reinforcement spacing.
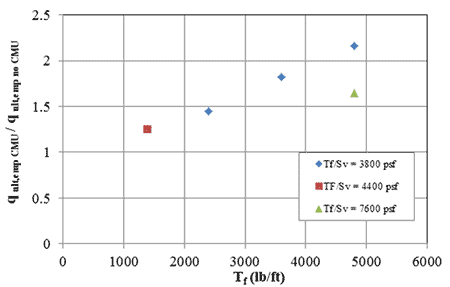
Figure 76. Graph. Effect of CMU facing on ultimate capacity as a function of reinforcement strength.
Using figure 8, the confining stress due to the facing elements can be back-calculated using the measured ultimate capacity from the PTs (figure 77). The results indicate that as reinforcement spacing increases, the effect of the facing element on the capacity is more pronounced. Note that the confining stress changes throughout the PT with applied pressure; figure 77 represents only the back-calculated confining stress at failure.
Using the equation developed by Wu et al. (2010) (figure 11), the estimated confining stress for the CMU blocks is about 72 psf, lower than that estimated at failure (figure 77).(11) The bulk unit weight and depth of the CMU is 150 pcf and 7⅝ inches, respectively; the interface friction angle between the geotextile and the CMU block was assumed equal to 37°, based on connection strength testing performed at TFHRC.(32) This simple method of determining the confining stress was used when comparing the measured capacity for each test to the estimated capacity for each test using figure 8.