U.S. Department of Transportation
Federal Highway Administration
1200 New Jersey Avenue, SE
Washington, DC 20590
202-366-4000
Federal Highway Administration Research and Technology
Coordinating, Developing, and Delivering Highway Transportation Innovations
| REPORT |
| This report is an archived publication and may contain dated technical, contact, and link information |
|
| Publication Number: FHWA-HRT-13-066 Date: August 2013 |
Publication Number: FHWA-HRT-13-066 Date: August 2013 |
Both vertical capacity and stiffness are impacted by the boundary effects related to testing. Considering the application of PTs to bridge abutments, the relationship between the more plane stress conditions of a columnar PT and the plane strain (PS) conditions of an abutment was investigated.
A PT with no facing can be considered a type of unconfined compression test; its state of stress at failure can be represented by the Mohr-Coulomb equation (figure 40).
Where τ = shear strength, σ = applied normal stress, c = cohesion and ø = friction angle. Note that when applying figure 40 to a GRS composite, c and ø represent the shear strength parameters of the GRS composite (cGRS and øGRS,respectively) and not of the backfill soil alone. In an unconfined compression PT, where the facing element has been removed, the ultimate capacity of the GRS column (qult,PT) can be approximated using figure 41.
For the PS condition, the bearing capacity of a footing supporting the bridge superstructure can be estimated using Meyerhof's (1957) solution for a rough strip footing bearing on top of a slope (figure 42):(24)
Where qult,PS = ultimate capacity of strip footing under PS conditions, cGRS is the cohesion of the GRS composite, γGRS = unit weight of the GRS composite, b = footing width, and Ncq and Nγq = bearing capacity factors for a strip footing with a rough base (given by Meyerhof, 1957). The bearing capacity factor N γq approaches zero when the slope angle (βs ) is 90° thus, figure 42 reduces to figure 43 for a vertical GRS abutment.
The ratio of the bearing capacity of a strip footing on top of a GRS abutment to that of a GRS column is therefore calculated according to figure 44.
For a surface footing (i.e., no embedment depth) on top of a vertical GRS abutment, the value of Ncq varies with the footing offset from the edge of the wall face (a), wall height (H), footing width (b), and stability factor (Ns), mathematically shown in figure 45 and graphically shown in figure 46. To use figure 46, the effective cohesion of the GRS composite is required to calculate the stability factor, Ns; this can be obtained from laboratory or numerical experiments.
![]()
Figure 45. Equation. Stability Factor.
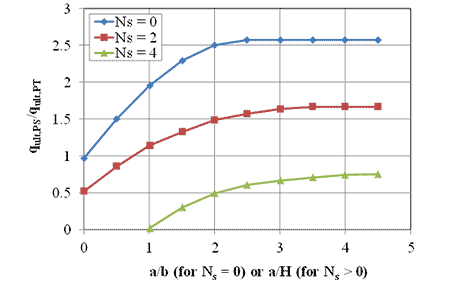
Figure 46. Graph. Ratio of plane strain capacity to PT capacity for different stability factors.
Pham (2009) conducted five plane strain generic soil-geosynthetic composite (GSGC) tests: two of the tests were identical except one was unconfined (0 psi) and the other test had a uniform confining stress of 5 psi.(25) The GRS composite consisted of a granular A-1-a backfill (soil classification = GW-GM, unit weight, γ = 153.7 lb/ft3, cohesion, c = 1,480 psf and friction angle, Φ = 50°) and a 4,800 lb/ft geotextile reinforcement spaced at 7⅝ inches. The corresponding failure stresses were about 42,450 psf and 70,957 psf for the 0 and 5 psi confining stresses, respectively. These failure stresses are calculated as the ratio of applied vertical load to the area of the top load pad (i.e. footing) on the GSGC mass for each test. Note that Pham (2009) reported failure stresses as the ratio of applied vertical load to the total area of the GSGC mass.(25)
The results of these tests can be used to determine the strength properties (cohesion and friction angle) of a particular GRS composite. The Mohr-Coulomb failure circles for the two Pham (2009) tests are shown in figure 47; the resulting cohesion and friction angle for the GRS composite tested is 3,342 psf and 72°, respectively; the stability factor (figure 45) is 0.29. Based on this stability factor, the ratio of plane strain capacity to column (PT) capacity varies with a/H (figure 48). The correction factor to convert from the PT to a plane strain condition for a typical GRS abutment with the setback (a) equal to 8 inches and height from 10 to 30 ft (i.e., a/H = 0.02 to 0.07) ranges between 0.92 and 0.97 for this particular GRS composite, close to unity. Therefore, the failure of the PT is approximately representative of an in-service PS condition for well-graded gravels, meaning the PT results can be directly used to estimate the strength limit for capacity in design. Note that the strength properties of the foundation soil underneath in-service GRS abutments would still need to be verified separately.(1)
Note that there are some limitations to the formulation above. The relationship between the bearing capacity of the strip footing and the performance tests requires the cohesion and friction angle of the GRS composite, which are not easy parameters to determine. Additional work is required to develop relationships between the composite shear strength parameters and the soil shear strength parameters, with respect to reinforcement spacing and strengths.
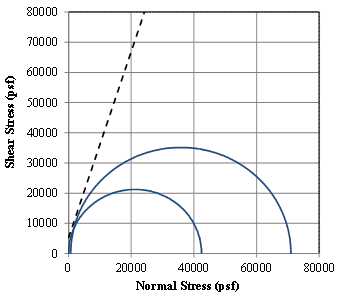
Figure 47. Graph. Mohr-Coulomb failure envelope for Pham (2009)plane strain GSGC tests.
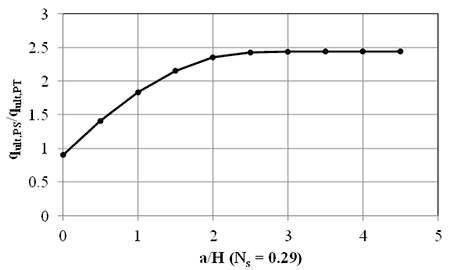
Figure 48. Graph. Plane strain capacity to PT capacity for a stability factor of 0.29.
The GRS PTs have a height to width ratio of about 2 (table 7); the stiffness of the unconfined GRS column (SPT) can therefore be taken as equal to the Young's modulus of the GRS composite (EGRS). In contrast, if a performance test was conducted on an infinitely long unconfined GRS abutment (i.e., plane strain conditions), having a finite width as shown in figure 49, the stiffness of this GRS mass is represented according to figure 50.
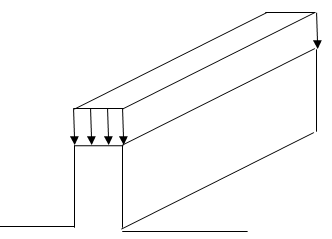
Figure 49. Illustration. Infinitely Long Unconfined GRS abutment.
![]()
Figure 50. Equation. Stiffness of an Infinitely Long Unconfined GRS abutment.
Where q = applied stress, εv= vertical strain, EGRS = Young's modulus of the GRS and νGRS = Poisson's ratio of the GRS. Assuming νGRS is equal to 0.5, this infinitely long GRS strip will be 1.33 times stiffer than a square GRS column.(2) In reality, the width is not finite in the direction perpendicular to a GRS abutment, as shown on the left of figure 51. To date, typical L/b ratios for in-service GRS abutments range between 7 and 14, depending on load requirements, where L is the length and b is the width of the bearing area. NAVFAC (1986) considers L/b ratios > 5 to be plane strain while current FHWA practice considers L/b ratios > 10 to be plane strain conditions; therefore, most GRS abutments can be idealized as plane strain. (26)
In the context of elastic theory, the bridge footing on a GRS abutment can be considered a strip running parallel to the edge of the wall at an offset, as shown on the left side of figure 51. Considering the response at low strain levels is close to elastic conditions, the stiffness of such a strip surface footing can be estimated using elastic theory, in particular the solution for a strip footing on a linear elastic half space. (27,28) Since the conditions are not a linear elastic half space for abutment applications, the solution for a strip footing on top of a wall is obtained by doubling the solution for a strip footing on a linear elastic half space, as shown on the right side of figure 51. Note that this assumes zero lateral deformations along the wall height, which is not strictly correct for GRS abutments since the CMU facing is free to displace laterally; however, it is the best available method to date to estimate vertical settlement.
For a material with a Poisson's ratio of 0.5, Gibson (1967) provided solutions for the relative displacement between the center of the strip footing and any arbitrary point assuming a constant stiffness with depth.(27) If the arbitrary point is selected to be the bottom of the GRS wall, the expression for settlement without doubling the load is shown in figure 52.
Where q = applied stress, b is the footing width, EGRS is the Young' modulus of the GRS composite, a is the setback distance between the face of the wall and the applied load, and H is the height of the abutment. The corresponding vertical strain (εv ) is given by figure 53.
Where ρ is the vertical displacement (figure 52) and H is the height of the wall.
The stiffness of a GRS abutment supporting a surface strip footing (SGRS) can be related to the applied stress (2q, due to doubling of the load) and the vertical strain (εv) (figure 54).
The ratio between this stiffness and the stiffness from a performance test (SGRS = EGRS) can then be calculated according to figure 55. The variation of stiffness ratio with b/H is plotted in figure 56. It was found that this ratio is essentially independent of the value of a/b.

Figure 55. Equation. Vertical displacement of a GRS abutment with a strip footing.
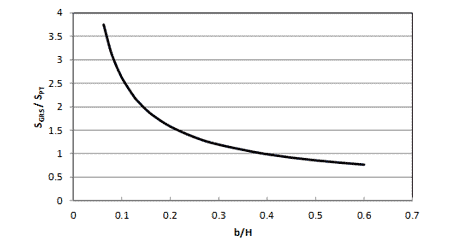
Figure 56. Graph. Ratio of plane strain stiffness of a strip footing on top of a wall (SGRS) to that of a PT (SPT) for the case of constant stiffness with depth.
For GRS abutments, b is a minimum of 2.5 ft for bridge spans larger than 25 ft and has been as large as 4.5 ft for the Tiffin River Bridge; H typically ranges from 10 to 30 ft; b/H is therefore between about 0.08 and 0.45.(5) From figure 56, the ratio of plane strain stiffness of a strip footing on top of a wall (SGRS) to that of a PT (SPT) ranges between 0.92 and 3 suggesting that the stiffness reported from a PT will be conservative (up to a factor of three times) compared to what a GRS abutment might experience in-service.
Note that further research should be conducted on the stiffness of GRS abutments, and the corresponding equivalency to a GRS PT, since the above formulations are simplistic and do not consider the effects of the facing element (e.g., CMUs) on the capacity and stiffness of a GRS composite. The effect of compaction-induced stresses and related shakedown is also ignored. Compaction-induced stresses increase the locked-in lateral stress especially in the upper reaches of the GRS; associated with an increase in confinement is an increase in stiffness and its effects should be investigated.