U.S. Department of Transportation
Federal Highway Administration
1200 New Jersey Avenue, SE
Washington, DC 20590
202-366-4000
Federal Highway Administration Research and Technology
Coordinating, Developing, and Delivering Highway Transportation Innovations
| REPORT |
| This report is an archived publication and may contain dated technical, contact, and link information |
|
| Publication Number: FHWA-HRT-13-066 Date: August 2013 |
Publication Number: FHWA-HRT-13-066 Date: August 2013 |
SIEVE ANALYSIS DATA
Table 27. AASHTO No. 8 sieve analysis (DC tests).
Sieve No. |
Sieve Size |
Mass of Soil + |
Mass of Pan |
Mass of soil |
Percent |
Percent |
0.75 |
0.75 |
0 |
1,393.3 |
0 |
0.00 |
100.00 |
0.50 |
0.5 |
0 |
1,087.9 |
0 |
0.00 |
100.00 |
0.375 |
0.375 |
1,314.4 |
1,102.7 |
211.7 |
3.01 |
96.99 |
4 |
0.187 |
6,469.6 |
1,515 |
4,954.6 |
70.49 |
26.50 |
8 |
0.0937 |
2,666.2 |
1,129 |
1,537.2 |
21.87 |
4.63 |
16 |
0.0469 |
1,105.3 |
910.2 |
195.1 |
2.78 |
1.85 |
50 |
0.0117 |
807.6 |
741.5 |
66.1 |
0.94 |
0.91 |
100 |
0.0059 |
820.1 |
809.4 |
10.7 |
0.15 |
0.76 |
200 |
0.0029 |
924.1 |
916.4 |
7.7 |
0.11 |
0.65 |
Pan |
- |
715.4 |
669.8 |
45.6 |
0.65 |
0.00 |
Table 28. AASHTO No. 8 pea gravel sieve analysis (DC tests).
Sieve |
Sieve Size |
Mass of Soil + |
Mass of Pan |
Mass of |
Percent |
Percent |
0.75 |
0.75 |
0 |
0 |
0 |
0.00 |
100.00 |
0.50 |
0.5 |
1.115 |
1.085 |
0.03 |
0.43 |
99.57 |
0.375 |
0.375 |
1.38 |
1.1 |
0.28 |
3.99 |
95.58 |
4 |
0.187 |
6.7 |
1.015 |
5.685 |
80.98 |
14.60 |
8 |
0.0937 |
1.665 |
1.13 |
0.535 |
7.62 |
6.98 |
16 |
0.0469 |
1.095 |
0.91 |
0.185 |
2.64 |
4.34 |
50 |
0.0117 |
0.86 |
0.74 |
0.12 |
1.71 |
2.64 |
Pan |
- |
0.785 |
0.6 |
0.185 |
2.64 |
0.00 |
Table 29. AASHTO No. 57 Sieve analysis (DC tests).
Sieve |
Sieve Size |
Mass of Soil + |
Mass of Pan |
Mass of |
Percent |
Percent |
1.5 |
1.5 |
1,476.1 |
1,476.1 |
0 |
0.00 |
100.00 |
1 |
1 |
1,127.1 |
1,127.1 |
0 |
0.00 |
100.00 |
0.75 |
0.75 |
2,311 |
1,393.4 |
917.6 |
12.09 |
87.91 |
0.50 |
0.5 |
5,052.1 |
1,087.8 |
3,964.3 |
52.22 |
35.69 |
0.375 |
0.375 |
2,739.5 |
1,102.7 |
1,636.8 |
21.56 |
14.13 |
4 |
0.187 |
2,308.8 |
1,514.8 |
794 |
10.46 |
3.67 |
8 |
0.0937 |
1,224.5 |
1,128.9 |
95.6 |
1.26 |
2.41 |
16 |
0.0469 |
981.1 |
909.8 |
71.3 |
0.94 |
1.47 |
200 |
0.0029 |
974.5 |
916.7 |
57.8 |
0.76 |
0.71 |
Pan |
- |
723.3 |
669.7 |
53.6 |
0.71 |
0.00 |
Table 30. AASHTO No. 9 Sieve analysis (DC tests).
Sieve |
Sieve Size |
Mass of Soil + |
Mass of Pan |
Mass of |
Percent |
Percent |
0.75 |
0.75 |
0 |
1,393.21 |
0 |
0.00 |
100.00 |
0.50 |
0.5 |
0 |
1,087.95 |
0 |
0.00 |
100.00 |
0.375 |
0.375 |
0 |
1,102.79 |
0 |
0.00 |
100.00 |
4 |
0.187 |
1,785.33 |
1,514.98 |
270.35 |
5.78 |
94.22 |
8 |
0.0937 |
4,236.2 |
1,129.04 |
3,107.16 |
66.47 |
27.75 |
16 |
0.0469 |
1,791.1 |
909.95 |
881.15 |
18.85 |
8.90 |
50 |
0.0117 |
986.6 |
741.69 |
244.91 |
5.24 |
3.66 |
100 |
0.0059 |
830 |
809.4 |
20.6 |
0.44 |
3.22 |
200 |
0.0029 |
934.9 |
916.46 |
18.44 |
0.39 |
2.82 |
Pan |
- |
732.6 |
600.56 |
132.04 |
2.82 |
0.00 |
Table 31. AASHTO No. 8 Sieve analysis (TFHRC tests).
Sieve |
Sieve Size |
Mass of Soil + |
Mass of Pan |
Mass of |
Percent |
Percent |
1 |
1 |
1,127.1 |
1,127.1 |
0 |
0.00 |
100.00 |
0.50 |
0.5 |
1,116.5 |
1,087.7 |
28.8 |
0.31 |
99.69 |
0.375 |
0.375 |
3,832 |
1,102.6 |
2,729.4 |
29.83 |
69.86 |
4 |
0.187 |
6,694.3 |
1,013.8 |
5,680.5 |
62.08 |
7.78 |
8 |
0.0937 |
1,688.5 |
1,128.7 |
559.8 |
6.12 |
1.66 |
10 |
0.079 |
1,398.7 |
1,374 |
24.7 |
0.27 |
1.39 |
16 |
0.0469 |
935 |
909.7 |
25.3 |
0.28 |
1.11 |
40 |
0.0165 |
810 |
793.1 |
16.9 |
0.18 |
0.93 |
50 |
0.0117 |
746.2 |
741.8 |
4.4 |
0.05 |
0.88 |
Pan |
- |
750.4 |
669.8 |
80.6 |
0.88 |
0.00 |
Table 32. AASHTO A-1-a (VDOT 21A) sieve analysis (TFHRC tests).
Sieve |
Sieve Size |
Mass of Soil + |
Mass of Pan |
Mass of |
Percent |
Percent |
1 |
1 |
1,127.1 |
1,127.1 |
0 |
0.00 |
100.00 |
0.50 |
0.5 |
1,919.2 |
1,087.6 |
831.6 |
17.59 |
82.41 |
0.375 |
0.375 |
1,624.9 |
1,102.7 |
522.2 |
11.05 |
71.36 |
4 |
0.187 |
2,093.7 |
1,013.8 |
1,079.9 |
22.84 |
48.52 |
8 |
0.0937 |
1,757.5 |
1,129.6 |
627.9 |
13.28 |
35.24 |
10 |
0.079 |
1,489.5 |
1,374.7 |
114.8 |
2.43 |
32.81 |
16 |
0.0469 |
1,260.5 |
910.1 |
350.4 |
7.41 |
25.40 |
40 |
0.0117 |
1,206.5 |
793.1 |
413.4 |
8.74 |
16.66 |
200 |
0.0029 |
1,397.8 |
916.5 |
481.3 |
10.18 |
6.47 |
Pan |
- |
975.7 |
669.6 |
306.1 |
6.47 |
0.00 |
Table 33. Summary of AASHTO No. 8 LSDS results (DC tests).
Soil |
Normal |
Max Shear |
Peak Friction |
Peak Dilation |
Gap |
8 |
5.051 |
9.5114 |
62.03 |
12.96 |
0.343 |
8 |
10.03 |
19.0619 |
62.25 |
11.65 |
0.343 |
8 |
20.03 |
30.533 |
56.73 |
6.35 |
0.343 |
8 |
30.02 |
45.6537 |
56.67 |
5.63 |
0.343 |
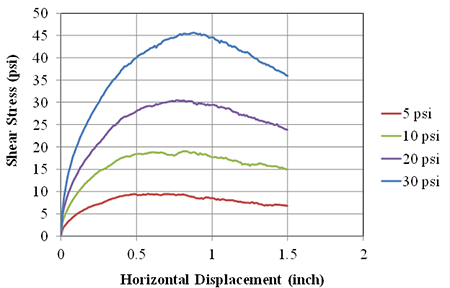
Figure 95. Graph. AASHTO No. 8 LSDS test results (DC tests).
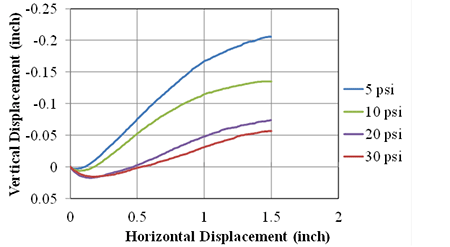
Figure 96. AASHTO No. 8 LSDS deformation test results (DC tests).
Table 34. Summary of AASHTO No. 8 pea gravel LSDS results (DC tests).
Soil |
Normal |
Max Shear |
Peak Friction |
Peak Dilation |
Gap |
8P |
5.022 |
7.5449 |
56.35 |
13.19 |
0.35 |
8P |
10.05 |
15.00489 |
56.19 |
11.79 |
0.35 |
8P |
20.01 |
21.238 |
46.71 |
5.96 |
0.35 |
8P |
30.01 |
35.1467 |
49.51 |
6.04 |
0.35 |
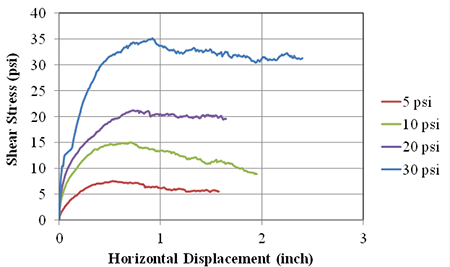
Figure 97. Graph. AASHTO No. 8 pea gravel LSDS test results (DC tests).
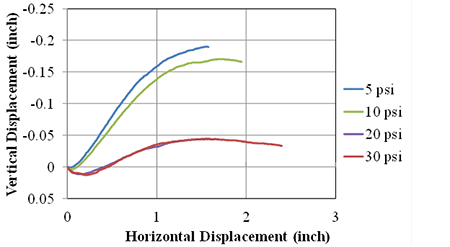
Figure 98. Graph. AASHTO No. 8 pea gravel LSDS deformation test results (DC tests).
Table 35. Summary of AASHTO No. 57 LSDS results (DC tests).
Soil |
Normal |
Max Shear |
Peak Friction |
Peak Dilation |
Gap |
57 |
5.013 |
17.547 |
74.06 |
15.36 |
0.74 |
57 |
10.01 |
21.187 |
64.71 |
13.15 |
0.74 |
57 |
20.04 |
40.212 |
63.51 |
9.93 |
0.74 |
57 |
30.01 |
47.189 |
57.55 |
6.28 |
0.74 |
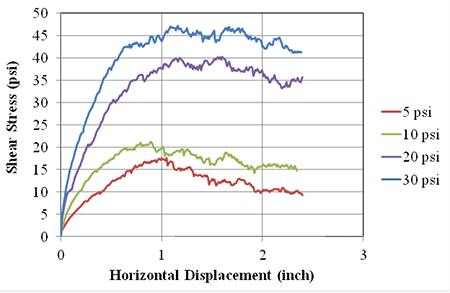
Figure 99. Graph. AASHTO No. 57 LSDS test results (DC tests).
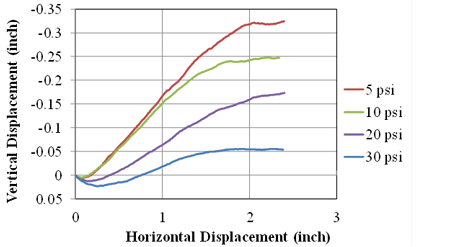
Figure 100. Graph. AASHTO No. 57 LSDS deformation test results (DC tests).
Table 36. Summary of AASHTO No. 9 LSDS results (DC tests).
Soil |
Normal |
Max Shear |
Peak Friction |
Peak Dilation |
Gap |
9 |
5.053 |
9.7334 |
62.56 |
13.64 |
0.175 |
9 |
10.04 |
17.698 |
60.43 |
10.38 |
0.175 |
9 |
20.01 |
31.97 |
57.96 |
5.82 |
0.175 |
9 |
30.02 |
42.8381 |
54.98 |
4.73 |
0.175 |
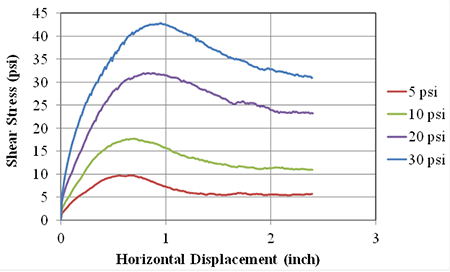
Figure 101. Graph. AASHTO No. 9 LSDS test results (DC tests).
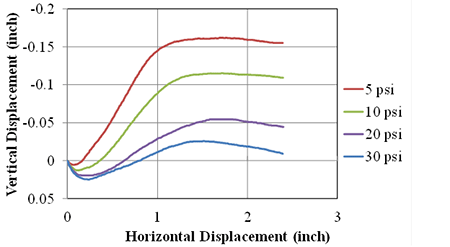
Figure 102. Graph. AASHTO No. 9 Deformation test results (DS tests).
Table 37. Summary of AASHTO No. 8 LSDS results (TFHRC tests).
Soil |
Normal |
Max Shear |
Peak Friction |
Peak Dilation |
Gap |
8 |
5.04 |
15.220948 |
71.68 |
15.66 |
0.443 |
8 |
10.06 |
26.73174 |
69.38 |
11.01 |
0.443 |
8 |
20.03 |
39.8865 |
63.34 |
8.07 |
0.443 |
8 |
30.02 |
52.54942 |
60.26 |
5.10 |
0.443 |
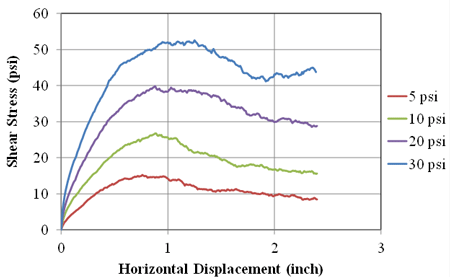
Figure 103. Graph. AASHTO No. 8 LSDS test results (TFHRC tests).
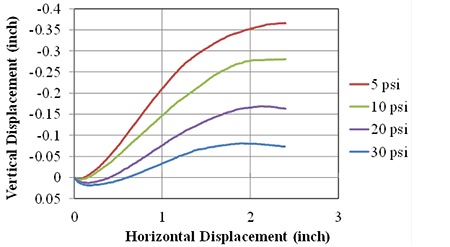
Figure 104. Graph. AASHTO No. 8 LSDS deformation test results (DC tests).
Table 38. Summary of AASHTO A-1-a (VDOT 21A) LSDS results (TFHRC tests).
| Soil Type |
Test Condition |
Normal Stress (psi) |
Max Shear (psi) |
Peak Friction Angle(°) |
Peak Dilation Angle (°) |
Gap (inch) |
|---|---|---|---|---|---|---|
21A |
Dry |
5.046 |
17.305 |
73.74 |
26.08 |
0.58 |
21A |
Dry |
10.05 |
23.6762 |
67.00 |
20.48 |
0.58 |
21A |
Dry |
20.02 |
40.35021 |
63.61 |
12.58 |
0.58 |
21A |
Dry |
30.03 |
50.135 |
59.08 |
11.05 |
0.58 |
21A |
Saturated |
4.99 |
5.46532 |
47.60 |
0.00 |
0.58 |
21A |
Saturated |
9.991 |
14.2569 |
54.98 |
0.05 |
0.58 |
21A |
Saturated |
19.98 |
25.034 |
51.41 |
0.00 |
0.58 |
21A |
Saturated |
29.99 |
36.2423 |
50.39 |
0.00 |
0.58 |
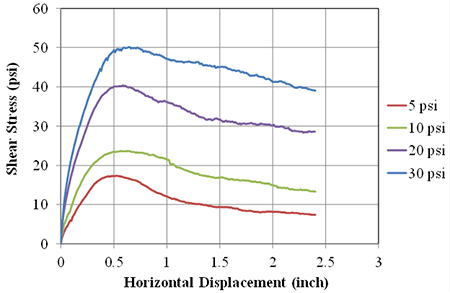
Figure 105. Graph. AASHTO A-1-a (VDOT 21A) LSDS test results (TFHRC tests).
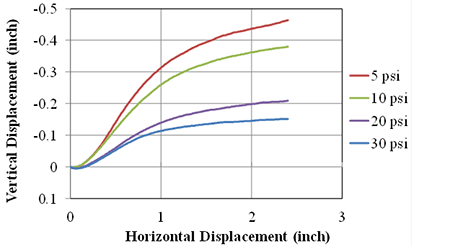
Figure 106. Graph. AASHTO A-1-a (VDOT 21A) LSDS deformation test results (DC tests).