U.S. Department of Transportation
Federal Highway Administration
1200 New Jersey Avenue, SE
Washington, DC 20590
202-366-4000
Federal Highway Administration Research and Technology
Coordinating, Developing, and Delivering Highway Transportation Innovations
| REPORT |
| This report is an archived publication and may contain dated technical, contact, and link information |
|
| Publication Number: FHWA-HRT-13-066 Date: August 2013 |
Publication Number: FHWA-HRT-13-066 Date: August 2013 |
The results for each test are presented in table 8. The corresponding vertical stress-strain curves are shown in figure 26 and figure 27 for the Defiance County tests (labeled DC) and the TFHRC tests (labeled TF), respectively. The tabular data for each stress-strain curve shown in figure 26 and figure 27 is given in appendix D. Note that the applied stress and strain are calculated as averages of the measured values (over the period of loading for stress and over the four LVDT/POTs located on the footing for strain at the end of each load increment).
Table 8. PT measured results summary.
|
Maximum Tested |
Strength Limit |
Design Limit |
Service Limit |
||
Test |
qmax |
εmax |
qult,emp |
q@ε=5% |
Vallow,emp = q@ε=5%/3.5 |
q@ε=5% |
DC-1 |
23,310 |
7.95 |
23,310 |
19,983 |
5,709 |
3,065 |
DC-2 |
22,709 |
7.07 |
22,709 |
19,399 |
5,543 |
2,171 |
DC-3 |
18,447 |
5.82 |
N/A |
16,182 |
4,623 |
1,324 |
DC-4 |
26,730 |
7.64 |
N/A |
17,350 |
4,957 |
2,212 |
DC-5 |
21,539 |
10.42 |
21,539 |
11,761 |
3,360 |
316 |
TF-1 |
20,487 |
10.9 |
20,487 |
13,409 |
3,831 |
2,075 |
TF-2 |
25,260 |
11.46 |
25,260 |
18,711 |
5,346 |
4,759 |
TF-3 |
17,491 |
13.8 |
17,491 |
12,120 |
3,463 |
3,417 |
TF-4 |
14,240 |
4.4 |
N/A |
N/A1 |
N/A1 |
3,705 |
TF-5 |
25,920 |
17.9 |
25,920 |
15,581 |
4,452 |
1,815 |
TF-6 |
43,828 |
15.7 |
43,828 |
22,007 |
6,288 |
3,704 |
TF-7 |
26,546 |
12.5 |
26,546 |
13,684 |
3,910 |
2,224 |
TF-8 |
29,134 |
17.8 |
29,134 |
13,797 |
3,942 |
1,753 |
TF-9 |
22,310 |
15.6 |
22,310 |
13,527 |
3,865 |
2,955 |
TF-10 |
10,330 |
14.27 |
10,330 |
7,374 |
2,107 |
1,586 |
TF-11 |
23,249 |
12.79 |
23,249 |
13,316 |
3,805 |
2,839 |
TF-12 |
29,030 |
13.37 |
29,030 |
18,573 |
5,307 |
4,028 |
TF-13 |
12,960 |
12.32 |
12,960 |
8,641 |
2,469 |
2,398 |
TF-14 |
23,562 |
12.69 |
23,562 |
16,748 |
4,785 |
2,037 |
qmax = the maximum applied pressure during testing, εmax = the maximum recorded vertical strain, qult,emp is the measured failure pressure,q@ε=5% = the applied stress at 5 percent vertical strain, Vallow,emp is the total allowable pressure on the GRS,(1) q@ε=0.5% = the applied stress at 0.5 percent vertical strain.
N/A = Not applicable, did not fail composite. N/A1 = Not applicable, composite did not reach 5-percent vertical strain before it was terminated.

Figure 26. Graph. Load-deformation behavior for the Defiance County PTs.

Figure 27. Graph. Load-deformation behavior for the Turner Fairbank PTs.
Note that two Defiance County (DC-3 and DC-4) and one TFHRC test (TF-4) were prematurely terminated before failure of the GRS composite. For the DC tests, the 6-inch stroke of the hydraulic jacks limited the amount of deformation that could be applied to the samples without resetting the experiment, which did not occur. For the TF test, the applied load on TF-4 was not uniform, leading to tilting of the footing (figure 28). Analysis of the data shows this to be the case.
The TF-4 data plotted on the family of load test curves shown in figure 27 is the average measured settlement from the four string POTs located on each side of the top of the footing. Figure 29 shows the settlement data for each POT, along with the average, for the TF-4 test. As indicated visually (figure 28), the measurements (figure 29) confirm that the footing titled towards sides 3 and 4 of the footing. Figure 28 also illustrates the composite behavior of GRS (i.e., the soil and geosynthetic tend to move together as one material).
TF-1, TF-5 and TF-6 experienced technical difficulties during testing that resulted in an unloading/reloading of the composite (figure 30, figure 31 and figure 32, respectively). The load test curves shown in figure 27 were corrected to omit the unload/reload cycles.
Due to a power outage at TFHRC during testing for TF-1 (figure 30), the GRS composite was unloaded for a period of over 40 hours (1.7 days); the maximum applied stress prior to unloading of the composite was 12,761 psf. After reestablishing power, the sample was then reloaded with the approximate same loading schedule as the initial load until failure of the composite was reached at 20,487 psf. The initial ratio of stress to strain (Eo) is equal to approximately 320 ksf, while the reload response was considerably stiffer by a factor of over 6, with a reload ratio of stress to strain (ER) around 2,070 ksf.
For TF-5 (figure 31), the GRS composite was initially loaded and reloaded twice at low applied loads (less than 4,700 psf). The string potentiometers were reset in each case. An additional unloaded cycle then occurred for a period of 12 minutes 50 seconds in order to reset the single hollow-core jack because of the stroke limitation (hence, the change to the use of two jacks in series starting with TF-6). After resetting the jack, the sample was then reloaded at the approximate same loading schedule as the initial load. The last reload cycle that occurred during TF-5 was at an applied stress of about 25,000 psf (14th load increment). The failure load was measured at 25,920 psf meaning the unload/reload cycle occurred near failure when the GRS composite had already experienced considerable spalling and necking because of the lack of the facing element. The initial ratio of stress to strain for virgin loading (Eo) of TF-5 during the first applied loading sequence is about 560 ksf. The first and second reload cycles were considerably stiffer, both with a reload ratio of stress to strain equal to approximately 2,900 ksf, supporting the shakedown concept. The last reload cycle; however, is not as stiff as the first two. It is hypothesized by the authors that the strain hardening effect observed in TF-1 was not as pronounced during TF-5 at higher applied loads because the GRS composite had necked considerably prior to the last reload cycle. TF-7 was therefore conducted to determine if there was an effect of the necking of the sample on the capacity of the composite.
The two unload/reload cycles that occurred during TF-6 were at applied stresses of approximately 4,500 psf and 8,000 psf (5th and 10th load increment, respectively). Figure 32 indicates that preloading of the GRS composite resulted in strain hardening to produce a stiffer response during the reload cycle. The reload response is similar during both cycles, with a ratio of stress to strain (ER) equal to approximately 3,000 ksf, compared to the ratio for the initial, virgin loading (Eo) equal to approximately 750 ksf, an increase by a factor of four.
Typical values of the soil modulus for shallow foundation applications is between about 200 to 400 ksf for natural foundation soils.(21) Based on the results of this series of PTs, GRS composites are stiffer, with modulus values between about 320 and 750 ksf. Preloading results in an even stiffer composite. The strain hardening effect due to preloading was observed during the FHWA GRS Pier load test in 1995 and in-service, with the preloaded GRS abutments for the Blackhawk bridge built in Central City, CO, in 1998.(22,23) To study the possible shakedown phenomenon and resulting response under repeated unload/reload cycles, additional performance testing under cyclic load is needed.
The repeatability of the test method was indirectly measured through four PTs (TF-4, TF-5, TF-7, and TF-8, see TABLE 1) on nearly identical GRS composites (figure 33). Note that TF-4 was prematurely terminated due to uneven loading and settlement and TF-8 had two courses of bearing bed reinforcement at the top. For TF-5, the stress-strain curve for both the initial loading sequence is plotted to compare to the other tests at lower applied loads, with the stress-strain curve starting on the second reload cycle also plotted to compare to the other tests at higher applied loads. All of the tests were performed without CMU facing. The results indicate good agreement and suggest that the performance test produces repeatable results.
The new internal stability design method proposed by Adams et al. 2011a for GRS accounts for functions of the geosynthetic reinforcement beyond simple tensile inclusions and takes into account the backfill and reinforcement spacing comprising the GRS composite material.(1) In this model, connection, reinforcement pullout, and other mechanisms associated with a tie-back design model are not modes of failures for closely spaced GRS. (10) Adding to the understanding of the composite behavior, conducting PTs without a CMU facing allowed for the failure surface for each GRS composite to be visually observed.
For the PTs with reinforcement spacing less than 12 inches, a shear surface formed through the composite (figure 34, figure 35, and figure 36), leading to rupture of the reinforcement. The same mode of failure was not seen for the 15¼ -inch spaced system (figure 37) where failure was determined by the soil between the sheets of geotextile, and the full strength of the reinforcement was never developed.

Figure 33. Graph. Repeatability of PT at TFHRC.

Figure 34. Photo. TF-11 at failure with Sv = 3-13/16 inches, Tf = 1,400 lb/ft, and 21A material.

Figure 35. Photo. TF-3 at failure with Sv = 7⅝ inches, Tf = 2,400 lb/ft, and 21A material.

Figure 36. Photo. TF-13 at failure with Sv = 11¼ inches, Tf = 3,600 lb/ft, and 21A material.

Figure 37. Photo. TF-10 at failure with Sv = 15¼ inches, Tf = 4,800 lb/ft, and 21A material.
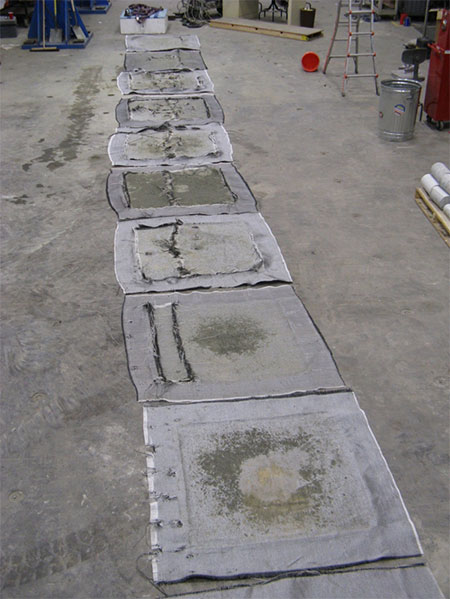
The same diagonal shear failure mechanism could also be seen through forensic examination of the geotextile after testing the PTs with facing elements. For example, figure 38 shows the rupture pattern in each layer of reinforcement for TF-6 (qult,emp = 43,828 psf); the lowest layer of reinforcement (near the base of the GRS composite) is in the foreground of the figure with subsequent layers laid out above. A distinct rupture pattern follows a diagonal path through the depth of the specimen; rupture around the connections is also seen in the middle layers.
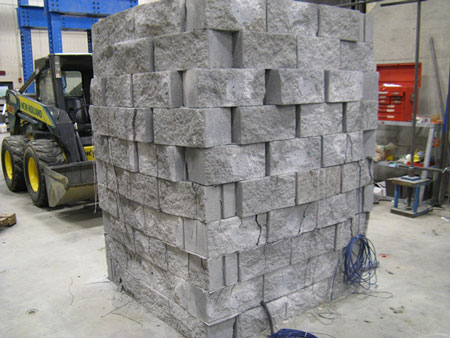
Rupture at the connections occurred due to extreme downdrag of the reinforced fill behind the block whereby the differential settlement between the fill and the block caused tension (and ultimately rupture) in the reinforcement at the connection. For example, at failure, TF-6 experienced a total maximum vertical strain of 15.7 percent, equating to about 1 ft of settlement; considering the reinforcement layers are spaced every 0.64 ft, the total settlement extended below one layer of the GRS composite. Note that even with the rupture at the connections, only some cracking of the facing blocks was observed (figure 39).

Figure 38. Photo. Rupture pattern for geotextiles in TF-6 (qult,emp = 43,828 psf); the lowest layer of reinforcement is the closet fabric in the picture.

Figure 39. Photo. Post-test picture of TF-6 (Sv = 7⅝ inches, Tf = 4,800 lb/ft).