U.S. Department of Transportation
Federal Highway Administration
1200 New Jersey Avenue, SE
Washington, DC 20590
202-366-4000


Skip to content
Facebook iconYouTube iconTwitter iconFlickr iconLinkedInInstagram

Federal Highway Administration Research and Technology
Coordinating, Developing, and Delivering Highway Transportation Innovations

 
REPORT
This report is an archived publication and may contain dated technical, contact, and link information
Back to Publication List        
Publication Number:  FHWA-HRT-14-049    Date:  August 2014
Publication Number: FHWA-HRT-14-049
Date: August 2014


Mitigation of Wind-Induced Vibration of Stay Cables: Numerical Simulations and Evaluations

CHAPTER 7: TIME-HISTORY ANALYSIS OF STAY CABLE SYSTEMS WITH CROSSTIES AND DAMPERS

INTRODUCTION

In the preceding chapters, stay cables networked with transverse crossties or equipped with external dampers were analyzed for their dynamic behavior under selected wind events. In this chapter, a case in which stay cables were equipped with a combination of crossties and external dampers are investigated.

PERFORMANCE OF STAY CABLE SYSTEMS WITH DIFFERENT MITIGATION STRATEGIES

Figure 133 shows stay cable systems with different mitigation strategies: a system with no crossties and no dampers, a system without crossties but with dampers, a system with crossties but without dampers, and a system with crossties and with dampers. Dampers were not installed on the Bill Emerson Memorial Bridge; however, dampers are included in this study to look into their usefulness as an alternate or supplementary mitigation measure for retrofit or new design of other similar bridges. The external viscous dampers are attached to the stays near their deck anchorages, with d/L ratios ranging from 2 percent (for most cables) to 6 percent (for the shortest cable). The damping coefficients (or the C-values) for dampers on individual cables were determined from the universal damping curve presented in figure 123.

This image shows finite element model of a stay cable system of the Bill Emerson Memorial Bridge (a) without crossties or dampers, (b) without crossties and with dampers, (c) with crossties and without dampers, and (d) with crossties and dampers. A viscous damper is installed on each cable near its deck anchorage, and four parallel lines of crossties are used. For all four plots, the ends of the stay cables and crossties are assumed to be fixed either to the deck or tower.
Figure 133 . Image. Stay cable system (a) without crossties or dampers, (b) without crossties and with dampers, (c) with crossties and without dampers, and (d) with crossties and dampers.

Figure 134 and figure 135 show the displacement profiles retrieved at the mid- and quarter-span of cable 1, the longest cable. The energy evolution of each system considered is shown in figure 136. It can be seen from these figures that crossties are efficient in reducing static displacements (contributing to the potential energy), while dampers are efficient in reducing vibration amplitudes (contributing to the kinetic energy). Also, it is found that crossties tend to induce high-frequency vibrations of a stay system. Incorporation of crossties into a cable system adds stiffness to the system, while external dampers provide an additional source of energy dissipation. Based on the results shown, it is difficult to judge how much improvement can be gained from a combined use of crossties and dampers over the cases of their separate, independent uses.

This graph shows displacement at the mid-span of the longest cable in a stay cable system (a) without crossties or dampers, (b) without crossties and with dampers, (c) with crossties and without dampers, and (d) with crossties and dampers. The displacement shown is the horizontal component parallel to the bridge axis, and the cable system is subjected to the reference wind profile, wind-1. The x-axis shows time ranging from 0 to 300 s, and the y-axis shows displacement ranging from -1.97×10⁻² to 4.59×10⁻² ft (-6.0×10⁻³ to 14.0×10⁻³ m). For all four plots, the displacements fluctuate rapidly with time. Dampers are more efficient in reducing the amplitudes of vibration, while crossties are more efficient in reducing the static components of cable motion.
Figure 134 . Graph. Displacement profile computed at the mid-span of the longest cable in a system (a) without crossties or dampers, (b) without crossties and with dampers, (c) with crossties and without dampers, and (d) with crossties and dampers.

This graph shows displacement profiles at the quarter-span of the longest cable in a stay cable system (a) without crossties or dampers, (b) without crossties and with dampers, (c) with crossties and without dampers, and (d) with crossties and dampers. The displacement shown is the horizontal component parallel to the bridge axis, and the cable system is subjected to the reference wind profile, wind-1. The x-axis shows time ranging from 0 to 300 s, and the y-axis shows displacement ranging from -1.97×10⁻² to 4.59×10⁻² ft (-6.0×10⁻³ to 14.0×10⁻³ m). All four displacements fluctuate rapidly with time but with reduced amplitude compared to those at the mid-span discussed in figure 134.
Figure 135 . Graph. Displacement profile computed at the quarter-span of the longest cable in a system (a) without crossties or dampers, (b) without crossties and with dampers,(c) with crossties and without dampers, and (d) with crossties and dampers.

This graph shows the evolution of mechanical energies of a stay cable system (a) without crossties or dampers, (b) without crossties and with dampers, (c) with crossties and without dampers, and (d) with crossties and dampers. The x-axis shows time ranging from 0 to 300 s, and the y-axis shows energy ranging from 0 to 1,100 ft-lbf (0 to 1.5 kJ). The potential energy is represented by a green line, the kinetic energy by a red line, the energy dissipation via cable’s inherent damping by a blue line, and the energy dissipation via external damper by a yellow line. For all plots, potential and kinetic energy fluctuate rapidly with time, and energy dissipation gradually accumulates over time. Among the four strategies studied, a system with dampers only produces the least amount of kinetic energy, and a system with dampers and crossties produces the least amount of potential energy. Largest energy dissipation via cable’s inherent damping occurs when the system does not have dampers or crossties and reaches about 1,100 ft-lbf (1.5 kJ) over a period of 288 s. The largest energy dissipation via external dampers occurs when the system has dampers only and reaches about 930 ft-lbf (1.26 kJ) over a period of 300 s.
Figure 136 . Graph. Energy evolution of a cable system (a) without crossties or dampers, (b) without crossties and with dampers, (c) with crossties and without dampers, and (d) with crossties and dampers.

DETERMINATION OF DAMPER COEFFICIENTS

It is to be noted that the optimal damper coefficients for cables networked with crossties may not necessarily be the same as those determined from stand-alone individual cables. The optimal coefficient for a damper is commonly determined from the dynamics of a stand-alone cable to which the damper is attached. Incorporation of crossties introduces transverse constraints to individual stay cables and forces these cables to behave as a network, which makes it difficult to determine the optimal damper coefficient for each cable. No plausible solution to this problem has been identified in the literature.

Further research is needed to determine optimal parameters for dampers installed on stay cables networked with crossties. In this analysis, two simple approaches were tentatively taken to determining the C-values for dampers attached to networked stay cables. In the first approach, referred to as "C-Individual," each individual cable was viewed as a stand-alone cable for the purpose of determining its optimal C-value. In the second approach, referred to as "C-System," ω1 in figure 124 was interpreted as the fundamental natural frequency of the networked cable system, while other parameters in the equation were associated with each individual cable. For example, for the cable system with four lines of crossties, ω1 = 1.38 Hz.

The C-values for cable 1 (longest cable) and cable 16 (shortest cable) determined from the C-Individual method are 30 and 3.3 kip-s/ft (436 and 48 kN-s/m), respectively. In the C-System method, the C-values for cables 1 and 16 are 75 and 2.4 kip-s/ft (1,095 and 35 kN-s/m), respectively. Figure 137 and figure 138 compare the results from the displacement and energy evolution approaches, respectively. The difference in results from the two methods is negligibly small, which suggests insensitivity of the system behavior to small variations of C-values.

This graph compares displacement profiles at the mid-span of the longest cable in a stay cable system augmented with dampers and crossties using individual cables’ natural frequencies (left) and when damper coefficients are used based on a cable system’s natural frequencies (right). The x-axis shows time ranging from 0 to 300 s, and the y-axis shows displacement ranging from  9.8×10⁻³ to 2.3×10⁻² ft (-3.0×10⁻³ to 7.0×10⁻³ m). The displacement shown is the horizontal component parallel to the bridge axis, and the cable systems are subjected to the reference wind profile, wind-1. The displacements fluctuate rapidly with time. A comparison of displacement profiles indicates that not much difference exists between the two approaches.
Figure 137 . Graph. Comparison of displacements at mid-span of the longest cable when damper coefficients are used based on individual cables' natural frequencies (left) and when damper coefficients are used based on a cable system's natural frequencies (right).
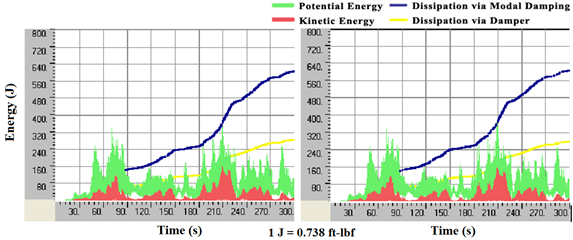
This graph shows the evolution of mechanical energies of a stay cable system augmented with dampers and crossties using individual cables’ natural frequencies (left) and when damper coefficients are used based on a cable system’s natural frequencies (right). The x-axis shows time ranging from 0 to 300 s, and the y-axis shows energy ranging from 0 to 590 ft-lbf (0 to 800 J). The potential energy is represented by a green line, the kinetic energy by a red line, the energy dissipation via cable’s inherent damping by a blue line, and the energy dissipation via external damper by a yellow line. For both plots, potential and kinetic energy fluctuate rapidly with time, and energy dissipation gradually accumulates over time. A comparison of energy evolution characteristics indicates that not much difference exists between the two approaches.
Figure 138 . Graph. Comparison of energy evolution of the system when damper coefficients are used based on individual cables' natural frequencies (left) and when damper coefficients are used based on a cable system's natural frequencies (right).

In order to check the system performance under larger variations of C-values, four different cases were considered: C = Copt, C = 5 Copt, C = 10 Copt, and C = 100 Copt. Figure 139 compares the energy evolution of the cable system when these four different C-values are used. Among the four cases tested, C = 5 Copt gives the best result with largest energy dissipation via dampers (thus resulting in smallest dissipation demand via cable's intrinsic modal damping). As the C-value further increases, the vibration of the cable system increases. It is to be noted that Copt denotes the optimal damper coefficient for a damper attached to a stand-alone stay cable, not a networked cable. This experiment suggests that when dampers are attached to stays networked with crossties, larger dampers are required than when dampers are attached to stays not networked with crossties.

This graph shows the evolution of mechanical energies of a stay cable system augmented with dampers and crossties using the optimal damper coefficient (Copt), 5 times Copt, 10 times Copt, and 100 times Copt for stand-alone individual cables. The x-axis shows time ranging from 0 to 300 s, and the y-axis shows energy ranging from 0 to 369 ft-lbf (0 to 500 J). The potential energy is represented by a green line, the kinetic energy by a red line, the energy dissipation via cable’s inherent damping by a blue line, and the energy dissipation via external damper by a yellow line. For all plots, potential and kinetic energy fluctuate rapidly with time, and energy dissipation gradually accumulates over time. Among the four cases studied, the case of using five times Copt results in best vibration mitigation, manifested by the largest energy dissipation via dampers. About 258 ft-lbf (350 J) of energy dissipation is accumulated over a time period of 300 s.
Figure 139 . Graph. Influence of damper coefficients on system energy evolution when (a) C = Copt, (b) C = 5 Copt, (c) C = 10 Copt, and (d) C = 100 Copt.

PERFORMANCE OF STAY CABLE SYSTEMS UNDER OTHER WIND LOADS

So far in this chapter, the discussion has focused on a stay cable system subjected to the reference wind load, wind-1. The performance of a stay system augmented with crossties and dampers was also investigated when the system was subjected to wind-2, wind-3, and wind-hf. Figure 140 through figure 142 show the energy evolution of a cable system subjected to these wind profiles. Figure 141 and figure 142 indicate that the use of crossties are effective in reducing stay vibrations induced by steady winds, while dampers are more effective to control vibrations induced by highly turbulent winds. In all cases tested, a combined use of crossties and dampers rendered better mitigation effects than their independent uses.
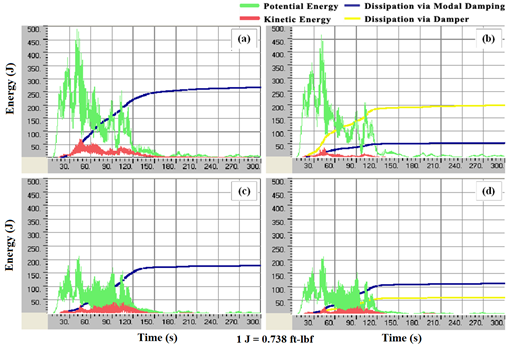
This graph shows the evolution of mechanical energy of a stay cable system subjected to wind-2 (a) without crossties or dampers, (b) without crossties and with dampers, (c) with crossties and without dampers and (d) with crossties and dampers. The x-axis shows time ranging from 0 to 300 s, and the y-axis shows energy ranging from 0 to 369 ft-lbf (0 to 500 J). The potential energy is represented by a green line, the kinetic energy by a red line, the energy dissipation via cable’s inherent damping by a blue line, and the energy dissipation via external damper by a yellow line. For all plots, potential and kinetic energy fluctuate rapidly with time, and energy dissipation gradually accumulates over time. Among the four strategies studied, a system with dampers only produces the least amount of kinetic energy, and a system with dampers and crossties produces the least amount of potential energy. Largest energy dissipation via cables’ inherent damping occurs when the system does not have dampers or crossties and reaches about 199 ft-lbf (270 J) over a period of 300 s. Largest energy dissipation via external dampers occurs when the system has dampers only and reaches about 148 ft-lbf (200 J) over a period of 300 s.
Figure 140 . Graph. Energy evolution of the cable system under wind-2 (a) without crossties or dampers, (b) without crossties and with dampers, (c) with crossties and without dampers, and (d) with crossties and dampers.
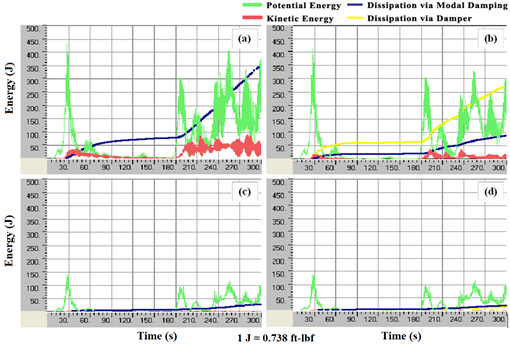
This graph shows the evolution of mechanical energies of a stay cable system subjected to wind-3 (a) without crossties or dampers, (b) without crossties and with dampers, (c) with crossties and without dampers, and (d) with crossties and dampers. The x-axis shows time ranging from 0 to 300 s, and the y-axis shows energy ranging from 0 to 369 ft-lbf (0 to 500 J). The potential energy is represented by a green line, the kinetic energy by a red line, the energy dissipation via cable’s inherent damping by a blue line, and the energy dissipation via external damper by a yellow line. For all four plots, potential and kinetic energy fluctuate rapidly with time, and energy dissipation gradually accumulates over time. Among the four strategies studied, a system with crossties only and a system with dampers and crossties provide almost the same degree of best mitigation effectiveness. Both potential and kinetic energies are lowest in these two cases. Largest energy dissipation via cables’ inherent damping occurs when the system does not have dampers or crossties and reaches about 258 ft-lbf (350 J) over a period of 300 s. Largest energy dissipation via external dampers occurs when the system has dampers only and reaches about 199 ft-lbf (270 J) over a period of 300 s.
Figure 141 . Graph. Energy evolution of the cable system under wind-3 (a) without crossties or dampers, (b) without crossties and with dampers, (c) with crossties and without dampers, and (d) with crossties and dampers.
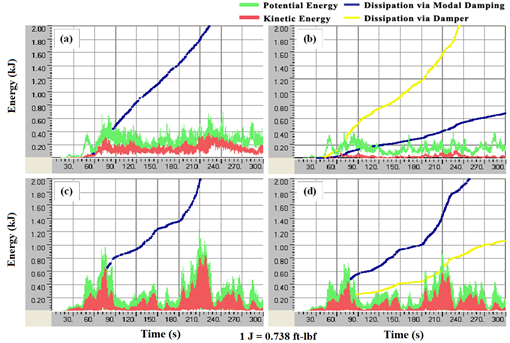
This graph shows the evolution of mechanical energies of a stay cable system subjected to wind-hf (a) without crossties or dampers, (b) without crossties and with dampers, (c) with crossties and without dampers, and (d) with crossties and dampers. The x-axis shows time ranging from 0 to 300 s, and the y-axis shows energy ranging from 0 to 1,480 ft-lbf (0 to 2.0 kJ). The potential energy is represented by a green line, the kinetic energy by a red line, the energy dissipation via cable’s inherent damping by a blue line, and the energy dissipation via external damper by a yellow line. For all four plots, potential and kinetic energy fluctuate rapidly with time, and energy dissipation gradually accumulates over time. Among the four strategies studied, a system with dampers only provides best mitigation effectiveness. Both potential and kinetic energies are lowest in this case. Largest energy dissipation via cables’ inherent damping occurs when the system does not have dampers or crossties and reaches about 1,480 ft-lbf (2.0 kJ) over a period of 220 s. Largest energy dissipation via external dampers occurs when the system has dampers only and reaches about 1,480 ft-lbf (2.0 kJ) over a period of 235 s.
Figure 142 . Graph. Energy evolution of the cable system under wind-hf (a) without crossties or dampers, (b) without crossties and with dampers, (c) with crossties and without dampers, and (d) with crossties and dampers.

STAY CABLE SYSTEMS WITH DAMPERS AT CROSSTIE ANCHORAGES

Performance of Stay Cable Systems with a Single Damper

A major drawback of dampers on stay cables is the limited damping effects due to the close proximity of dampers to the anchorages. As the offset distance from the anchorage increases, the modal damping ratio due to the damper increases. However, practical constraints of installation do not allow a large offset distance. An alternative strategy of adding dampers to a networked stay system was explored. It involved installing dampers at crosstie connections to the deck, which potentially provided large damping ratios that were not achievable otherwise by the dampers on stay cables installed near the anchorages.

Figure 143 shows a stay cable system with crossties and a damper attached to a crosstie anchorage. A spring element, with stiffness coefficient (k), was added in order to provide the retracting force necessary to restore the damper piston back to its original position after displacement. Crossties are a tension element and thus cannot push the damper piston back to its original neutral position. The resulting damper/spring assembly constitutes a simplest form of a viscoelastic unit, often called the Voigt model.(16)
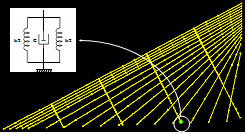
This image shows a finite element model of a stay cable system of the Bill Emerson Memorial Bridge augmented with crossties and a damper. Four parallel lines of crossties form a cable network, and a single viscous damper is installed at the crosstie anchorage to the deck.
Figure 143 . Image. Stay cable system with crossties and a damper attached to a crosstie.

The energy evolution profiles of the system depicted in figure 143 subjected to wind-1 are shown in figure 144 for four different combinations of C and k values: no damper used, = 686 kip/ft (10,000 kN/m) and = 686 kip-s/ft (10,000 kN-s/m), = 68.6 kip/ft (1,000 kN/m) and = 68.6 kip-s/ft (1,000 kN-s/m), and = 686 kip/ft (10,000 kN/m) and C = 68.6 kip-s/ft (1,000 kN-s/m). As expected, the effectiveness of mitigation significantly increased. This signifies a dramatic improvement over the previous strategy of attaching dampers to stay cables. Note that only a single damper was used. Among the four different cases tested,= 68.6 kip/ft (1,000 kN/m) and = 68.6 kip-s/ft (1,000 kN-s/m) results in lowest kinetic and potential energy as well as lowest modal dissipation and highest damper dissipation. Determination of an optimal combination of C and k values does not appear to be straight-forward and requires further research.
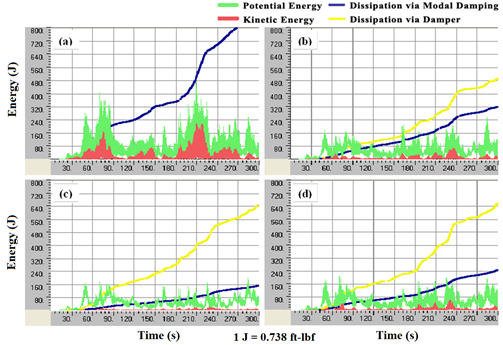
This graph shows the evolution of mechanical energies of a stay cable system augmented with four parallel lines of crossties and a single viscous damper attached at the crosstie anchorage to the deck (a) when no damper was used, (b) with a spring constant (k) of 686 kip/ft (10,000 kN/m) and a damper constant (C) = 686 kip-s/ft (10,000 kN-s/m), (c) k = 68.6 kip/ft (1,000 kN/m) and C = 68.6 kip-s/ft (1,000 kN-s/m) and (d) k = 686 kip/ft (10,000 kN/m) and C = 68.6 kip-s/ft (1,000 kN-s/m). The system is subjected to the reference wind profile. The x-axis shows time ranging from 0 to 300 s, and the y-axis shows energy ranging from 0 to 590 ft-lbf (0 to 800 J). The potential energy is represented by a green line, the kinetic energy by a red line, the energy dissipation via cable’s inherent damping by a blue line, and the energy dissipation via external damper by a yellow line. For all plots, potential and kinetic energy fluctuate rapidly with time, and energy dissipation gradually accumulates over time. Among the four strategies studied, the case of k of 68.6 kip/ft (1,000 kN/m) and C of 68.6 kip-s/ft (1,000 kN-s/m) provides best mitigation effectiveness. Both potential and kinetic energies are lowest in this case. Largest energy dissipation via cables’ inherent damping occurs when the system has zero k and zero C and reaches about 590 ft-lbf (800 J) over a period of 267 s. Largest energy dissipation via external dampers occurs in the case of k of 68.6 kip/ft (1,000 kN/m) and C of 68.6 kip-s/ft (1,000 kN-s/m) and also in the case of k of 686 kip/ft (10,000 kN/m) and C of 68.6 kip-s/ft (1,000 kN-s/m). The energy dissipation via dampers in these two cases reaches about 472 ft-lbf (640 J) over a period of 300 s.
Figure 144 . Graph. Energy evolution of the cable system shown in figure 143 (a) when no damper was used, (b) k = 686 kip/ft (10,000 kN/m) and C = 686 kip-s/ft (10,000 kN-s/m), (c) k = 68.6 kip/ft (1,000 kN/m) and C = 68.6 kip-s/ft (1,000 kN-s/m), and (d) k = 686 kip/ft (10,000 kN/m) and C = 68.6 kip-s/ft (1,000 kN-s/m).

Performance of Stay Cable Systems with Multiple Dampers

Multiple dampers attached to crosstie anchorages, as depicted in figure 145, were also investigated. Figure 146 shows the results for the four different combinations of C and k values. For simplicity, all four dampers have the same C and k values. Use of multiple dampers certainly mitigates stay vibrations even more effectively than a single damper.
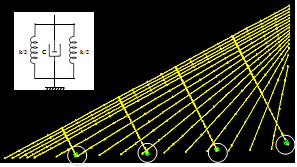
This image shows a finite element model of a stay cable system of the Bill Emerson Memorial Bridge augmented with crossties and dampers. Four parallel lines of crossties form a cable network and a total of four viscous dampers are installed at the crosstie anchorages to the deck.
Figure 145 . Image. Stay cable system with crossties and four dampers attached to crosstie anchorages.
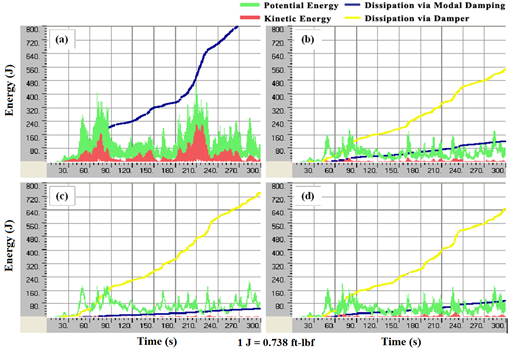
This graph shows the evolution of mechanical energies of a stay cable system augmented with four parallel lines of crossties and four viscous dampers attached at the crosstie anchorages to the deck when (a) no damper was used, (b) spring constant (k) = 686 kip/ft (10,000 kN/m) and damper constant (C) = 686 kip-s/ft (10,000 kN-s/m), (c) k = 68.6 kip/ft (1,000 kN/m) and C = 68.6 kip-s/ft (1,000 kN-s/m), and (d) k = 686 kip/ft (10,000 kN/m) and C = 68.6 kip-s/ft (1,000 kN-s/m). The system is subjected to the reference wind profile. The x-axis shows time ranging from 0 to 300 s, and the y-axis shows energy ranging from 0 to 590 ft-lbf (0 to 800 J). The potential energy is represented by a green line, the kinetic energy by a red line, the energy dissipation via cable’s inherent damping by a blue line, and the energy dissipation via external damper by a yellow line. For all four plots, potential and kinetic energy fluctuate rapidly with time, and energy dissipation gradually accumulates over time. Among the four strategies studied, the case of a k of 68.6 kip/ft (1,000 kN/m) and a C of 68.6 kip-s/ft (1,000 kN-s/m) provides the best mitigation effectiveness. Both potential and kinetic energies are lowest in this case. Largest energy dissipation via cables’ inherent damping occurs when the system has zero k and zero C and reaches about 590 ft-lbf (800 J) over a period of 267 s. Largest energy dissipation via external dampers occurs in the case of k of 68.6 kip/s (1,000 kN/m) and C of 68.6 kip-s/ft (1,000 kN-s/m) and reaches about 554 ft lbf (750 J) over a period of 300 s.
Figure 146 . Graph. Energy evolution of the cable system shown in figure 145 when (a) no damper was used, (b) k = 686 kip/ft (10,000 kN/m) and C = 686 kip-s/ft (10,000 kN-s/m),(c) k = 68.6 kip/ft (1,000 kN/m) and C = 68.6 kip-s/ft (1,000 kN-s/m), and (d) k = 686 kip/ft (10,000 kN/m) and C = 68.6 kip-s/ft (1,000 kN-s/m).

COMPARISON OF DIFFERENT MITIGATION STRATEGIES

Figure 147 shows stay cable systems with four different mitigation strategies: crossties only, dampers only, crossties and dampers on stay cables, and crossties and dampers at crosstie anchorages. Resulting displacement profiles and energy evolutions for these cases under wind-1 are given in figure 148 through figure 150. Among the four strategies considered, the one with dampers at crosstie anchorages provides the most efficient vibration control. Further research is warranted to delineate detailed design issues of the newly identified strategy of crosstying stay cables and adding dampers at the crosstie anchorages.
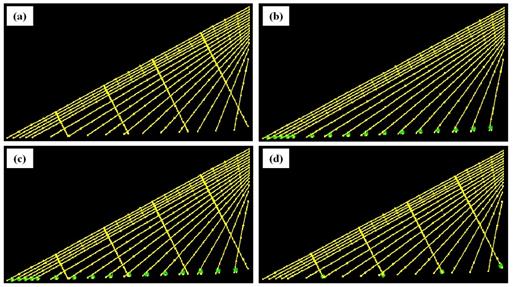
This image shows finite element models of a stay cable system of the Bill Emerson Memorial Bridge (a) with crossties and without dampers, (b) without crossties and with dampers, (c) with crossties and dampers on stay cables, and (d) with crossties and dampers at crosstie anchorages. The upper left diagram shows four parallel and equally spaced lines of crossties on the cables, while the upper right diagram shows each cable with a viscous damper installed near its deck anchorage.  The lower left diagram shows the cables with four parallel lines of equally spaced crossties as well as a viscous damper at each cable deck anchorage, while the lower right diagram shows the cables with four lines of equally spaced crossties and a viscous damper at the deck anchorage of each crosstie line.
Figure 147 . Image. Stay cable system (a) with crossties and without dampers, (b) without crossties and with dampers, (c) with crossties and dampers on stay cables, and (d) with crossties and dampers at crosstie anchorages.
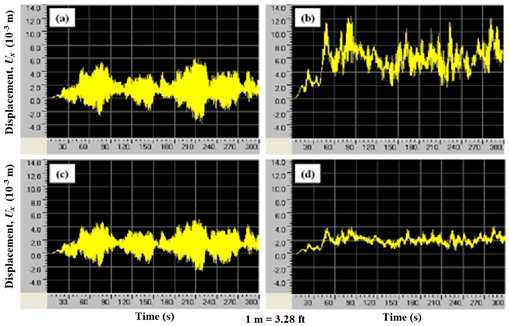
This graph shows displacement profiles at the mid-span of the longest cable in a stay cable system (a) with crossties and without dampers, (b) without crossties and with dampers, (c) with crossties and dampers on stay cables, and (d) with crossties and dampers at crosstie anchorages. The displacement is the horizontal component parallel to the bridge axis, and the cable system is subjected to the reference wind profile. The x-axis shows time ranging from 0 to 300 s, and the y-axis shows displacement ranging from -1.97×10⁻² to 4.59×10⁻² ft (-6.0×10⁻³ to 14.0×10⁻³ m). The displacements fluctuate rapidly with time. Among the four strategies, a system with crossties and dampers installed at crosstie anchorages to the deck provides the best mitigation effectiveness. The displacement fluctuates approximately between 0 and 1.3×10⁻² ft (0 and 4.0×10⁻³ m).
Figure 148 . Graph. Displacement profile computed at mid-span of the longest cable (a) with crossties and without dampers, (b) without crossties and with dampers, (c) with crossties and dampers on stay cables, and (d) with crossties and dampers at crosstie anchorages.
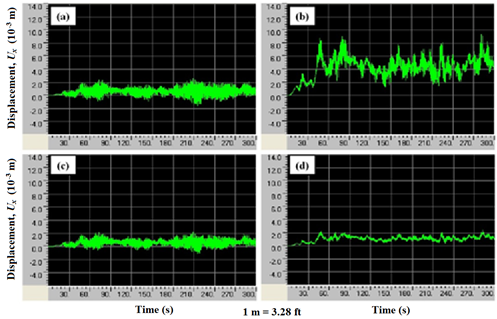
This graph shows a displacement profile at the quarter-pan of the longest cable in a stay cable system (a) with crossties and without dampers, (b) without crossties and with dampers, (c) with crossties and dampers on stay cables, and (d) with crossties and dampers at crosstie anchorages. The displacement shown is the horizontal component parallel to the bridge axis, and the cable system is subjected to the reference wind profile. The x-axis shows time ranging from 0 to 300 s, and the y-axis shows displacement ranging from -1.97×10⁻² to 4.59×10⁻² ft (-6.0×10⁻³ to 14.0×10⁻³ m). The displacements fluctuate rapidly with time. Among the four strategies, a system with crossties and dampers installed at crosstie anchorages to the deck provides the best mitigation effectiveness. Displacements fluctuate approximately between 0 and 7.22×10⁻³ ft (0 and 2.2×10⁻³ m).
Figure 149 . Graph. Displacement profile computed at quarter-span of the longest cable (a) with crossties and without dampers, (b) without crossties and with dampers, (c) with crossties and dampers on stay cables, and (d) with crossties and dampers at crosstie anchorages.
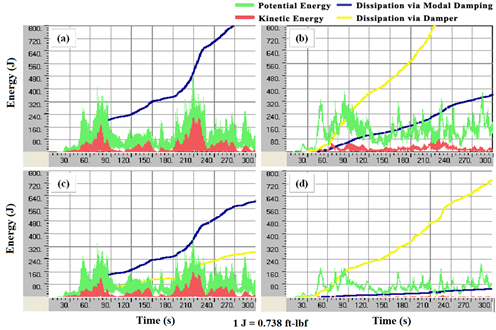
This graph shows the evolution of mechanical energies of a stay cable system (a) with crossties and without dampers, (b) without crossties and with dampers, (c) with crossties and dampers on stay cables, and (d) with crossties and dampers at crosstie anchorages. The system is subjected to the reference wind profile. The x-axis shows time ranging from 0 to 300 s, and the y-axis shows energy ranging from 0 to 590 ft-lbf (0 to 800 J). The potential energy is represented by a green line, the kinetic energy by a red line, the energy dissipation via cable’s inherent damping by a blue line, and the energy dissipation via external damper by a yellow line. For all four plots, potential and kinetic energy fluctuate rapidly with time, and energy dissipation gradually accumulates over time. Among the four strategies studied, a system with crossties and dampers installed at crosstie anchorages to the deck mitigates wind-induced cable vibrations most effectively. Both potential and kinetic energies are lowest under this strategy. Largest energy dissipation via cables’ inherent damping occurs when the system is equipped with crossties only and reaches about 590 ft-lbf (800 J) over a period of 267 s. Largest energy dissipation via external dampers occurs in the case of dampers only and reaches about 590 ft-lbf (800 J) over a period of 220 s.
Figure 150 . Graph. Energy evolution of a cable system (a) with crossties and without dampers, (b) without crossties and with dampers, (c) with crossties and dampers on stay cables, and (d) with crossties and dampers at crosstie anchorages.