This section addresses elements applicable to two of the Implementation Options listed in Section 1.1.
Section 2.1 provides a brief review of the vehicle noise emission data base in the FHWA TNM (Reference Energy Mean Emission Levels or REMELs [Fleming 1995]). Section 2.2 then describes investigations using REMELs currently in the FHWA TNM to assess Implementation Option 3: adjusting the predicted sound levels (post FHWA TNM calculations). Next, Section 2.3 describes the investigation of using pavement-specific noise emission levels, to help assess Implementation Option 1: integrating new REMEL data into the FHWA TNM for specific pavement types and also adjusting the roadway effective flow resistivity (EFR, a measure of sound absorption).
Section 2.4 describes steps to assess the adequacy of a pavement-specific data set. This is followed by Section 2.5, where implementation recommendations are made.
The FHWA TNM uses Reference Energy Mean Emission Levels or REMELs [Fleming 1995] as the foundation of its source sound level computations. TNM has REMEL data for two vehicle operating conditions: cruise and full-throttle; and five standard vehicle types: automobiles, medium trucks, heavy trucks, buses, and motorcycles. TNM also has the ability to accept limited REMEL data for user-defined vehicle types. FHWA TNM v2.5 (the current version of the model as of the date of this report) and all previous versions include vehicle noise emission levels for three pavement types, listed in order from loudest to quietest: Portland Cement Concrete (PCC), Dense-Graded Asphaltic Concrete (DGAC), and Open-Graded Asphaltic Concrete (OGAC). Each of these is an average for a broad pavement category, and it is recognized that there can be substantial sound level variation within each category and overlap among categories. For highway projects receiving federal aid, it is required that highway noise impact analyses be conducted using "Average" pavement, which is an average of the DGAC and PCC vehicle noise emission levels, except under a special program with FHWA.2
The REMEL database was calculated from approximately 6000 measured individual vehicle pass-by events, where maximum sound levels were extracted for each at a distance of 50 feet (15.2 meters) from the center of the vehicle travel lane and a height of 5 feet (1.5 meters) above the roadway plane. A regression analysis was applied to determine equation coefficients for input to the FHWA TNM, where the coefficients are dependent on the following: vehicle type (automobile, medium truck, heavy truck, bus, motorcycle), operating condition (cruise or full throttle), and pavement type (PCC, DGAC, OGAC, Average).
Using two of the general pavement types currently in the FHWA TNM (PCC and OGAC), an investigation was conducted to help determine the validity of Implementation Option 3 (see Section 1.1). Options 1 and 2 require that the source sound levels are adjusted to include effects of specific pavements, and Option 3 requires that the received sound levels are adjusted to include the effects of specific pavements. With a single adjustment value applied per pavement type, Option 3 could only be considered valid if the pavement effects were not dependent on distance from the roadway. A study was conducted with the general pavement categories available in FHWA TNM v2.5 to determine if pavement effects are distance-dependent.
Using FHWA TNM v2.5, a one-lane roadway with mixed traffic was modeled, with receivers placed 50-1600 feet (15-488 meters) from the center of the roadway lane. The following parameters were also examined:
Predicted sound levels were calculated on broadband and 1/3-octave band bases.
Figures 1-3 show results from this investigation. Figure 1 shows predicted sound levels as a function of distance for the flat site without a noise barrier, for louder and quieter pavement and for acoustically hard and soft ground. Figure 2 shows the predicted noise reductions (louder pavement minus quieter pavement) as a function of distance, for a flat site with acoustically hard and soft ground, a barrier site, a site with an elevated road, and a site with a depressed road. Figures 1 and 2 indicate that, in general, for a flat site, over acoustically soft ground, the difference between louder and quieter pavement decreases with increasing distance and eventually diminishes altogether. For hard ground, there is a similar effect, although the difference between louder and quieter pavement decreases less rapidly than for soft ground.

Figure 1. TNM-predicted sound pressure levels (LAeq1h) as a function of distance ? flat site, no noise barrier. Variables: louder and quieter pavement, acoustically hard and soft ground.

Figure 2. TNM-predicted noise reductions (LAeq1h for louder pavement minus quieter pavement) as a function of distance. Variables: flat site (with acoustically hard and soft ground), barrier site, elevated road, depressed road.
The spectral data results shown in Figure 3 help to explain the broadband level results seen in Figures 1 and 2. Figure 3 shows predicted 1/3 octave band sound levels as a function of distance for the flat site without a noise barrier and acoustically soft ground, for three distances (50, 500, and 1000 feet or 15, 152, and 305 meters) and for louder and quieter pavement. It can be seen that the spectral differences between the louder and quieter pavements occur in the 1/3-octave bands of 500 Hz and up; the sound levels are essentially the same for the lower frequencies. As the sound propagates, higher frequency energy dissipates more rapidly than lower frequency energy from the effects of propagation. At 50 feet (15 m), the dominant frequency range from 500 to 3150 Hz controls the broadband sound level. Out at 1000 feet (305 m), the frequency range of 80 to 250 Hz is contributing the most to the broadband sound level, with the range of 630 to 3150 Hz also contributing. As distance increases, lower frequencies become more dominant. Since there is little to no difference in sound levels between pavement types in the lower frequency range, noise reduction due to the quieter pavement diminishes over distance.

Figure 3. TNM-predicted sound pressure spectral levels (LAeq1h) ? flat site, no noise barrier, acoustically soft ground. Variables: distance, louder and quieter pavement.
Referring back to Figure 2, as with the flat site, the barrier, elevated road, and depressed road sites also show the trend of decreased noise reduction with increasing distance. In addition, the sites that involve the most line-of-sight blockage between the sound source and receiver, barrier and depressed road sites, show less noise reduction than the other sites in general. Again, this can be attributed to a reduction in higher frequency energy; the noise barrier and the terrain in the depressed road case efficiently reduce higher frequency energy, resulting in lower frequencies becoming dominant at shorter distances than for cases without intervening objects. Again, louder and quieter pavements are essentially the same for lower frequencies, so the noise reduction is not as much as it could be without the intervening object.
The results found in this FHWA TNM investigation were supported by data measured as part of the Arizona Quiet Pavement Pilot Program [ADOT QPPP]. Data collected simultaneously near the highway and at various distances from the highway, for louder and quieter pavements, provide results indicating that there is a greater effect of pavement on noise levels closer to the highway as compared to farther from the highway.
Based on all the results, it was determined that the effect of pavement on noise levels is distance dependent and site dependent (including ground type, intervening objects, and site geometry). These parameters affect the noise reduction due to the pavement. In general, a greater effect due to the pavement is seen closer to the roadway and with no intervening objects (nothing to block the sound between the source and receiver).
The results of this investigation indicate that Implementation Option 3, accounting for pavement effects by application of an adjustment at receivers (post FHWA TNM calculations), is not a valid option, since the effects vary by distance and site parameters. Accounting for pavement effects at the source allows the FHWA TNM to properly account for propagation effects between the source and receiver, which requires Implementation Options 1 or 2.
Note: Tables of values for the data presented in Figures 1-3 can be found in Appendix A.
For this demonstration, which was conducted as a proof-of-concept test, four pavement types were chosen: 1) open-graded rubberized asphalt (RACO); 2) dense-graded asphalt (DGAC); 3) Portland cement concrete (PCC) longitudinally tined; and 4) PCC transversely tined. Tire/pavement noise studies have shown that these four pavements represent a very broad range of noise levels, listed above from quietest to loudest, as measured at the tire/pavement interface and adjacent to the highway [Rochat 2003][Donavan 2006]. Although there are both loud and quiet PCC and asphalt pavements, the ones listed allow for use of existing and available validation data sets, and were thus chosen. It is recognized that these pavement types are still fairly general, but they are different enough to determine the validity for this option of implementing pavement effects.
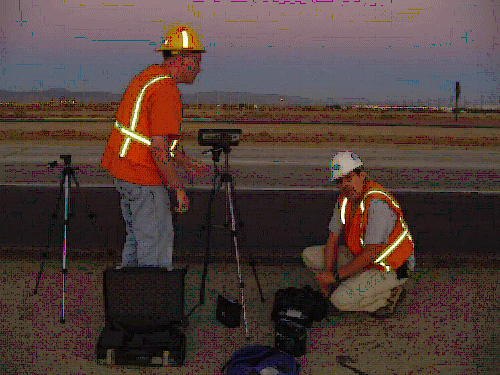
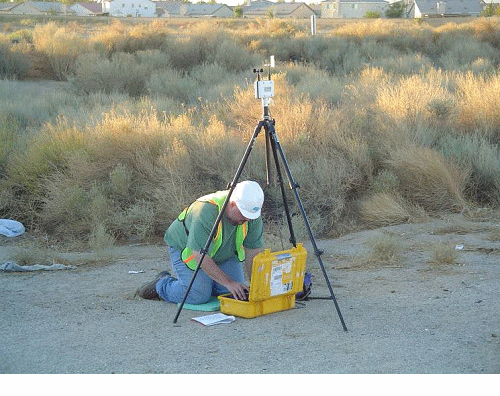
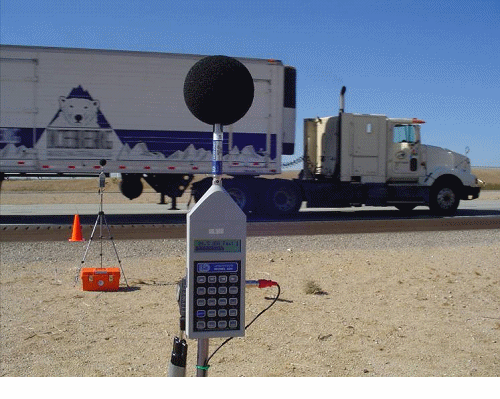
For this demonstration, data were collected in conformance with the REMEL method, as described in Fleming 1995 and Lee 1996 (please refer to Figure 4). A microphone was placed at a distance of 50 ft (15.2 m) from the center of the vehicle travel lane and a height of 5 ft (1.5 m) above the roadway plane. The acoustic signals for each pass-by event were recorded and used to extract the A-weighted maximum sound level (broadband and spectral). Measurements were conducted in Massachusetts in August 2006 for DGAC, in California in October 2003 (as part of the Caltrans Thin Lift Study) and in Arizona in October 2007 for RACO, and in California in September 2007 for longitudinally tined PCC. In addition, data were obtained from Ohio DOT for transversely tined PCC.
These data were collected to assess the regression analysis process with pavement-specific REMELs and to implement the REMELs in a special research version of TNM modified to allow for such predictions.


Figure 4. Photos of REMEL measurements
All vehicle pass-by events used for final analysis were of high quality, with minimal wind influence and minimal influence from nearby vehicles or other noise sources. The wind speed did not exceed 11.2 mph (5 m/s) during any event. The maximum pass-by sound level was at least 10 decibel (dB) above any background noise (all sources other than vehicles on the road) and was approximately 10 dB louder than any other simultaneous vehicle noise sources (event max level was at least 6 dB higher than the beginning or end of the vehicle pass-by event, which typically equates to approximately 10 dB at the time of the maximum level).
The data were then processed according to REMEL analysis techniques, as described in Appendix B. It was during this analysis process that several questions arose regarding determining data set adequacy (e.g.: Were there enough events for each vehicle type? Does a regression technique properly capture pavements associated with tonal tire/pavement noise?) These questions are addressed in Section 2.4.
A special research version of TNM v2.5 was developed that allows the use of pavement-specific REMELs. This was accomplished by adding a new pavement type to the REMEL database, and choosing it as an input for roadway pavement type.
Once data set adequacy is determined, as described in Section 2.4, predictions will be made with pavement-specific REMELs and compared to measured data as described in Section 3.2. Some preliminary work has been done for this, but final results are not available.
There can be substantial limitations regarding the implementation of pavement-specific REMELs. Because of the broad pavement categories in the current version of the FHWA TNM, the REMEL calculation method was appropriate for such large data sets. Broader pavement categories are more likely to exhibit the following data set characteristics (as compared to more specific pavements):
REMEL curves may not properly represent the pavement for narrow or specific pavement categories if any of the listed characteristics are not adequately addressed. Please see Section 2.4 for further explanation.
Appendix B contains the following write-up, "Challenges Computing Reference Energy Mean Emission Level Coefficients using Small Datasets." The write-up provides details leading to the following approach for computing REMELs using a small dataset:
A. Overall (Broadband) Levels
B. One-third Octave Band Spectra
Implementation Option 3 is discounted and is not recommended since the effects of pavements on highway noise are distance-dependent. Applying a single value offset to all receivers, regardless of distance from a highway, could lead to an over-prediction of the pavement effect in communities.
Relating to Option 2, the REMEL method of implementing pavement effects is attractive for several reasons: 1) although the data may be somewhat expensive to collect, it can be used directly in the model, replacing more general noise emissions levels with pavement-specific ones; 2) adjusting for pavement effects directly at the source allows for propagation effects to be properly accounted for in noise level predictions adjacent to the highway; and 3) implementation in the FHWA TNM is simple (the structure for REMEL implementation is already available in the model).
Implementation Option 2, with proper care in producing high-quality vehicle pass-by data and by following the steps outlined in Appendix B, would allow utilization of pavement-specific REMELs in the FHWA TNM. The next steps in the analysis for this option would be: