This section describes the investigation of using pavement-specific sound absorption values, which is used to help assess: 1) Implementation Option 1: integrating new REMEL data into the FHWA TNM for specific pavement types and also adjusting the roadway effective flow resistivity (EFR, a measure of sound absorption); and 2) Implementation Option 2: adjusting the existing tire/pavement source level in the FHWA TNM using on-board sound intensity (OBSI) data and also adjusting the roadway EFR.
For Implementation Options 1 and 2, adding an adjustment for the sound absorption of the pavement by changing the EFR value for the road in the FHWA TNM allows for more accurate sound propagation effects as the sound travels between the source and receiver, interacting with the road surface. Implementation in the FHWA TNM is simple.
Section 4.1 briefly describes EFR. Then, before reviewing the validity of applying pavement-specific EFR values, a brief study is described in Section 4.2 that investigates the influence of this parameter on predicted sound levels at distances associated with communities next to highways. The last part of this section reviews the current efforts in EFR data collection for the purpose of FHWA TNM implementation, and finally, implementation recommendations are made.
Effective flow resistivity (EFR) is a measure of sound absorption. The FHWA TNM uses EFR values in ground reflection equations (part of sound propagation), where EFR equals flow resistivity plus other parameters based on ground material (e.g., tortuosity, porosity, and shape of ground surface). The FHWA TNM assumes a semi-infinite half-space (ground properties do not vary with depth). In the FHWA TNM version 2.5, the EFR value applied to roadways is 20000 cgs rayls. Example EFR values from literature are:
Ground material |
EFR value (cgs rayls) |
|---|---|
newly fallen dry snow |
10-30 |
grass |
100-600 |
roadside dirt |
300-800 |
asphalt |
5000-15000 |
old asphalt |
30000 |
upper limit, paint-sealed concrete slab |
105 - 106 |
[Hastings 2010] (in which values in the table were extracted from several sources) As can be seen in the table, there is a very broad range of EFR values for pavements.
Before pursuing further sound absorption research, an investigation was conducted to determine the potential effects of accounting for pavement-specific sound absorption on the predicted sound levels in communities. The investigation was done using a research version of FHWA TNM v2.5 that allows for modification of the roadway EFR value. The following parameters were applied:
The FHWA TNM runs represent actual highways with real highway traffic, where all TNM objects were removed except roadways and receivers, and the ground between the sources and receivers was modified to be either lawn (300 cgs rayls, acoustically soft) or pavement (20000 cgs rayls, acoustically hard).
For the investigation, the EFR values applied to the pavements were 2000, 4000, 6000, 8000, 10000, 12000, 15000, and 20000 cgs rayls. The range of pavement EFR values were chosen based on literature reviews, EFR measurements (as described in the next section), and projections as to what an EFR value could be for a very sound absorbing pavement. It should be noted that it is not known at this time if a value of 2000 cgs rayls is reasonable for a very sound absorbing pavement, but it may be possible given the right pavement parameters.
For the parameters tested (distance from road, number of lanes, hard or soft ground next to the highway), results showed that changing the EFR value affects the sound level predictions in the following ways:
Please refer to Figure 9 for broadband results and Figure 10 for spectral results (tabular format in Appendix A). The results indicate that the effect is not insignificant, and pavement-specific EFR values should be included in predictions. Note, however, that aging pavement will likely decrease its ability to absorb sound, so implemented EFR values should represent pavements at least 5 years old.
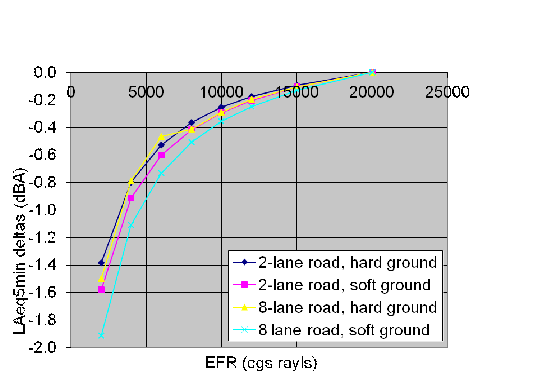
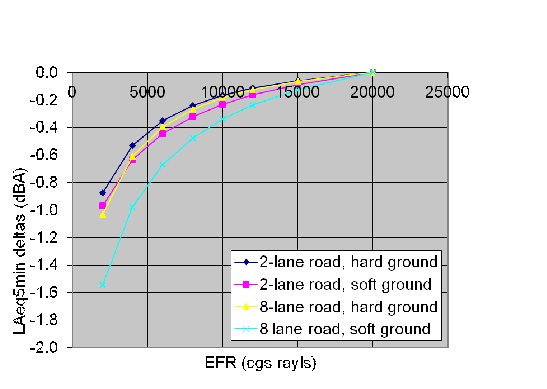
Figure 9. Sound level differences from that for 20K EFR as a function of EFR; 2- and 8-lane road, hard and soft ground. Top plot: distance = 50 ft, bottom plot: distance = 200 ft.
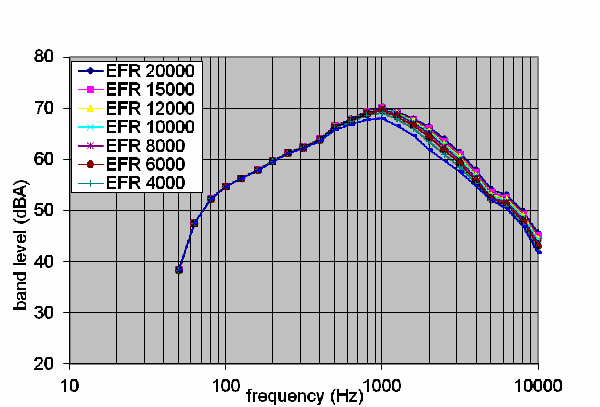
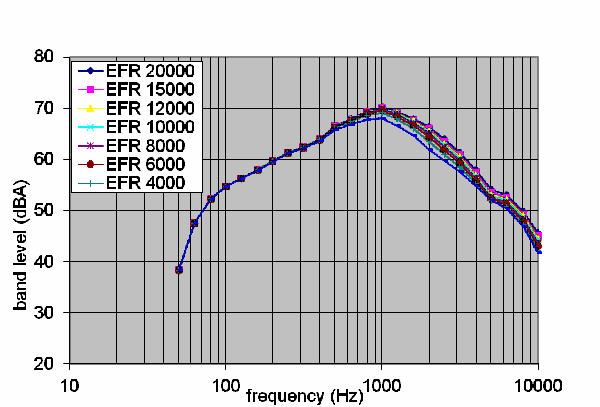
Figure 10. Spectral sound levels with varying EFR values; 8-lane road, soft ground. Top plot: distance = 50 ft, bottom plot: distance = 200 ft.
In order to demonstrate the use of pavement-specific sound absorption values or EFR values in the FHWA TNM it was first necessary to develop or adapt a method for data collection and analysis. With the proper method, it was possible to obtain pavement-specific EFR data. For one of the pavements discussed in Section 3, rubberized asphalt, a demonstration is made of adding the sound absorption effect to the tire/pavement noise source adjustment.
Since the FHWA TNM requires the sound parameter of EFR as input to the propagation equations, a data collection technique was sought that allows measurement/extraction of EFR values for ground. ANSI S1.18, Template Method for Ground Impedance, provided such a technique, and data were collected in conformance with this standard, using "Geometry A" [ANSI S1.18].
The instrumentation set-up consists of a point source (compression driver with tube), and two microphones a set distance away at two different heights above the ground. Using a tone generator, 1/3-octave band center frequencies between 250 and 4000 Hz are transmitted and the difference in sound level between the two microphones is noted for each frequency. Please refer to Figure 11 for photos of the EFR instrumentation and measurements.
Typically, for each pavement type, four samples were collected with the point source tube pointing in different directions for each sample. For each of the 1/3-octave bands, data on roadways were collected with the point source tube pointing in the direction of travel and at 90, 180, and 270 degrees from the direction of travel.
Data were collected for numerous pavements, as listed in Table 2 in Section 4.3.4.
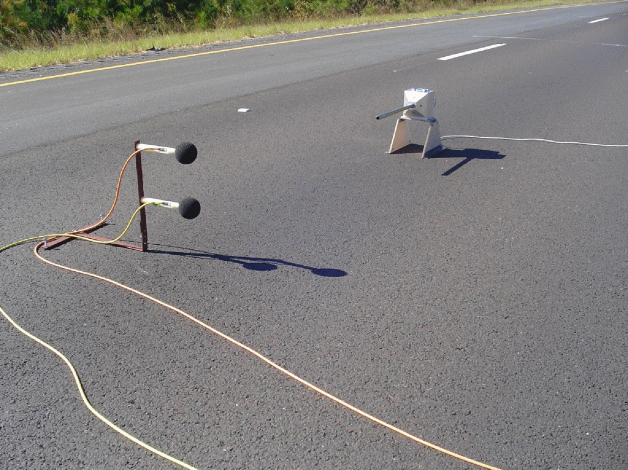
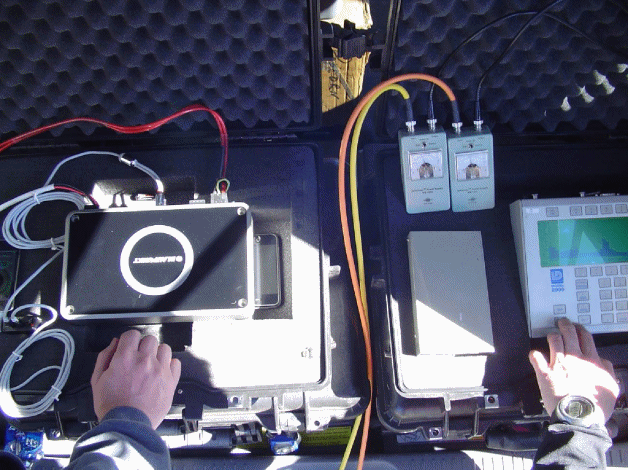
Figure 11. Photos of EFR data collection system.
Data analysis was conducted in general conformance with the ANSI S1.18 standard. There are limitations in using ANSI S1.18 when trying to extract EFR values from 2000 to 30000 cgs rayls from the measured data, the range important when trying to obtain useful sound absorption information for pavements.
The measured delta (difference in sound levels between the two microphones) for each frequency is used to help match measured EFR curves (sound level difference as a function of frequency) to theoretical EFR curves. In ANSI S1.18, the tables of deltas provided for curve matching are limited to the EFR values of 10, 32, 63, 100, 160, 320, 1000, 3200, and 10000 cgs rayls. As such, new theoretical EFR curves were generated to help with matching measured data to theoretical data. The expanded and refined EFR curves cover the range of 10-500 cgs rayls in steps of 10, 500-20000 cgs rayls in steps of 100, and 20000-30000 cgs rayls in steps of 2000. In-house software was developed based on Embleton 1983 sound propagation equations to generate the EFR curves. Figure 12 shows sample theoretical EFR curves in the range of 100 to 30000 cgs rayls, extracted from the new set of theoretical EFR data (tabular format in Appendix A).
The ANSI S1.18 curve matching process was modified to allow for extraction of pavement-related EFR data. ANSI S1.18 uses the following procedure: 1) for each theoretical EFR curve, sum the differences over all frequencies between the measured curve and the EFR curve; and 2) find the minimum sum among all EFR curves to identify an EFR value. It was found through research for the FHWA TNM Pavement Effect Implementation Study that using that process led to counter-intuitive results for pavements. The process seemed to be appropriate for identifying extreme, general ground types (e.g., lawn, pavement), but was inadequate for identifying sensitivities within a general ground type. As such, a different analysis process was developed.

Figure 12. Example theoretical EFR curves. For each EFR value (cgs rayls), the data are presented as the delta sound level between the two microphones (upper minus lower) as a function of frequency.
The data analysis procedure used in this study is a twostep curve selection process:
1. Restrict the EFR range. This step is based on the location in frequency of the first dip and first peak in the measured EFR curve.
Frequency requirement (Hz) |
EFR range (cgs rayls) |
|
|---|---|---|
frequency of first dip < 1000 |
< 900 |
|
frequency of first dip ≥ 1000 |
frequency of first peak < 2000 |
900 ≤ x < 2300 |
frequency of first peak ≥ 2000 |
2300 ≤ x < 30000 |
|
These requirements were chosen based on examination of dips and peaks in the theoretical EFR curves. It was determined that the pavement range is 2300-30000 cgs rayls based on EFR values in literature for pavement and also on data collected for this study, and the frequency at which the first peak occurs for each of the delta curves, which was always 2000 or 2500 Hz for data that were considered to be of good quality.
2. For the pavement range of EFR values, 2300-30000 cgs rayls, the EFR value is then extracted by looking at the amplitude of the peak. (Note: for EFR values below 2300, the process described in ANSI S1.18 can be applied to the restricted EFR range.) First, the amplitude is normalized3, then it is compared to the theoretical peak amplitudes. The theoretical peak amplitude closest in value to the normalized measured peak amplitude is identified, and the corresponding EFR value is assigned to the pavement.
This process results in the most intuitive EFR values possible, based on a large sample of pavement types.
It should be noted that each measured EFR curve was an average of all good data samples for a single pavement type (typically four samples). In addition, the measured peak amplitude was based on the average of peak amplitudes for each sample, regardless of the peak location (2000 or 2500 Hz).
A special research version of the FHWA TNM v2.5 was used to implement pavement sound absorption effects. Rather than the default EFR value of 20000 cgs rayls, a new value could be assigned to all roadways, as specified in a special input file.
To validate the data collection and data analysis process, extracted EFR values were compared to those found in literature for various ground types and also compared to expectations for various pavement types. To validate the implementation of pavement sound absorption effects in the FHWA TNM, one set of measured wayside sound levels were compared to predictions with the EFR modified appropriately for the pavement.
Regarding validating the data collection and analysis process, various ground types were examined, where measured EFR values for lawn ranged from 100 to 470 cgs rayls, and a measured EFR value for medium-packed dirt was 2300 cgs rayls. Also, Table 2 lists all pavements where data were collected and each corresponding extracted EFR value. It can be seen in the table that the EFR values range from 7200 up to 30000 cgs rayls. Also, most open-graded or porous pavements have EFR values in the lower half of the range. For the last three entries in the table, the EFR values could not be extracted, since these pavements were porous enough and thin enough to allow reflections from the underlying pavements, which contaminate the EFR results (please refer to Section 4.3.5 for further explanation) (Note: had the pavements been thick enough to not allow reflections from the underlying pavements, it’s likely that analysis would have shown that their associated EFR values would be below 7000). In summary, regarding validating the data collection and analysis process, the values for all the ground types either compared well with published EFR values or represented intuitive or reasonable results.
Pavement type |
Age (years) |
Reported maximum aggregate size (mm) |
Reported % air void |
Reported Thickness (mm) |
Measured EFR value (cgs rayls) |
|---|---|---|---|---|---|
old DGAC |
|
|
|
|
30000 |
NCAT N4 Superpave |
|
9.5 |
5.5 |
|
30000 |
NCAT W6 Superpave ARZ |
|
4.75 |
4 |
|
24000 |
ARFC (AZ QPPP Site 3D) |
6.5 |
9.5 |
|
|
24000 |
cement concrete sidewalk |
|
|
|
|
20000 |
NCAT N8 SMA |
|
19 |
4.7 |
|
20000 |
NCAT N12 SMA |
|
12.5 |
4 |
|
17600 |
NCAT W8 OGFC |
|
9.5 |
|
|
17100 |
BWC (LA138 Site 5) |
new |
12.5 |
7 |
|
16900 |
NCAT E5 Super dense |
|
12.5 |
3.2 |
|
15400 |
NCAT W5 Super dense |
|
12.5 |
1.7 |
|
13400 |
ARFC (AZ QPPP Site 3C) |
5.5 |
9.5 |
|
|
13200 |
NCAT S1 SMA |
|
12.5 |
2 |
|
12400 |
DGAC (LA138 Site 1) |
new |
12.5 |
9 |
|
12200 |
ARFC (AZ QPPP Site 3A) |
4 |
9.5 |
|
|
12000 |
ARFC (AZ QPPP Site 3E) |
6.5 |
9.5 |
|
|
11700 |
cement concrete parking lot, swirl texture |
|
|
|
|
11100 |
DGAC parking lot |
old |
|
|
|
10400 |
ARFC (AZ QPPP Site 3C) |
6 |
9.5 |
|
|
10300 |
ARFC new (Warner on-ramp) |
new |
|
|
|
10300 |
NCAT N5 Super fine |
|
9.5 |
3.7 |
|
10200 |
NCAT S4 OGFC |
|
12.5 |
|
33 |
10200 |
DGAC parking lot |
old |
|
|
|
10000 |
OGAC 30mm (LA138 Site 3) |
new |
12.5 |
15 |
30 |
9800 |
NCAT N13 twin layer OGFC |
|
9.5 |
24 |
16/32 |
8000 |
ARFC (AZ QPPP Site 3B) |
2.5 |
9.5 |
17 |
25 |
7600 |
RAC, Type O (LA138 Site 4) |
new |
12.5 |
12 |
30 |
7400 |
OGAC 75mm (LA138 Site 2) |
new |
12.5 |
12 |
75 |
7200 |
NCAT N2 PFC |
|
12.5 |
16.8 |
18 |
na |
NCAT S3 OGFC |
|
9.5 |
21.8 |
33 |
na |
NCAT S8 PFC |
|
12.5 |
16.8 |
33 |
na |
Dense-graded asphalts: DGAC, SMA, Super dense, Super fine
Open-graded or porous asphalts: OGAC, OGFC, PFC, RAC (rubberized), ARFC (rubberized)
Other: BWC = bonded wearing course
Regarding validating the implementation of pavement sound absorption effects in the FHWA TNM, an example is discussed here for open-graded rubberized asphalt (RAC) (Please refer to the RAC data shown in Figure 6 in Section 3.) Adding an EFR adjustment to the OBSI adjustment (with an EFR value of ~7000 cgs rayls), the broadband results (predicted compared to measured) are improved up to about 0.5 dB; this is for two different highway configurations, one a 6-lane highway, and one an 8-lane highway. The only distance from the highway examined was 50 ft (15.2 m), and it was not investigated yet as to how the results would have improved at farther distances. Figure 13 shows an example of the spectral results with the EFR adjustment added to the OBSI adjustment (tabular format in Appendix A). It can be seen that predicted sound levels slightly improve in the range of about 1250 to 2500 Hz, when accounting for the pavement-specific sound absorption.

Figure 13. TNM-predictions compared to measured highway noise data, applying TNM Average pavement and TNM OBSI-adjusted and EFR-adjusted pavement; spectral sound levels.
The example above shows that for real highway cases, some improvement can be seen when accounting for the pavement sound absorption effect in predictions. The improvements are very slight in the example, but since it’s possible to achieve greater improvement for other cases, it was determined that the EFR value should be accounted for in the predictions and that the EFR data collection and analysis process is a valid way to collect the EFR data for implementation.
The one limitation found with the implementation of pavement-specific sound absorption in the FHWA TNM lies in the EFR data collection/analysis process for insufficiently thick porous pavements: the process breaks down when the pavement being tested is not seen as semi-infinite (i.e., there is a change in material as a function of depth, which affects the EFR data). Such cases include very porous pavements (please see last three entries in Table 2); when insufficiently thick, sound reflects off the underlying structure (usually a non-porous pavement) affecting the sound levels above the surface of the porous pavement.
Figure 14 shows a typical EFR curve for pavement measurements (tabular format in Appendix A); in this case, the EFR curve has the usual dip-peak-dip shape. Figure 14 also shows data with an atypical shape: dip-peak-peak-dip, where this extra peak is evidence of an underlying structure affecting the measurements. The atypical dip-peak-peak-dip shape was seen for the last three entries in Table 2, each a relatively thin layer of very porous pavement. To verify the cause, an experiment was conducted using a porous rubber mat (similar to a poroelastic road surface); the mat was placed over an acoustically hard ground surface (cement concrete sidewalk) and over an acoustically soft ground surface (lawn). If the underlying structure were to not affect the measurements, then the results should be the same whether the mat was placed on sidewalk or lawn. Such was not the case; the measurements were clearly affected by the underlying structure (please refer to Figure 15, tabular format in Appendix A). Also, the atypical dip-peak-peak-dip shape is evident with the mat over sidewalk, and even over the lawn. The placement (frequency) of the extra peak in each curve is indicative of the EFR value for the underlying structure4, and thus can be attributed to the underlying structure. Note that in these double-peak situations, although the peak location is indicative of the EFR value, the amplitudes of the peaks are assumed to be affected by interactions of both surfaces; thus a precise EFR value cannot be extracted.
Although it may be possible to overcome this limitation with more intricate data collection/processing techniques that include changes of material properties as a function of depth, it was determined that such an effort is out of the scope of the work, considering possible changes that would be required to the FHWA TNM ground reflection equations and that the cost per decibel improvement for such an effort would be high. An educated approximation on how to account for insufficiently thick porous pavements should be sufficient.

Figure 14. Example measured EFR curves, typical and atypical.

Figure 15. EFR curves for rubber mat experiment, both atypical.
Since the investigation showed the potential for up to 2 dB of effect due to pavement sound absorption, and since the demonstration showed that predicted results could be improved by applying pavement-specific EFR values, even if only a small amount for the cases examined, it has been determined that pavement-specific EFR values should be included with Implementation Options 1 and 2.
The logical next steps are to:
Regarding assigning EFR values to pavement types for the implementation in the FHWA TNM, the following are some thoughts on how this could be accomplished:
It should be noted that wayside noise measurements (REMEL), as are applied to Option 1 already include a small amount of pavement sound absorption effect due to propagation over the distance of the nearest travel lane and shoulder in a line perpendicular with the roadway. In most highway configurations, the sound absorption effect would be much greater, with the sound traveling over greater propagation distances over the pavement due to sound sources coming from multiple lanes and angles. Although a small amount of the sound absorption effect would be duplicated when applying a pavement-specific EFR value, the duplication should be small; it is thought that improvements in predicted results by applying a pavement-specific EFR value outweigh any adverse effect from duplication. This needs to be investigated, along with the possibility of correcting for the small amount of duplication.