This section describes the investigation of using pavement-specific tire/pavement source level adjustments, which is used to help assess Implementation Option 2: adjusting the existing tire/pavement source level in the FHWA TNM using on-board sound intensity (OBSI) data and also adjusting the roadway effective flow resistivity (EFR, a measure of sound absorption).
The FHWA TNM noise prediction calculations use two sound sources to represent each vehicle type. One source represents the tire/pavement noise, and the other source represents the remaining vehicle noise (such as the engine, exhaust stack, etc.). With direct measurements of tire/pavement noise, such as with the On-Board Sound Intensity (OBSI) Method [AASHTO OBSI], differences among pavement types can be computed and adjustments made to the tire/pavement noise source in the model to account for these differences.
Section 3.1 describes a proof-of-concept demonstration for implementing pavement effects via tire/pavement source level adjustment. Section 3.2 provides implementation recommendations. Section 3.3 reviews current OBSI data collection for the purpose of FHWA TNM implementation.
For this demonstration, which was conducted as a proof-of-concept test, four pavement types were chosen: 1) open-graded rubberized asphalt (RACO); 2) dense-graded asphalt (DGAC); 3) Portland cement concrete (PCC) longitudinally tined; and 4) PCC transversely tined. Tire pavement noise studies have shown these four pavements to represent a very broad range of noise levels, listed above from quietest to loudest, as measured at the tire/pavement interface and adjacent to the highway [Rochat 2003][Donavan 2006]. Although there are both loud and quiet PCC and asphalt pavements, the ones listed were chosen for this demonstration because they allow for use of existing and available data sets for both source and wayside noise measurements. It is recognized that these pavement types are still fairly general, but they are different enough to determine the validity for this option of implementing pavement effects.
There are several methodologies available to measure tire/pavement interaction source noise. Among them is the On-Board Sound Intensity methodology (OBSI) [AASHTO OBSI]. The OBSI method has been used to compare and rank pavements for several studies in the United States, and there is an adequate amount of data available for the four pavement types listed above. OBSI data were gathered from other practitioners from several studies, including ones for the California Department of Transportation (Caltrans), Arizona Department of Transportation, Iowa State University, and FHWA. Data were collected with the vehicle traveling 60 mph (97 km/h) and were provided on a 1/3-octave band basis, in the range of 500-5000 Hz. Note that these measurements were conducted with the Goodyear Aquatread tire (tire used for the OBSI method prior to the one listed in the current standard) and that results do not include data for the 400 Hz band (prior to the current OBSI standard, the 400 Hz band was not required to be reported).
For each general pavement type (RACO, DGAC, long. tined PCC, trans. tined PCC), data were averaged on a one-third octave band basis; please refer to Figure 5 and Table 1, which show the spectral data for each pavement type, where the order from quietest to loudest is RACO, DGAC, longitudinally tined PCC, transversely tined PCC. Then one-third octave band deltas were calculated between DGAC and each of the other pavement types. These deltas were used to adjust the sound energy in the FHWA TNM vehicle noise database for DGAC (the only pavement type of the four tested that is currently distinguished in the model). Note that Table 1 also shows the number of data points used to calculate the average for each pavement type. Each data point represents a unique section of pavement. Averages were comprised of all data points available to the study, where the population of data points represents a wide variety of highways, studies, and specific pavement parameters; pavement age was not considered as part of this proof-of-concept study.

Figure 5. Plot of average OBSI data for each pavement type used for proof-of-concept study.
Pavement Type |
Number of |
OBSI Level (dBA)1 |
||||||||||||
|---|---|---|---|---|---|---|---|---|---|---|---|---|---|---|
Broad-band |
1/3-Octave Bands |
|||||||||||||
400 |
500 |
630 |
800 |
1000 |
1250 |
1600 |
2000 |
2500 |
3150 |
4000 |
5000 |
|||
RACO |
19 |
97.0 |
NA2 |
86.0 |
88.3 |
91.8 |
90.1 |
86.8 |
86.0 |
82.7 |
79.9 |
77.2 |
75.2 |
72.2 |
DGAC |
10 |
100.5 |
NA2 |
87.1 |
89.8 |
95.4 |
93.7 |
91.5 |
90.1 |
86.6 |
83.5 |
80.6 |
77.7 |
74.6 |
long tine PCC |
29 |
103.3 |
NA2 |
88.0 |
89.2 |
96.8 |
98.7 |
94.5 |
94.6 |
90.5 |
85.5 |
81.7 |
78.9 |
75.2 |
transv tine PCC |
35 |
106.2 |
NA2 |
88.3 |
90.1 |
97.7 |
101.5 |
98.4 |
97.9 |
94.0 |
89.4 |
84.9 |
81.7 |
78.5 |
1Data were collected using the Goodyear Aquatread tire, which is no longer the standard.
2Data for the 400 Hz band was not required or standardized at the time of data collection.
In the FHWA TNM, vehicle noise is represented by two sound sources for each vehicle type, with the lower-height source representing tire/pavement interaction noise. The lower source is isolated in the FHWA TNM, and it is at this point in the calculations that each one-third octave band adjustment due to pavement effects was applied. This was accomplished through a special research version of the FHWA TNM v2.5.
Adjustments for each of the three pavements [RACO, longitudinally tined PCC (LPCC), transversely tined PCC (TPCC)] were applied to account for differences between each of these pavements and DGAC. The vehicle noise emission levels in the FHWA TNM for DGAC were chosen for computations, and adjustments for one of the three pavements were chosen. Using this methodology, FHWA TNM predicted sound levels at chosen receiver locations for either RACO, longitudinally tined PCC, or transversely tined PCC.
After pavement effects were implemented in the FHWA TNM, predicted sound levels were compared to sound levels measured adjacent to a highway in order to assess the validity of implementing pavement effects by applying a tire/pavement noise source adjustment.
Many wayside data sets measured by the Volpe Center were used in this study, including those for the TNM Validation Study [Rochat 2002][Rochat 2004], Arizona Quiet Pavement Pilot Program (QPPP) [ADOT QPPP][ADOT 2006], and Caltrans Thin Lift Study [Caltrans 2010]. The data were measured at a distance of 50 feet (15.3 meters) from the center of the near travel lane, 5 feet (1.5 meters) above the roadway plane or at a distance of a noise barrier, 5 feet (1.5 meters) above the barrier. Data for the TNM Validation Study and the Arizona QPPP will be presented here; the measured free-flowing traffic data are presented in 5-minute A-weighted equivalent sound levels (LAeq5min), obtained in general conformance with the FHWA noise measurement guidance document [Lee 1996] and the Continuous-Flow Traffic Time-Integrated Method [AASHTO CTIM]. Caltrans data were obtained in general conformance with the Statistical Pass-By Method [ISO SPB] and the Statistical Isolated Pass-By Method [AASHTO SIP]; these data will not be presented here – further investigation is necessary to determine the effect of the pavement implementation for single vehicles. All wayside data used for comparison were measured on highways with one of the four chosen pavement types.
Each of the wayside data measurement sites was modeled in the FHWA TNM v2.5, including vehicle volumes and speeds for each travel lane on the highway. Also included were any terrain elevation changes and ground type changes between the source and receiver locations.
Current FHWA policy mandates that FHWA TNM Average pavement must be used in all future noise predictions. To determine if the pavement effect implementation using source adjustments provides improved sound level predictions over using TNM Average, three sets of FHWA TNM calculations were performed: 1) with FHWA TNM v2.5 and Average pavement; 2) with FHWA TNM v2.5 pavement-adjusted using the average OBSI values for the test pavements, as listed in Table 1; and 3) with TNM v2.5 pavement-adjusted using OBSI values more specific to the actual pavement at the validation measurement site.
Results indicate that implementing pavement effects in the FHWA TNM using an OBSI adjustment to the tire/pavement sub-source is a valid way to account for pavement effects.
The broadband results are shown in Figure 6. Each data point represents measured sound levels compared to FHWA TNM-predicted sound levels. It can be seen that the pavement-adjusted results provide improved sound level predictions for all three test pavement types. Where FHWA TNM was substantially over-predicting for RACO, the amount of over-prediction is reduced. Where FHWA TNM was slightly under-predicting for LPCC, the under-prediction is essentially eliminated. Where FHWA TNM was substantially under-predicting for TPCC, the under-prediction is essentially eliminated. For RACO and LPCC, using an adjustment more specific to the pavement at the validation site provides improved results over using the OBSI average adjustment; the use of a more specific pavement adjustment vs. the average adjustment did not make much difference for TPCC in this demonstration.

Figure 6. TNM-predictions compared to measured highway noise data, applying TNM Average pavement and TNM OBSI-adjusted pavement; broadband sound levels.
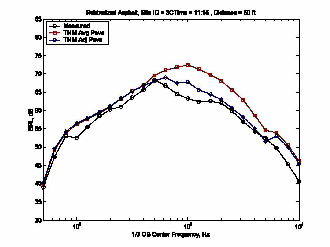
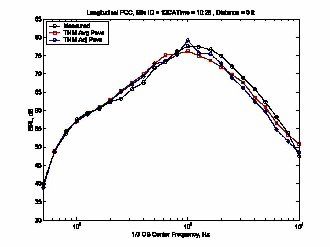
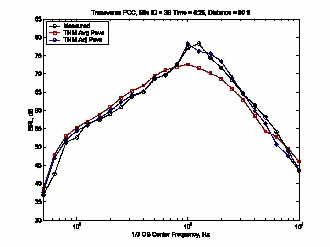
Example spectral results are shown in Figure 7. Results show that pavement-adjusted spectral shapes match more closely to measured spectra.
Figure 7 shows spectral plots of sound levels for measured data, FHWA TNM v2.5 predicted data (with Average pavement), and FHWA TNM pavement-adjusted predicted data using the average OBSI values for the test pavements. For RACO, it can be seen that FHWA TNM v2.5 over-predicts for a broad range of frequencies, including 315-2000 Hz, which are bands critical to the broadband sound level; FHWA TNM pavement-adjusted lowers the sound levels for a broad range, including 500-2000 Hz (the OBSI data sets did not allow for adjustments below 500 Hz), improving the results. It can also be seen for RACO that the range of 630-1600 Hz still shows over-prediction for the FHWA TNM pavement-adjusted data. It is thought that accounting for the following may help eliminate some of the over-prediction: 1) adjust for the appropriate pavement sound absorption in the prediction (see Section 4); and 2) adjust for the pavement effects below 500 Hz (a limit with the older OBSI data). Particularly for RACO, frequencies below 500 Hz may be important when accounting for the effect of this pavement type. The newest OBSI procedure and resulting data includes the 400 Hz 1/3-octave band, and further research is needed to determine the contributions of adjustments made at that frequency.
For PCC longitudinally tined, it can be seen that FHWA TNM under-predicts in the key frequency range of 1000-1600 Hz. FHWA TNM pavement-adjusted raises the sound levels in this range, greatly improving the results, although the results show more tonality than the measured data (spike at 1000 Hz).
For PCC transversely tined, it can be seen that FHWA TNM under-predicts in the key frequency range of 1000-2000 Hz. FHWA TNM pavement-adjusted raises the sound levels in this range, greatly improving the results, although the frequency of the tone is slightly shifted.
Although the results shown in Figure 6 are for single data points at specific sites, the same trends were seen with other data. (Note: Tables of values for the data presented in Figure 5 and Figure 6 can be found in Appendix A.)
 Open-graded rubberized asphalt (RACO)
 PCC, longitudinally tined
 PCC, transversely tined
Figure 7. TNM-predictions compared to measured highway noise data, applying TNM Average pavement and TNM OBSI-adjusted pavement; spectral sound levels.
There are some possible limitations in using OBSI-data-generated adjustments to the tire/pavement noise source to account for pavement effects in noise predictions using the FHWA TNM.
The OBSI source adjustment method of implementing pavement effects is attractive for several reasons: 1) tire/pavement source level data are fairly easy and inexpensive to collect; 2) for some source level measurement methodologies, a large, applicable database of many pavement types already exists; 3) adjusting for pavement effects directly at the source allows for propagation effects to be properly accounted for in noise level predictions adjacent to the highway; and 4) implementation in the FHWA TNM is fairly simple.
Since the demonstration proved to be a valid option for implementing pavement effects by applying adjustments to the tire/pavement noise source, the logical next steps are to:
Section 3.3 discusses gathering and collection of data for a large OBSI adjustment database.
In addition to the OBSI database plan, the vehicle/tire type limitation needs to be addressed. Further investigation is needed on the applicability of the OBSI adjustment to each vehicle type. The investigation should include:
Developing a large OBSI adjustment database, for eventual inclusion in TNM, has already begun, although much more work is required before formal implementation is possible.
To help gather OBSI data and validate data from other sources, the Volpe Center assembled an OBSI system in 2009 (please refer to Figure 8). It has since been tested and compared to other practitioners’ systems. During OBSI system assembly, a list of valuable equipment requirements, pricing, and contacts was generated and made available to other practitioners. During system development and testing, OBSI data collection forms and an OBSI data entry spreadsheet were developed; these also have been made available to other practitioners, where the spreadsheet has become the official depository of OBSI data being collected as part of the transportation pooled fund group on tire/pavement noise [TPF].
In October 2009, the Volpe Center conducted OBSI measurements at the Honda Proving Center in California, where several pavement types were available for testing. The Volpe Center was joined by Illingworth & Rodkin (I&R), who have a validated OBSI system. This set of measurements allowed the Volpe Center to streamline and validate the system by comparisons to I&R.
In November 2009, the Volpe Center conducted OBSI measurements at the National Center for Asphalt Technology (NCAT) test track, where several asphalt pavement types were available for testing. The Volpe Center was again joined by I&R. This set of measurements allowed the Volpe Center to further validate the system and also to collect data for the OBSI database.
In early 2010, it was discussed with FHWA that it was important to get representative tire/pavement noise data from as many states as possible. The target was to get the following information from as many states as possible: list of most prevalent pavements being used in the state and the associated average OBSI level for each pavement, where the pavements tested should be at least 5 years old. In addition to gathering data from other practitioners (see Section 3.3.2) it was determined that the Volpe Center should start to collect State data, when possible, and as long as funding permitted. In the spring of 2010, the Volpe Center collected data in Massachusetts, for their most prevalent pavements. This data set was added to the database.
In September 2010, the Volpe Center participated in an OBSI rodeo in North Carolina, conducted through the transportation pooled fund group on tire/pavement noise [TPF]. OBSI data were collected for many North Carolina pavement types. This set of measurements allowed the Volpe Center to further validate the OBSI system, to validate other practitioners’ systems (so FHWA and the Volpe Center can feel comfortable accepting OBSI data for the national database from these organizations), and to collect data for the OBSI database.
After gathering data from other practitioners (as described in Section 3.3.2), the OBSI database will be analyzed, and it will be determined if there are any gaps to fill. If there are gaps, the Volpe Center or another OBSI practitioner could conduct further measurements to fill in the gaps.
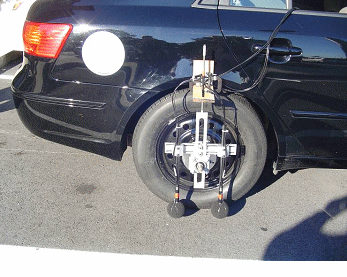
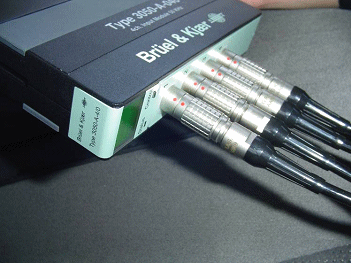

Figure 8. Photos of OBSI data collection system.
In addition to the Volpe Center adding data to the national OBSI database, other practitioners/States are contributing a substantial amount of data through the transportation pooled fund group [TPF]. The database is a top priority of the group, as voted during a July 2011 meeting, and gathering of these data will be ongoing.