While every state highway agency (SHA) has established a policy to identify what constitutes a feasible and reasonable noise barrier design, few have established the methods and procedures to identify the optimum noise barrier design. The acoustical benefits provided by a noise barrier generally increase with increased barrier height, but only up to a point. A point of diminishing returns is met when further increases in barrier height yield little or no increase in acoustical benefit. The optimum noise barrier design is the design that provides the best balance between barrier cost and acoustical benefit. The process used to identify the optimum design is called noise barrier optimization.
Although the FHWA Traffic Noise Model (TNM) includes a Barrier Analysis module to aid in the design of a noise barrier, it lacks a straight-forward method for users to optimize the design. Noise barrier design is a balance among several factors, and for a given situation, TNM users may identify any number of noise barrier designs that meet the SHA's design criteria. The range of possible noise barrier designs extends from those that provide “the minimum acoustical benefit for the minimum cost” to those that provide “the maximum acoustical benefit while still meeting the cost-effectiveness limit.” This range of possible outcomes in the barrier design process often leads to conflicts, especially on some Design-Build projects. The conflicts arise when the SHA and Design-Build team have competing views on what constitutes the optimum design. At other times, conflicts may arise when impacted communities petition the SHA to build a noise barrier that spends the maximum amount available per benefited receptor. However, such a design may not represent the best balance between cost and acoustical benefit. The development of a noise barrier optimization tool will guide SHAs in developing optimum designs, and hopefully lead to resolutions to these types of conflicts.
Prior to designing a noise barrier optimization tool, the study team conducted independent research and received information from many SHAs concerning current policies and practices for noise barrier design and optimization. The information provided by the SHAs helped guide the development of a noise barrier optimization tool.
The noise barrier optimization tool developed in this study allows TNM users to quickly determine the appropriate balance between a low-cost noise barrier design that meets the minimum acoustical requirements and a barrier design that provides the most benefits within the state's cost-effectiveness limit. To a large degree, this balance will be guided by the goals and design objectives contained in each state's noise abatement policy and guidance document. The noise barrier optimization tool presented below will help ensure that all goals and metrics are referenced and presented to the user during the design process. In addition, the noise barrier optimization tool computes an Effectiveness/Cost (E/C) metric for each barrier design, based on the SHA-specific goals and criteria, to help guide the user toward a noise barrier design that provides the desired balance between acoustical benefit and barrier cost. While the E/C metric will prove to be useful for noise barrier optimization, it is still up to TNM users to fully comprehend SHA policies related to the feasibility and reasonableness determination for a noise barrier design.
This report presents the methods for noise barrier design optimization and a Microsoft Excel-based tool that allows users to quickly determine whether feasibility and reasonableness criteria are met. The noise barrier optimization tool also provides an easy side-by-side comparison of alternative noise barrier designs, as well as an E/C metric to help guide the selection of an optimum barrier design among several alternative designs. The noise barrier optimization tool has the flexibility to allow each SHA to enter its state-specific parameters for feasibility requirements, noise abatement design goals, and cost-effectiveness.
The study team surveyed many SHAs for current policies and practices for noise barrier design, and also asked whether and how states optimize noise barrier designs. Eleven SHAs responded to the information request. The respondents represented states with large noise barrier design and construction programs, as well as states with more modest programs. Based on the information received, the study team observed that some SHAs follow an approach whereby they try to minimize barrier height and cost, while still achieving the state's noise reduction design goal (NRDG). Other states attempt to maximize a barrier's height and acoustical benefit while staying within the cost-effectiveness limits. Some such states initially propose noise barrier designs that meet the reasonableness criteria at the SHA's maximum allowable height, and then reduce heights from a maximum based on the public involvement process. In its experience, the study team has observed that some communities are willing to give up some amount of acoustical benefit based on their desire to have a shorter wall height. In contrast, some other SHAs indicated that they start with a minimum-height design that meets the noise reduction goals, and then incrementally increase the barrier height, as long as the design accrues significant acoustical benefits relative to cost. More than one SHA indicated that it attempts to determine the point of diminishing return in a barrier design, where the acoustical benefits cease to accrue with increased barrier heights (and cost), and then selects that design as representing the best balance between cost and benefit.
Finally, other SHAs incorporate different elements into the noise barrier design process. For example, some SHAs indicated that they attempt to develop noise barrier profiles that are smooth and relatively uniform to achieve a more aesthetic design.
For this project, the study team expanded and generalized a spreadsheet-based barrier optimization tool that it customarily uses on TNM-based highway noise barrier design projects. Over the years, the spreadsheet tool had been customized to include the feasibility and reasonableness goals, metrics, and criteria for a modest number of SHAs. For this project, the spreadsheet tool was expanded to accommodate the policies, goals, and cost-effectiveness criteria for SHAs across the country.
To utilize the Noise Barrier Optimization Tool (NBOT) most effectively, the study team recommends that TNM users create noise barriers with a reasonable number of barrier height perturbations, considering the trade-offs between run-time and the objectives of the analysis. Then, using TNM's Barrier Analysis Module, the analyst should step through the barrier design process, by creating one Barrier Analysis for a uniform-height noise barrier at each height perturbation. That is, with the Barrier View window open, the user would select the entire noise barrier and uniformly perturb the barrier heights up, from the minimum barrier height to the maximum height. With the Barrier View window open, the user arranges the Sound-level Results table, the Barrier Segment Descriptions table, and the Barrier Descriptions table in the FHWA TNM. The user would copy the information in these tables from the FHWA TNM, and then paste it into specific locations in worksheets of the Microsoft Excel® workbook, with one worksheet for each noise barrier design. Then, the NBOT computes the impacts, benefits, and all of the other metrics needed to evaluate each barrier design and places these results side-by-side in the “Summary” worksheet, or [Summary], for easy comparison. Note that for the remainder of this report, the [Worksheet Name] notation will be used to designate individual worksheets within the Excel® workbook that is the NBOT. Likewise, the {TNM Table Name} notation will be used to designate one of the standard tables within the FHWA TNM.
In addition to the customary metrics and criteria, the NBOT computes some additional metrics that factor into the computation of the E/C metric, which assists in barrier optimization, including:
These two metrics are multiplied together to equal “Effectiveness” in the E/C metric. The “Cost” is simply the surface area of the barrier in square feet, divided by a constant of 10,000 to make the resultant E/C value in a reasonable range. In developing the E/C metric, the study team found that it was appropriate to use both the total Benefit normalized by total impact, as well as the percentage of impacts meeting the NRDG, to properly credit the barrier designs that largely achieve the NRDG. This was important, because many states attempt to achieve the NRDG at as many receptors as possible, within the allowable cost constraints.
To help identify the noise barrier design that represents the “point of diminishing returns” from among the uniform-height barrier designs, the user simply selects the design with the highest E/C ratio that also meets the SHA's NRDG and cost-effectiveness criterion. Each barrier design should be saved as a unique Barrier Analysis in the FHWA TNM, and the corresponding TNM tables should be copied to individual worksheets in the NBOT. The spreadsheet computes all of the metrics for the feasibility and reasonableness determination and compares calculated metrics across multiple noise barrier designs. Note, however, that at this point in the process the user has not yet identified the optimum noise barrier design. The user must take additional steps to refine the noise barrier design. Starting with the uniform-height barrier that achieved the highest E/C ratio, the analyst should consider dropping ineffective or unnecessary barrier segments, such as those at the ends of the noise barrier, or re-running the FHWA TNM for a noise barrier with smaller height increments. The following example illustrates the next steps that may be taken to identify the optimum design.
Example: Consider a scenario in which the user created a noise barrier with a base height of 10 feet, with five “up” perturbations, no “down” perturbations, and a height increment of 2 feet. Following the recommended approach, the user would systematically evaluate barrier designs with uniform heights from 10 to 20 feet, and then select the barrier design that not only yields the highest E/C ratio, but is also reasonable. For the sake of this example, assume that the uniform-height barrier with the highest E/C ratio is 16 feet high and 1,500 feet long. To find the optimum noise barrier design, the user would then consider re-running the FHWA TNM for a noise barrier with a base height of 16 feet, three “up” perturbations, three “down” perturbations, and a height increment of 1 foot. In this case, it is suggested that the user create a new version of the NBOT to document the barrier optimization process. Ultimately, the optimum noise barrier will be the design that yields the maximum value of the E/C ratio from this refined TNM run - say for example, a barrier that is 13 to 15 feet high and 1,450 feet long (and reasonable).
The study team created two versions of the NBOT - one with basic metrics (“Basic NBOT”) and one with more advanced metrics (“Advanced NBOT”). The latter version is intended for use in states that might require analysis of front row receivers, or other specialized analyses. This section provides details about the NBOT and its functionality.
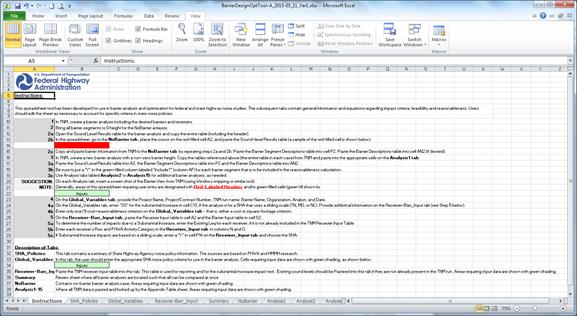
The tool includes [Instructions] with detailed instructions for user entry and use of the subsequent worksheets. First-time users of the NBOT should take the time to become familiar with this worksheet.
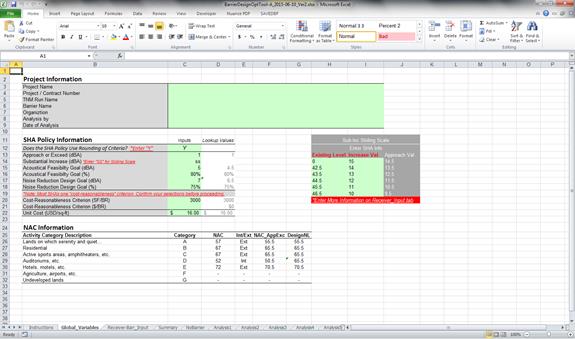
The project name, project / contract number, FHWA TNM run name, barrier name, organization, analyst, and analysis date should be entered on [Global Variables], where additional project-specific information also is entered. This includes the specific metrics, goals, and criteria for feasibility and reasonableness determinations that have been established by the SHA.
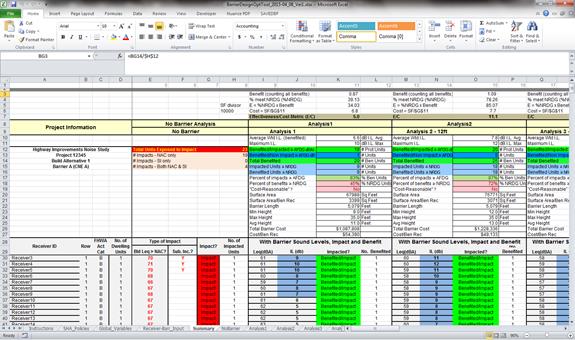
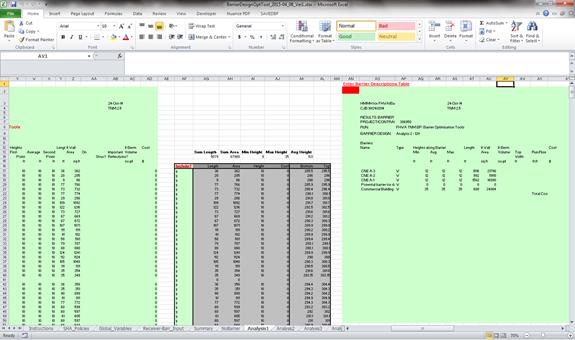
The layout of the workbook requires that the user enter the necessary SHA metrics and TNM tables for individual barrier designs into different worksheets. [Summary] then calculates the results of each barrier analysis and compares results across different designs. The NBOT is meant to be used in conjunction with TNM's Barrier Analysis Module. The user starts by selecting the barriers and receivers of interest and creating a new barrier analysis in the FHWA TNM. For each barrier design, the Sound-level Results table, the Barrier Segment Descriptions table, and the Barrier Descriptions table are copied from the FHWA TNM into specific locations on [Receiver-Barr Input], [NoBarrier], and [Analysis1] to [Analysis15], as needed. The Receiver Input table, along with other receiver information such as existing sound level, row, and FHWA Noise Abatement Category, must be entered into [Receiver-Barr Input]. The Barrier Input table from the FHWA TNM also should be added to [Receiver-Barr Input]. If the study is being completed for a state that uses a sliding scale to determine substantial increase impact, the user can enter the required information into [Global Variables] and [Receiver-Barr Input] for the scale to be referenced. The user is instructed to enter “SS” on [Global Variables] into cell C14 if the substantial increase threshold is based on a sliding scale. After “SS” is entered, the user is instructed to enter more information on [Receiver-Barr Input]. On this worksheet, the user enters a "Y" in cell P14 and chooses the appropriate SHA.
On [NoBarrier] and [Analysis1] to [Analysis15], the Sound-level Results table, the Barrier Segment Descriptions table, and Barrier Descriptions table for each respective barrier analysis should be pasted. On [NoBarrier], all barrier segments should be placed at a height of 0.0 feet before copying and pasting the applicable TNM tables. [Summary] pulls the sound levels and barrier parameters from each analysis worksheet so that impacts, benefits, and barrier costs can be calculated and displayed for each barrier analysis, all in one sheet. This allows the user to easily make comparisons across all of the barrier designs that have been considered on [Summary] so that the most appropriate barrier options can be recommended. [Analysis1] to [Analysis15] also include areas for a TNM image of the barrier design and the barrier's profile in graphical form to aid in the aesthetics of the design.
As discussed earlier, many SHAs desire to design and recommend noise barriers that provide the significant benefit for impacted receptors as well as non-impacted receptors while still being feasible and reasonable. Through the NBOT, the user can choose the most optimal barrier design by looking at the many various metrics that are computed. The E/C ratios, which reach a maximum value for the most cost-efficient barrier designs that also provide substantial benefit, are shown in Row 7 on [Summary].
Generally, areas for user input are symbolized with light green shaded cells and/or red bold underlined column headers. In the Basic NBOT, there are no user input cells on [Summary]. In the Advanced NBOT, [Summary] requires the user to enter specific information. The Advanced NBOT also contains metrics that calculate the percent of front row impacts, or benefits, as required for some SHA's feasibility and reasonableness criteria. In the Advanced NBOT, [Summary] also contains a flag to switch the reasonableness metrics to include cost or surface area per decibel of average noise reduction per benefited receptor. Flags for front row feasibility and reasonableness metrics and per decibel reasonableness metrics are symbolized as light green shaded cells with red bold underlined headers directing the user to enter “Y” into the cell.
[Summary] includes a flag for each type of impact, such as approaching or exceeding the Noise Abatement Criteria (NAC), or causing a substantial increase (SI) over existing levels. Column E contains the No Barrier Build Sound level, which is bold and red if it is over the threshold for impact. Column F contains a bold red “Y” flag if there is a substantial increase impact. Column G is an “impact” flag that signifies whether the receiver is exposed to noise impact (without a noise barrier). The impact tally summary above this section shows the total number of impacts, the number of impacts for each type (NAC or SI), as well as the total number experiencing both types of impact. Each section under the barrier analysis headers (Analysis1, Analysis2, etc.) contains a tally of the total benefited receivers, the number of benefits that are impacted or not impacted, and the number of impacts and benefits achieving the NRDG.
Cost-reasonableness checks are given for each Analysis section below the number tallies. There are cells that show the percentage of impacts being benefited and the benefits achieving the NRDG, as well as a “Yes” or “No” Cost-Reasonable check, which signifies whether the cost or surface area per benefit meets the appropriate criterion. These cells are conditionally formatted to be green if the criterion is being met and red if it is not. The NBOT is currently set up to notify the user if more than one reasonableness criterion is entered, mainly to avoid user error and because most SHAs have only one. However, if the user is working for a SHA with both types of criteria, the cost reasonableness formula will return a “Yes” if either criterion meets the threshold.
If the SHA requires the number (rather than percentage) of impacted receivers being benefited, or the number of benefited receivers achieving the NRDG, such as one (1) impacted receptor, then the user should leave the percentage inputs on [Global Variables] blank and use the number tallies on [Summary]. Some analysts include measurement sites in TNM runs. In such cases, dwelling units may, or may not, be assigned to the receiver in the FHWA TNM. If measurement sites are included in the barrier analysis, the NBOT will calculate impacts properly if the sites are assigned an FHWA Activity Category. If the measurement sites are not intended to represent noise-sensitive land use for the purpose of the noise impact assessment, users should assign a value of zero (0) dwelling units to those receivers that represent measurement sites.
Barrier parameters such as surface area, height range, length, and total cost also are included in each analysis section on [Summary]. Barrier parameters are pulled from information on [Analysis1] to [Analysis15] in the Barrier Segment Descriptions section of the worksheet. On [Analysis1] to [Analysis15], the user can enter “Y” in Column AF for each barrier segment that should be included in that analysis.
This section provides step-by-step instructions for using the NBOT. Users should be familiar with Microsoft Excel® workbooks and have a thorough understanding of the state noise abatement policy that applies to the Project.
Step 1 . Review [Instructions].
Step 2 . Enter project-specific information on [Global_Variables], including the SHA definitions for Approach or Exceed, Substantial Increase, the acoustical feasibility goal, the number or percent of receptors that must achieve the feasibility goal, the NRDG, the number or percent of receptors that must achieve the NRDG, the cost reasonableness criterion, and the unit cost for noise barriers. Users must enter the required information in the cells with green shading.
Step 3 . In TNM, open the {Receiver Input Table}. Select the table in its entirety and copy. Go to [Receiver-Barr Input] in the NBOT. Place the cursor in the applicable red-shaded cell (cell A2) and paste. Repeat the process for the {Barrier Input Table} and paste into cell S2. Enter a “Y” in cell P14 on [Receiver-Barr Input] if the SHA uses a sliding scale to determine noise impact based on a Substantial Increase. Currently, only three SHAs use a sliding scale (MD, NC, and TN). In cell Q14 on [Receiver-Barr Input], select one of the three SHAs from the pull-down.
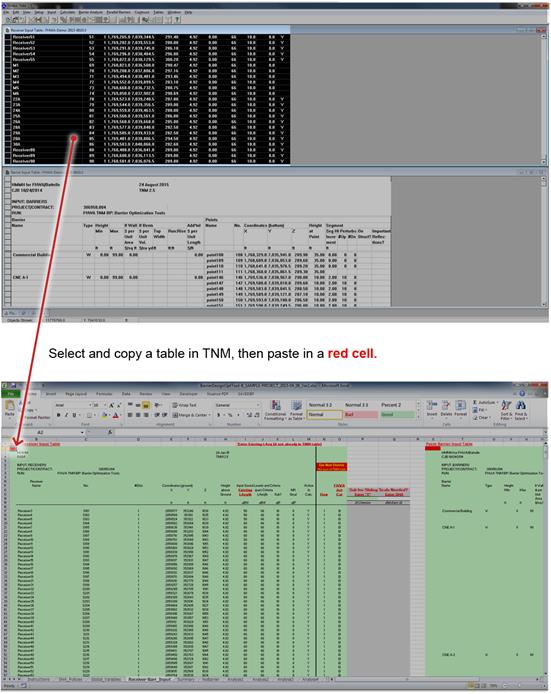
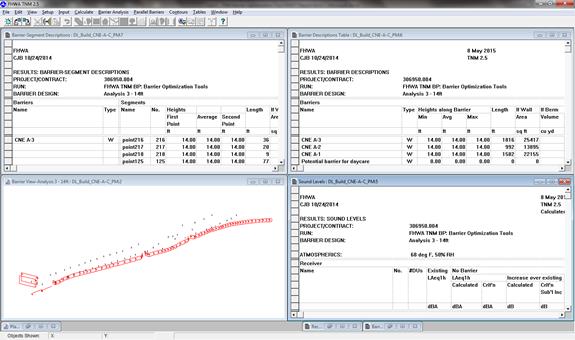
Step 4 . In TNM, close or minimize the {Receiver Input Table} and the {Barrier Input Table}. Select the receivers and noise barriers of interest and create a new barrier analysis. Minimize the Plan View. With the Barrier View active in TNM, open the {Sound Levels} results table, the {Barrier-Segment Descriptions} table, and the {Barrier Descriptions Table}; then from the pull-down menu in TNM, select “Window | Tile Vertical” or “Window | Tile Horizontal” to arrange the items as shown.
Step 5 . Perturb the heights of all noise barrier segments to be evaluated to a height of zero (0.0) feet. In turn, copy and paste the {Sound Levels} results table and the {Barrier-Segment Descriptions} table to the applicable red-shaded cells on [NoBarrier] in the Barrier Optimization Tool. The {Sound Levels} results table is pasted to cell A2, the {Barrier-Segment Descriptions} table is pasted to cell P2, and the {Barrier Descriptions Table} is pasted to cell AL2.
(Tip: don't forget to “Remember” each barrier analysis in TNM.)
In TNM, increase the height of all noise barrier segments to be evaluated to the first barrier height perturbation. In turn, copy and paste the {Sound Levels} results table, the {Barrier-Segment Descriptions} table, and the {Barrier Descriptions Table} to the applicable red-shaded cells on [Analysis1]. In column AF on [Analysis1], place a “Y” or “y” in the row for each barrier segment that is to be included in the evaluation. The {Sound Levels} results table is pasted to cell A2, the {Barrier-Segment Descriptions} table is pasted to cell P2, and the {Barrier Descriptions Table} is pasted to cell AN2.
(Tip: Copy and paste the Plan View from TNM in column BA.)
Repeat the process for additional barrier height perturbations, copying and pasting tables from TNM to the applicable red-shaded cells in [Analysis2] to [Analysis15], as needed. The {Sound Levels} results table is pasted to cell A2, the {Barrier-Segment Descriptions} table is pasted to cell P2, and the {Barrier Descriptions Table} is pasted to cell AN2.
Step 6 . Review the results of the barrier analyses on [Summary] in the NBOT. [Summary] provides all of the relevant information about each barrier design that is required to make the feasibility / reasonableness determination.