Developer Contributions - One-time charges collected by local governments from developers to offset the cost of infrastructure and services necessitated by new development.
Special Assessments - An additional fee or tax assessed on businesses or residents in specified geographic areas benefiting proximity to a highway or other transportation facility or corridor.
Fees - Similar to a utility fee, transportation fees are assessed based on how individual businesses and households use transportation facilities.
* Incremental Growth - A mechanism allocating back to infrastructure from some specified portion of increased property tax revenues fostered by new infrastructure - often for a specified period of time.
Joint Development - Sale or lease of land or air rights on or adjacent to transportation facilities. This can include donations of land or other in-kind resources from the private sector in ongoing commercial operations.
Concessions - Sale or lease of government owned assets - such as toll roads or bridges - to private-sector investors/operators.
Advertising and Naming Rights - Sale of advertising space or naming rights on a transportation facility. Note: Commercial uses within Interstate Highway System right of way, including rest areas, is prohibited by law; however, they may be allowed on toll facilities and in transit stations.
* Topic of this webinar
Outline of Presentation
Tax Incremental Finance Overview
Why is There a Need for Incremental Revenues?
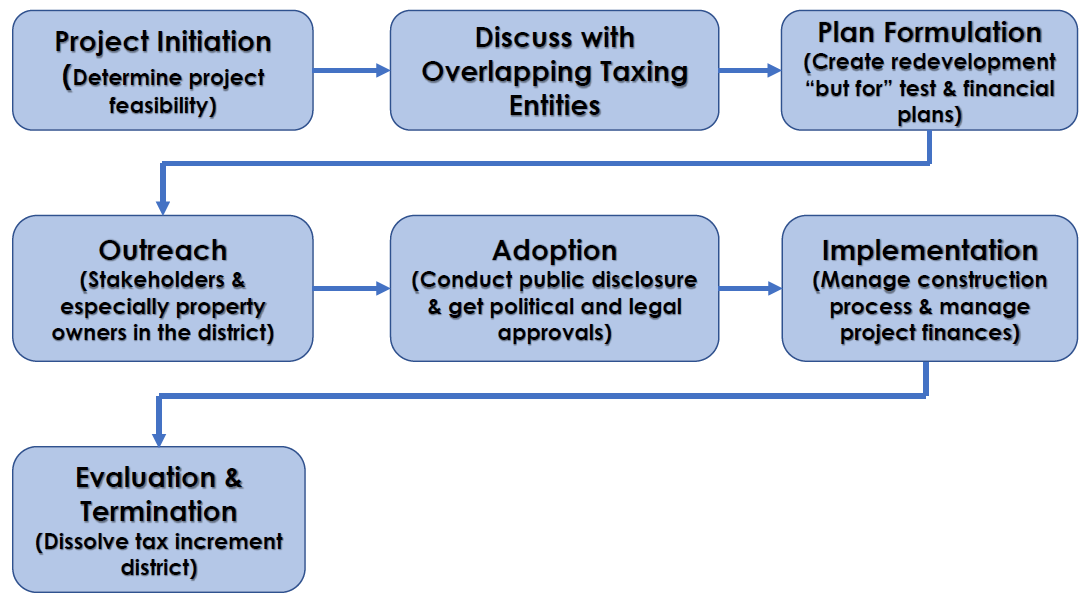
Process to Create a TIF District
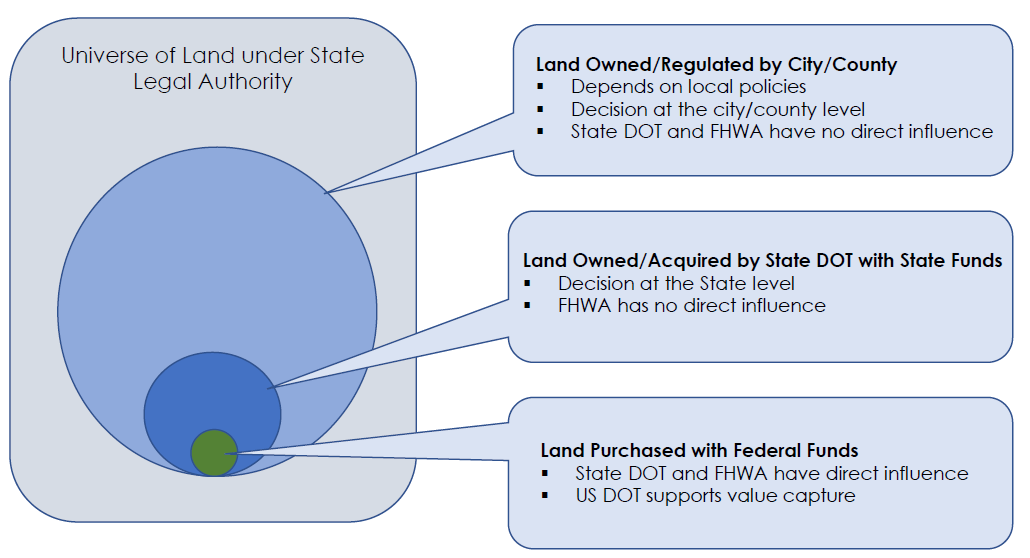
Federal Roles
Case Studies
Q&A
Tax Incremental Finance Overview
Glossary of Terms
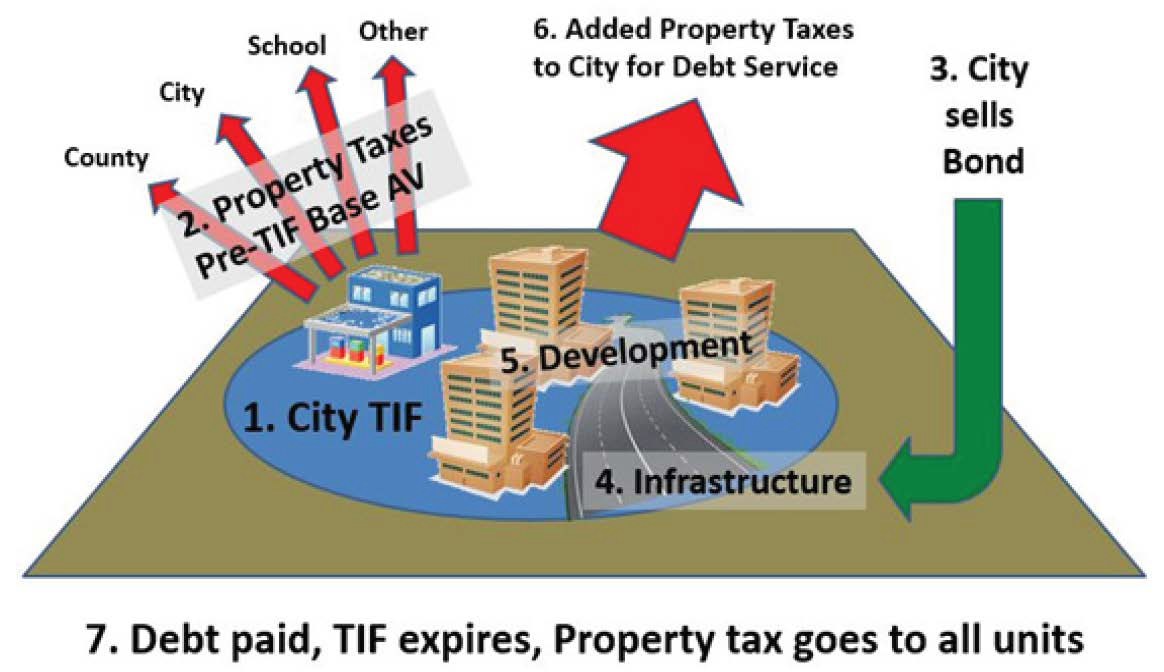
Tax Incremental Financing (TIF): a revenue/funding tool available to local authorities to encourage economic development that would not occur without public assistance.
A Tax Increment District (TID): the contiguous geographical area within a municipality consisting solely of whole units of property that are assessed for general property tax purposes.
"Blight" - The legal term "blight" describes a wide array of urban problems, which can range from physical deterioration of buildings and the environment, to health, social, and economic problems in a particular area.
Neighborhood blight and the presence of vacant and abandoned properties have profound negative impacts on afflicted communities. Blighted properties decrease surrounding property values, erode the health of local housing markets, pose safety hazards, and reduce local tax revenue.
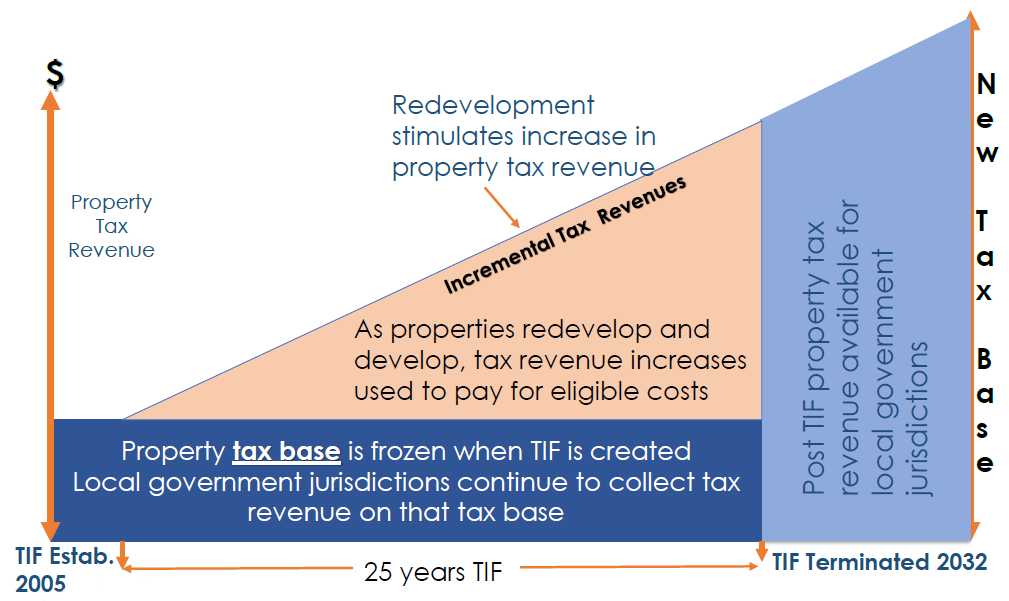
A revenue tool that captures and uses increased property tax revenues from new development within a defined geographic area to fund public infrastructure
Available in 49 of 50 states and the District of Columbia
Represents the new tax revenues generated from new development properties within the Tax Incremental District and are split into two components:
Base Revenues
Incremental Revenues
Incremental Revenues Financing Tools
Pay-as-you-go financing: expenditures are undertaken as incremental revenue is realized
Developer financing: Local reimburses the developer for TIF-eligible costs as it obtains incremental revenues
Municipal financing:
Revenue bonds & general obligation
Taxable revenue bond
Municipal financing with developer participation: Local authority issues bonds while the developer simultaneously pledges to purchase all or a significant portion of bonds
What is the Need for Value Capture: Tax Increment Financing?
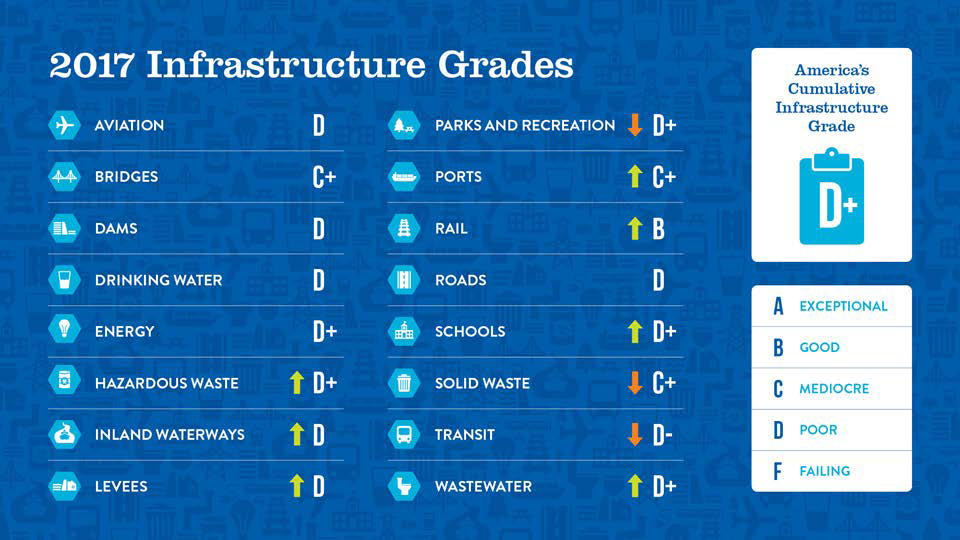
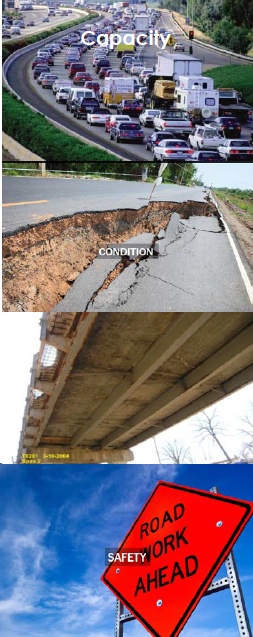
Infrastructure Crisis
National Highway System Conditions (ASCE 2017)
One out of every 5 miles of highway pavement is in poor condition
8% or 47,000 bridges rated in poor condition
43% or 260,209 bridges are over 50 years old
$836 billion backlog of highway and bridge capital needs
The fundamental purpose of TIF is to attract investment to an area in which little or no new development or growth would take place without the use of the TIF
This is sometimes called the "but for" test - no growth/development would happen but for the use of TIF
TIF District Maintenance
Annual TIF audited reports
Update district database to provide information for interested parties
On-going monitoring and continuing disclosure requirements
Investor quarterly reports
Termination of Tax Incremental Finance District
Reach the end of maximum Tax Incremental Finance District statutory life (25-30 years)
A TIF District may be terminated by a resolution from the municipality's government
The Department of Revenue must be notified
A final accounting report (audited financial statement) must be completed
Challenges: Community Buy-In
Redevelopment and economic development do not happen in a vacuum, and the process can be highly political
Diversion of tax dollars for private development can be controversial
Raises policy questions regarding the proper role of government
Issuance of "public" debt for "private" development can be unsettling
Tax revenue "diverted" from other municipal services
Thay Bishop, FHWA Center for Innovative Finance Support, OIPD
Stefan Natzke, FHWA Office of Planning, Environment, and Realty
Members
Jennifer Ahlin, Virginia Department of Transportation
Janine Ashe, FHWA District of Columbia Division
David Cohen, FHWA Office of Project Development & Env. Review
John Duel, FHWA Office of Planning, Environment, and Realty
Kathleen Hulbert, FHWA Infrastructure Office
Andrea Kirk, FHWA Center for Local-Aid Support, OIPD
Chip Millard, FHWA Freight Management & Operation
Diane Mobley, FHWA Chief Counsel Office
Kevin Moody, FHWA Resource Center
Ben Orsbon, South Dakota Department of Transportation
Jill Stark, FHWA Office of Planning, Environment, and Realty
Lindsey Svendsen, FHWA Office of Planning, Environment, and Realty
Jim Thorne, FHWA Office of Planning, Environment, and Realty
Bingxin Yu, FHWA Transportation Policy Studies
VCIT Focus Areas
Communication - Developing the tools to help FHWA staff and others promote Value Capture to local public agencies (Value Capture Implementation Manual)
Technical assistance - Providing technical assistance to local public agencies interested in pursuing Value Capture (Peer Program)
Clearinghouse (website) - Identification of best practices and lessons learned and promoting further discussion on innovative funding options for local public agencies, lessons learned from past and current efforts, etc
Value Capture Implementation Manual
1. Introduction
2. Assess Funding Options and Need for Value Capture
3-8. Select Appropriate Value Capture Technique
9. Develop Business and Economic Case and for Stakeholders
OUR VISION IS TO MAKE ATLANTA THE MOST ECONOMICALLY DYNAMIC AND COMPETITIVE CITY IN THE WORLD.
OUR MISSION
TO ADVANCE ATLANTA'S GLOBAL COMPETITIVENESS BY GROWING A STRONG ECONOMY, BUILDING VIBRANT COMMUNITIES AND INCREASING ECONOMIC PROSPERITY FOR ALL ATLANTANS.
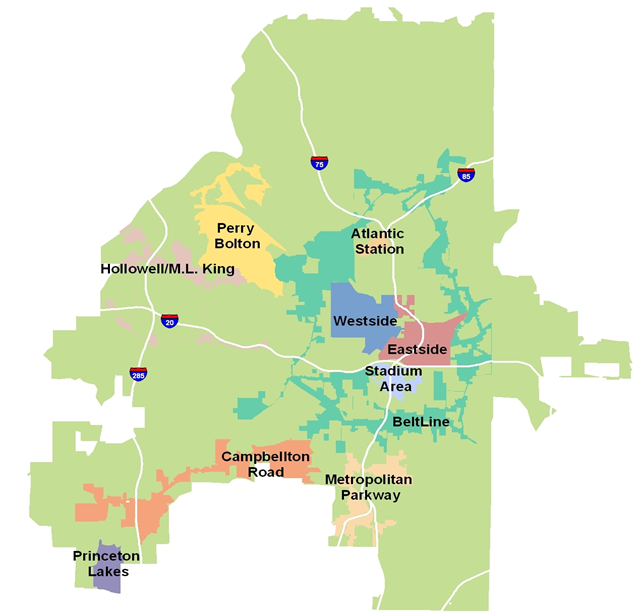
Tax Allocation Districts and Corridors
Atlanta's Tax Allocation Districts
Westside (1992/1998 expanded)
Atlantic Station (1999) - All proceeds pledged to debt repayment. No new projects
Princeton Lakes (2002) - All proceeds pledged to debt repayment. No new projects
Perry Bolton (2002)
Eastside (2003)
Atlanta BeltLine (2005)
Campbellton Road (2006)
Hollowell/ML King (2006)
Metropolitan Parkway (2006)
Stadium Area (2006) 3
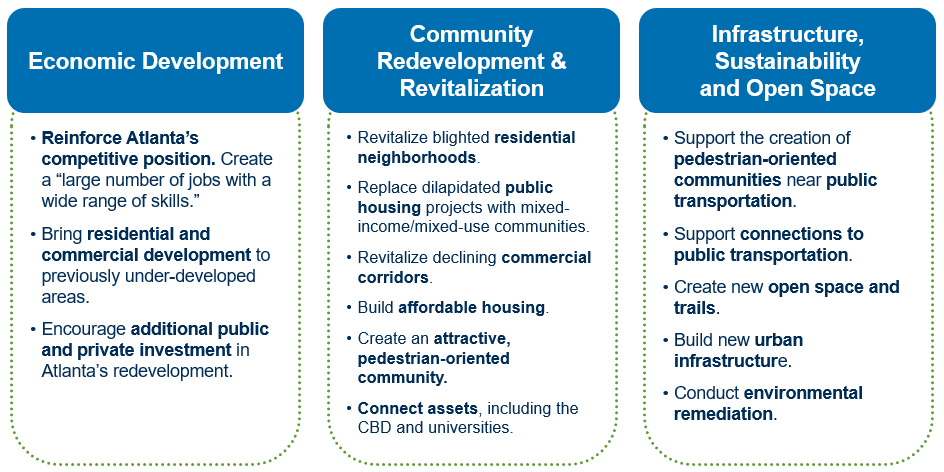
Objectives of Atlanta's TAD Program
Each TAD was establishedwith a redevelopmentplan that addresses specific challenges.
Reinforce Atlanta's competitive position. Create a "large number of jobs with a wide range of skills."
Bring residential and commercial development to previously under-developed areas.
Encourage additional public and private investment in Atlanta's redevelopment.
Community Redevelopment & Revitalization:
Revitalize blighted residential neighborhoods.
Replace dilapidated public housing projects with mixed-income/mixed-use communities.
Revitalize declining commercial corridors.
Build affordable housing.
Create an attractive, pedestrian-oriented community.
Connect assets, including the CBD and universities.
Infrastructure, Sustainabilitt abd Open Space:
Support the creation of pedestrian-oriented communities near public transportation.
Support connections to public transportation.
Create new open space and trails.
Build new urban infrastructure.
Conduct environmental remediation.
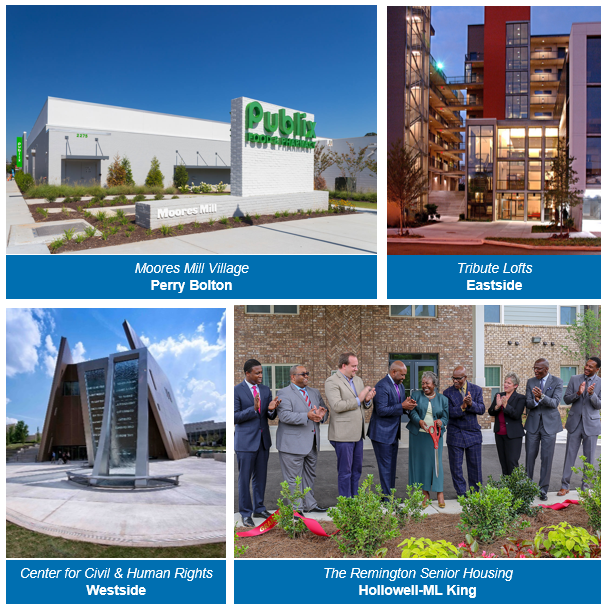
TAD Success Stories
TAD funding has been utilized to develop a wide array of residential, office, retail, hotel, and public amenity projects.
Usage: TAD bonds and incremental tax revenues have been committed to or already provided gap funding to leverage over $9.0 billion in private development.
Projects: TAD bonds and incremental tax revenues have helped fund or have been committed to:
Over 12 million square feet of new residential development, producing over 12,000 units, more than 20% of which are affordable
Over 7 million square feet of new commercial development, including hotels, stores, office buildings and a film production studio.
The TAD program has also helped to fund two fire stations, several community and educational facilities, open space and trail projects, and infrastructure improvement projects.
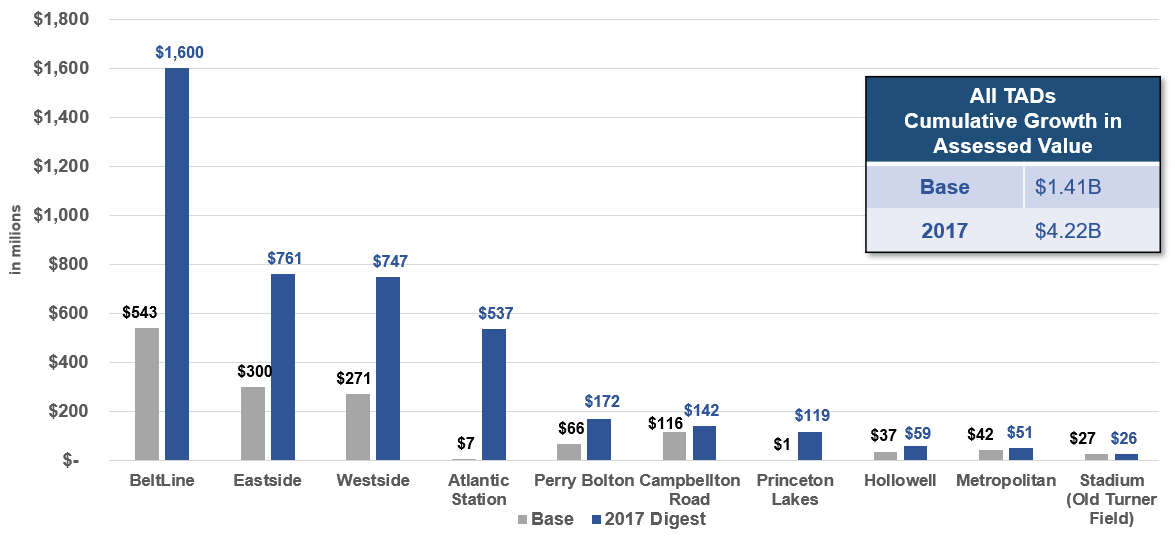
Since the creation of each TAD, the cumulative increment in assessed value for all TADs is $2.81B.
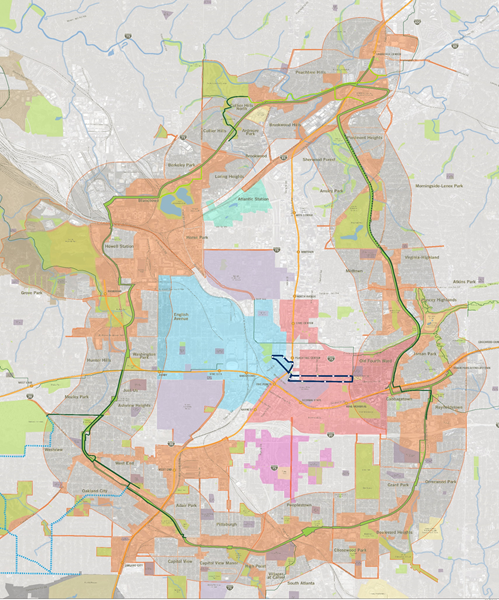
Atlanta Beltline
Atlanta BeltLine, Inc. (ABI) was created in 2006.
ABI is managing the planning, design and implementation of all aspects of the project.
+/- 3,000 acres of underutilized land along the corridor will become available for public and private redevelopment opportunities.
Funding for the Atlanta BeltLine project comes from a combination of federal, state, local, and private sources.
Atlanta Beltline & Transit
A Coordinated Approach
Two major efforts are underway to advance transit on the Atlanta BeltLine: the More MARTA program and federal NEPA studies. These support the Atlanta Streetcar System Plan (SSP), which focuses on connecting neighborhoods to key destinations and activity centers. The SSP is a supplement to the City's Connect Atlanta Plan and works in tandem with Atlanta BeltLine, Inc.'s Strategic Implementation Plan (SIP).
More MARTA
16 projects throughout the City of Atlanta will be funded through the More MARTA sales tax. This includes approximately $1.2 billion in funding for Atlanta BeltLine transit projects.
The Big Picture
The plan calls for 50 miles of new streetcar routes and 12 miles of connected transit, which includes investment in other forms of public transportation to provide additional connectivity to the streetcar system. The SSP was adopted by the Atlanta City Council on December 8, 2015.
Atlanta Beltline Challenges
AFFORDABLEHOUSING
EQUITY & INCLUSION
DISPLACEMENT
INVEST ATLANTA
Thank you
Presentation 3
Incremental Growth Techniques:
Transportation Reinvestment Zones
Federal Highway Administration EDC-5 Value Capture Webinar
August 22, 2019
Outline
Introduction and Background
The Texas TRZ
Evolution of the TRZ Legal Framework
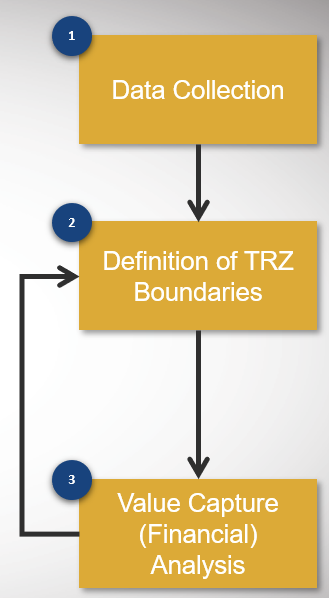
The TRZ Implementation Process
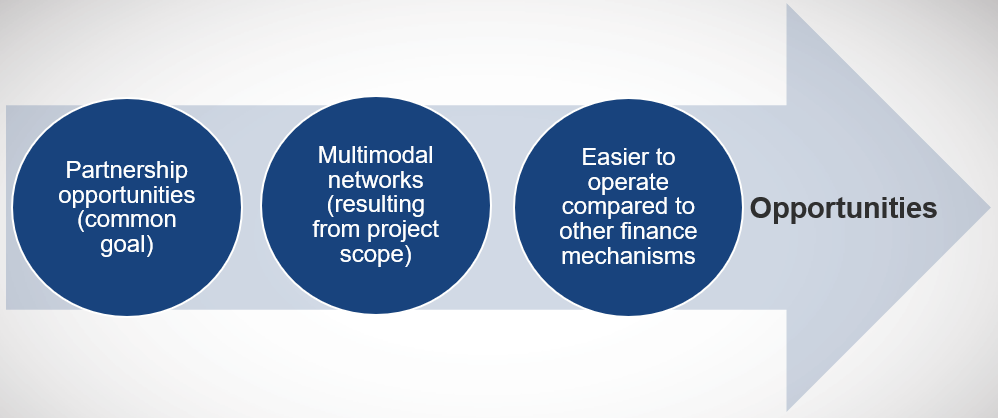
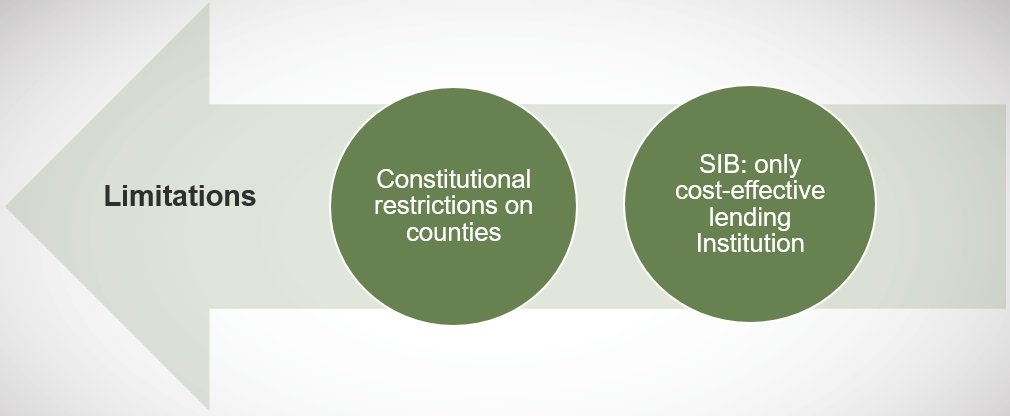
Opportunities and Limitations
Active Texas TRZs
Introduction
Funding Transportation Needs
Creative Thinking
Doing more with less
Alternative Funding sources
Texas Legislature SB 1266 (2007) Created TRZs
14 Local TRZs Since 2007
Background
Types of Value Capture Mechanisms used in Transportation #1 of 2
Mechanism
Definition
Applicable Purpose
Examples (State)
Impact
Fees (IF)
One-time charge
Local governments collect from developers to finance new infrastructure and services for new development.
Cost recovery
Transportation System Development Charges
In OR used to fund existing
and new capacity
Also used in WA and NJ
Special Assessment District (SAD)
Additional fee on properties benefiting from proximity to a new facility
District vote is needed
Projects require district vote
Capture of project expansion benefits
VA and OH (Downtown Improvement Districts),
IL Special Service Areas
Sales Tax District (STD)
Type of SAD requiring project beneficiaries to pay limited sales tax instead of property tax
Capture of project expansion benefits
IL Special Service Areas;
MO and KS Transportation DD
Negotiated Exaction (NE)
One-time charge similar to IFs but not requiring a formal process
Example: in-kind contributions to local infrastructure (roads, parks, etc.) for development approval
Capturing opportunity for value creation and cost recovery
VA proffer
Joint Development (JD or P3)
Development of a transit facility and adjacent private real estate
Private partner provides facility or makes financial contribution to offset construction costs
Capturing opportunity for value creation and cost sharing and revenue sharing with private sector
Massachusetts Turnpike (MA) and Washington Metropolitan Transit Authority (VA)
Air Rights (AR)
Form of JD
Dev. rights above or below infrastructure facility used to generate / capture incremental increase in land value
Capturing opportunity for value creation and cost sharing and revenue sharing with private sector
Massachusetts Turnpike (MA) Interstate 5 (WA)
Land Value Tax (LVT)
Tax imposed on land value benefiting from infrastructure
Capture of project expansion benefits
Pennsylvania counties (PA)
Transportation utility fees (TUFs)
Utility fees assessed on characteristics more closely related to transportation demand than property taxes
Cost recovery: operating and maintenance costs
Oregon TUF for pavement maintenance (OR)
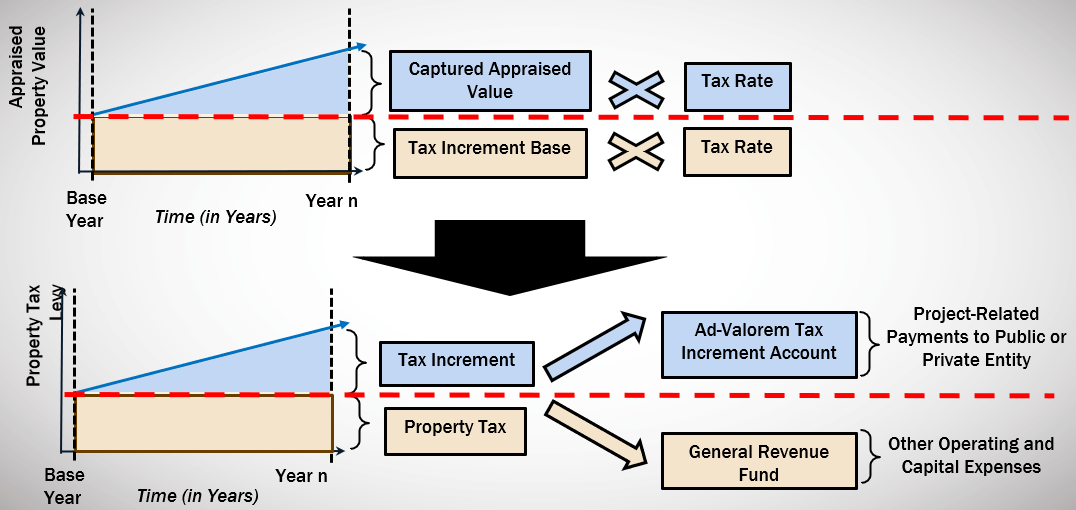
Tax increment financing (TIF)
Mechanism to allocate any increase in total property tax revenues toward public investment within a designated district
Capture of project expansion benefits
TRZs (TX)
The Texas TRZ - Definition
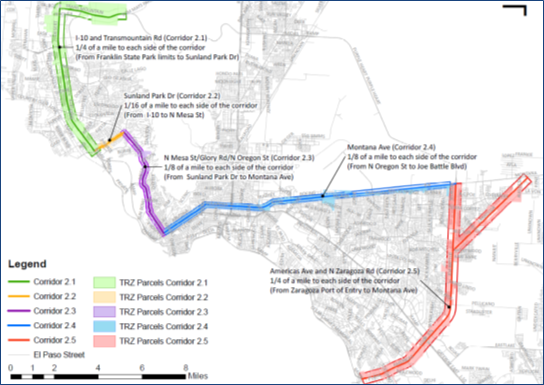
Texas TRZs
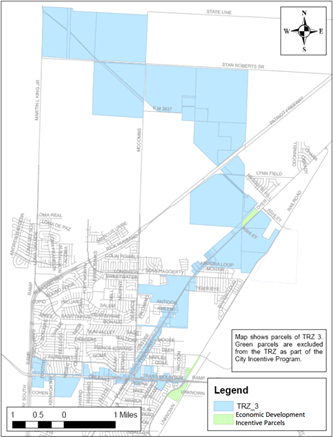
Designated contiguous zone around a planned transportation improvement where properties are expected to benefit from the project through land development, value increases
Legal arrangement to facilitate value capture via the property and sales tax mechanism and allow the local government to use incremental tax revenue as collateral
Texas TRZs are not a new tax
Tax rates do not change
Revenue realized only if real property develops / increases in value
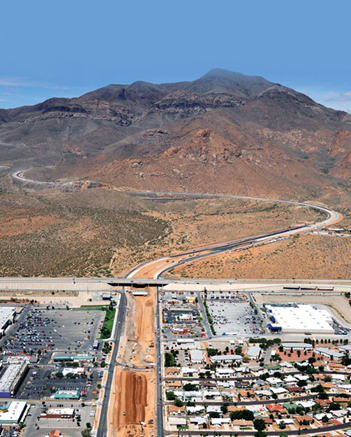
TRZs Expedite Transportation Projects
Local match contributions
Multiple funding sources leveraged
TRZ Legal Framework Has Evolved
Process / requirements clarified
Uses / types modified or expanded
Three TRZ Types
Municipal
County
Port Authority
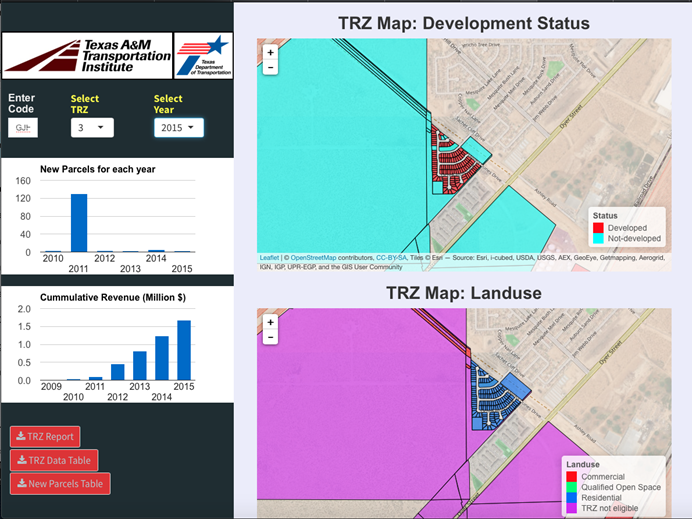
The Texas TRZ - How it Works
The Texas TRZ - Financing Options
Three Financing Options Available for TRZ Revenue Funds
Type
Form
Advantage
Disadvantage
Pay-as-you-go
Expenditure within the budget limit
No financial cost
Slow/late delivery due to capital constraints
Municipal bond financing
Public financing from capital markets
Earlier availability of capital
Flexibility to finance different project types
Higher transaction costs
Higher financial (interest) costs
State Infrastructure Bank (SIB)
Long-term debt from the state
Earlier availability of capital
Lower transaction, (interest) costs
Competition with other local governments
Federalization: added time and cost
Restrictions on financing of projects off the state system
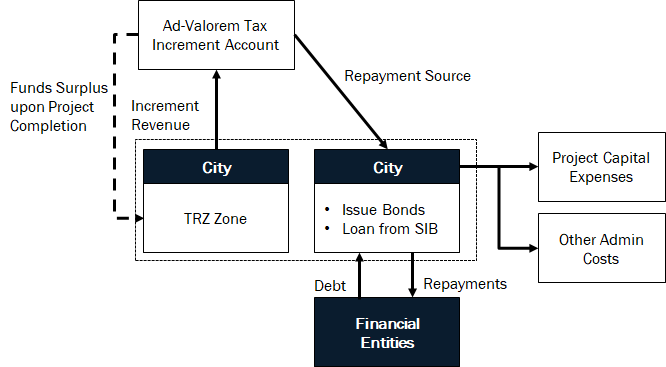
The Texas TRZ - How Funds Flow
Bond and SIB Loan Financing
Start: Public entity borrows money with TRZ revenue as collateral.
Construction: Government starts construction
Operation: Government repays debt using tax increment