« PreviousNext »
2 Review of Value Capture (VC) Techniques
Review of Value Capture Techniques

- Set of techniques that take advantage of increased property values resulting from new or improved transportation infrastructure
- New infrastructure can increase attractiveness of certain areas, raising demand and property values; many value capture techniques seek to capture some of these property value increases
Value Capture Techniques Examined in the Primer
- SPECIAL ASSESSMENT DISTRICTS
- TAX INCREMENT FINANCING
- JOINT DEVELOPMENT
- IMPACT FEES
- TRANSPORTATION UTILITY FEES
- NAMING RIGHTS
1. SPECIAL ASSESSMENT DISTRICT
Fee charged to property owners within designated district whose properties are primary beneficiaries of infrastructure improvement
2. TAX INCREMENT FINANCING
Incremental property tax value increases from infrastructure investment are captured to fund/ finance the investment
3. JOINT DEVELOPMENT
Cost/revenue -sharing partnership between public entity and private-sector to develop certain infrastructure assets
4. IMPACT FEES
Charges imposed on developers by municipalities to help fund public services/infra structure required due to new development
5. TRANSPORTATION UTILITY FEES
Periodic fees paid by property owner or renter to municipality based on transportation system use
6. NAMING RIGHTS
Agency sells rights to name infrastructure to private company or non-profit institution
Value Capture Techniques Reviewed
1. SPECIAL ASSESSMENT DISTRICTS
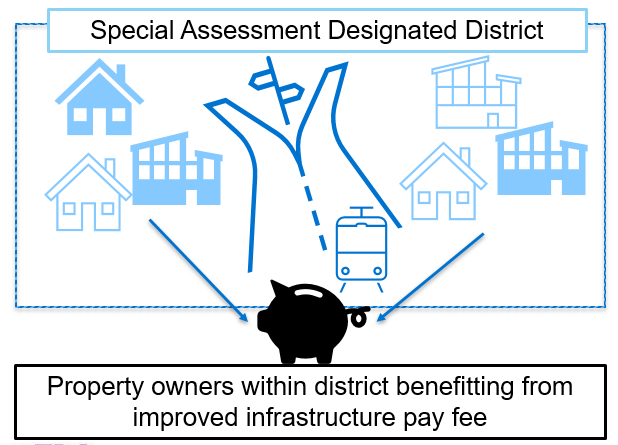
Other Names
- Benefit Assessment District (CA)
- Local Improvement District (WA)
- Community Improvement District (MO)
- Downtown Improvement District, transportation improvement districts
(VA, OH),
- Special Services Area (Il)
2. TAX INCREMENT FINANCING
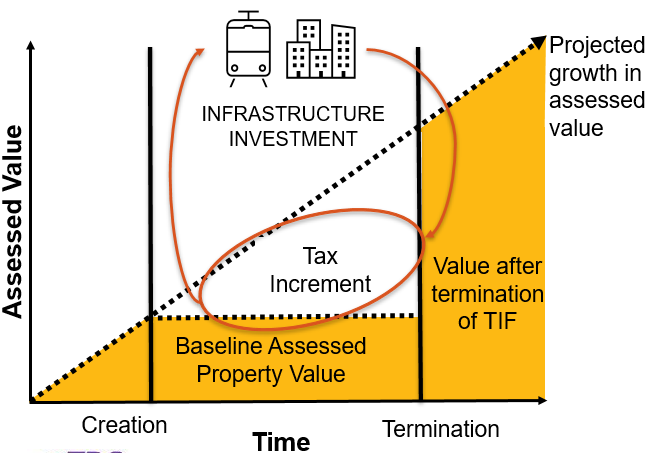
There is a line chart here with various visual enhancements. The Y axis on left is titled &dquot;Assessed Value,&dquot; and the X axis running along the bottom is titled &dquot;Time.&dquot; There are two sub-divisions on the Time or X axis: &dquot;Creation&dquot; and &dquot;Termination.&dquot;
The theme of &dquot;Projected Growth in Assessed Value&dquot; is represented by a line that goes from the bottom/left corner where X and Y meet, and runs up at an approximately 45 degree angle to the top of the chart, basically creating a top and bottom triangle sections. In the middle is a vertical section between Creation and Termination labels that contains three sub-structures of the chart: &dquot;Infrastructure Investment,&dquot; &dquot;Tax Increment,&dquot; and &dquot;Baseline Assessed Property Value.
What: Incremental property taxes captured in district to fund and finance infrastructure in that district
Alternate Terms: Tax Allocation Districts; Transportation Reinvestment Zones
Uses: Transit & Roads
3. JOINT DEVELOPMENT
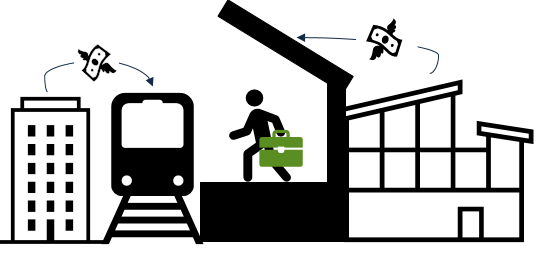
A graphic showing a building on right, with a train on a track next to it on right, then a platform with a commuter, then another commercial structure. There are dollar bill icons connected to the train from both buildings that are abutting the track.
Creation of commercial property next to transportation project, e.g., rail station, often with benefit of defraying the cost of that project
2 KEY TYPES
- Revenue Sharing Arrangements
- Cost Sharing Arrangements
4. IMPACT FEES
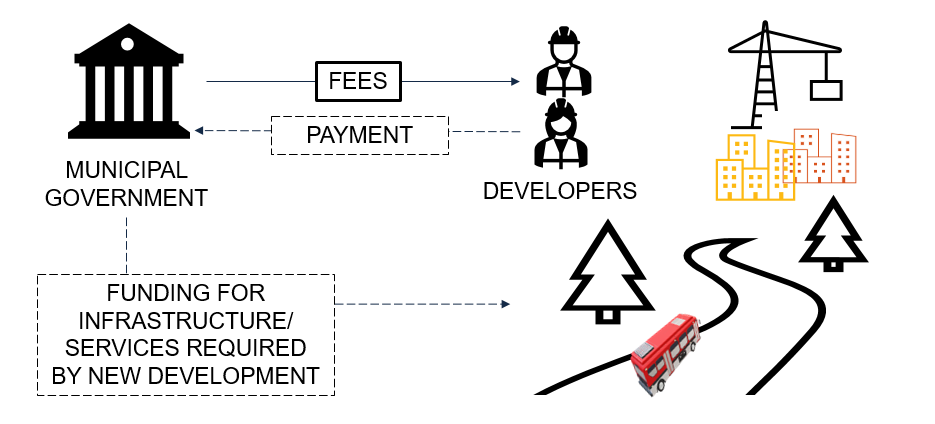
This diagram shows a cycle. Impact fees are charges imposed on developers by municipalities to help fund additional public services, infrastructure, or transportation facilities required due to the new development. This diagram starts with a building with columns to represent Municipal Government. It shows arrows going to Developers which are fees, then arrows going back to the Municpal Government which are for Payments. Below Municpal Government is a connected block that’s titled, &dquot;Funding for Infrastructure/Services Required by New Development.&dquot; Then from that block arrows go to a graphic representation of that new development.
5. TRANSPORTATION UTILITY FEES
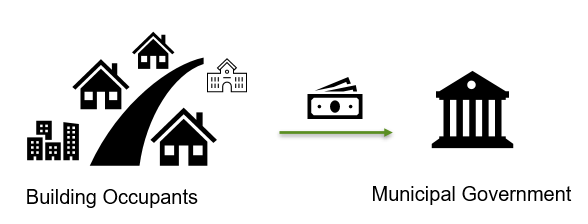
…periodic fees paid by property owner/building occupant to municipality based on use of local transportation system
TUFs are also called:
Transportation Maintenance Fees
Street Maintenance Fees
Road Use Fees
Pavement Maintenance Utility Fees
Street Restoration & Maintenance Fees
Street Utility Fees
6.NAMING RIGHTS
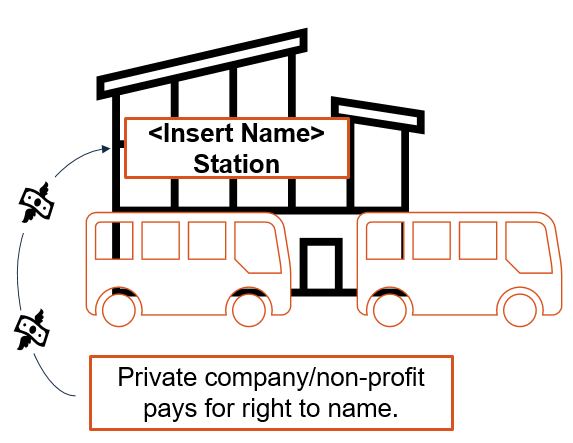
A graphic showing a building with a sign that says, 'Insert Name Station.' There are transit vehicles in front. Below there's a block with text: 'Private company/non-profit pays for right to name.' This box has an arrow going up to the building with money icons.
Transit agency sells right to name infrastructure to private company/non-profit.
e.g., “Salesforce Transit Center” in San Francisco, CA, and “Atlantic Avenue Barclays Center” in Brooklyn, NY
« PreviousNext »