« PreviousNext »
3 Impacts to VC Funding Sources & Project Implications
Impacts to VC funding sources: economic shocks can lead to reduced revenues
DRIVER FOR REDUCTION IN VALUE CAPTURE REVENUE |
VALUE CAPTURE TECHNIQUE IMPACTED |
Lower property value appreciation |
TIF, Joint Development, Special Assessments |
Lower assessments and/or difficulty levying new assessments |
Special Assessments |
Less new development leading to lower impact fees / reduction in fee |
Impact fees |
Less commerce leading to lower sales tax district fees |
Special Assessment District, specifically sales tax district |
Changing naming rights demand |
Naming Rights |
Lower property value appreciation – varies by shock
| Economic Shock |
Office |
Retail |
Industrial |
Mult-family |
Residential |
Great Financial Crisis (GFC) |
|
|
|
|
|
COVID-19 Pandemic |
|
|
|
 ; |
|

= real estate sector saw depreciation

= real estate sector saw appreciation
Lower property value appreciation – negatively impacts TIF revenues
TIF relies on improved infrastructure assets leading to higher property values; but economic shocks can negatively affect growth in appraised property value
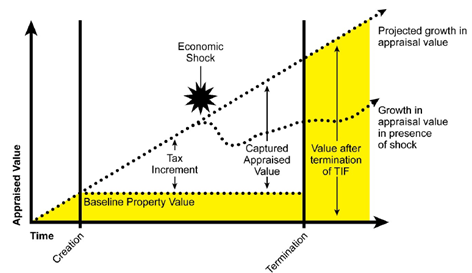
Conceptual Overview –
Economic Shock Impacts on TIF

Projected Annual TAD Revenue for Atlanta BeltLine, 2012-2030
Data Source: Atlanta Beltline “Changes in Tax Increment Projections”
There's a line chart here. The Y axis runs from 0 to 350 million dollars. The X axis runs dates from 2012 out to 2030. The Original TAD Projection line starts at rougly 30 million dollars, running from 2012 to 2030. It tops out at roughly 320 million dollars.
Lower property value appreciation – can lower special assessment revenues
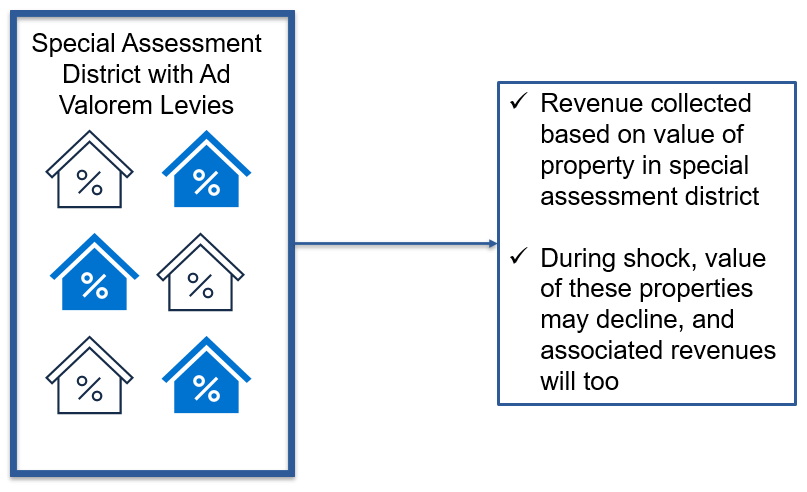
A graphic with house icons that alternate in blue and white colors. Each house icon has a percent symbol inside. The title is: 'Special Assessment District with Ad Valorem Levies.
- Revenue collected based on value of property in special assessment district
- During shock, value of these properties may decline, and associated revenues will too,/
Lower assessments / difficulty levying new assessments
During economic shock it may be more difficult to levy new special assessments
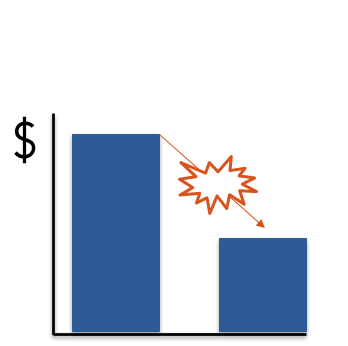
Lower levies feasible during periods of economic shock

Property owners may block new levies during economic downturns
Less new development leading to lower impact fees / reduction in fee
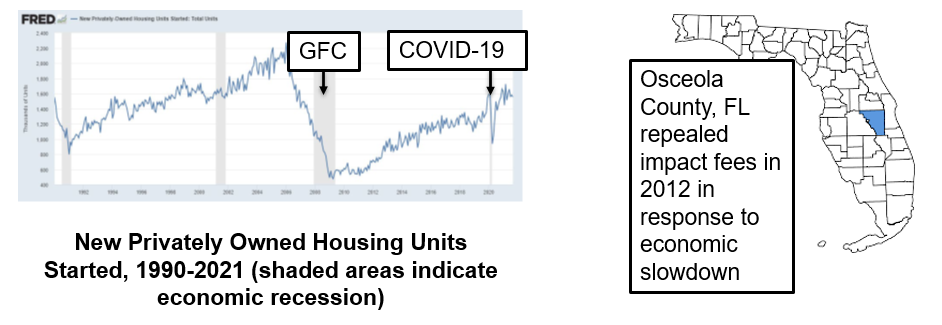
Line chart showing the numbers of New Privately-Owned Housing Units Started: Total Units. Dates go from 1990 to 2022. It starts in 1990 at about 1,600 units and fluctuates. There's a big dip after 2006 where it was up to 2200, and it goes all the way down to about 500 near 2009. Then it slowly works its way back up until it takes another significant dip after COVID-19 right before the start of 2020. Both the Global Financial Crisis and COVID-19 date ranges are shaded to mark economic recession. Map showing Osceola County, Florida highlighted.
Source: US Census Bureau and US Department of Housing and Urban Development
Less commerce leading to lower sales tax district fees
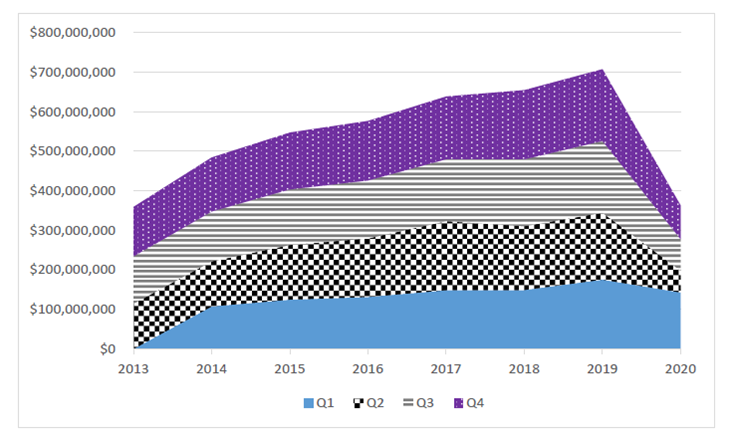
There's a area chart here. The Y axis runs from 0 to 800 million dollars. The X axis runs dates from 2013 out to 2020. There are four quarters represented by the areas on the chart. Quarter 1 runs from 0 dollars in 2013 up to 100 million dollars in 2014, rising up to hit roughly 175 million in 2019, then it falls by 2020 back to roughly 135 million. Quarter 2 runs from roughly 108 million dollars in 2013 up to 210 million dollars in 2014, rising up to hit roughly 340 million in 2019, then it falls by 2020 back to roughly 200 million. Quarter 3 runs from roughly 225 million dollars in 2013 up to 400 million dollars in 2015, rising up to hit 510 million in 2019, then it falls by 2020 back to roughly 290 million. Quarter 4 runs from roughly 365 million dollars in 2013 up to 550 million dollars in 2015, rising up to hit 705 million in 2019, then it falls by 2020 back to roughly 370 million.
Volume of Taxable Sales in the Kansas City Streetcar’s
Starter Line Transportation Development District
Source: Missouri Department of Revenue, Taxation Division, Taxable Sales and Use Tax by Locality – Taxable Sales for All Districts (2013 – 2021).
Implications of reduced VC revenues on projects
Implication |
For example… |
|
Inability to Meet Funding or Debt Service Requirements of Current Projects |
- Atlanta BeltLine’s less than expected TIF revenues during GFC hindered project
- Assessed value of NYC office buildings declined by 16.6% in 2021
|
|
Reduced Ability to Secure Project Financing |
- With reduced TIF revenues during GFC, Atlanta BeltLine did not have enough debt capacity to issue more bonds
|
|
Reduced Public Agency Willingness to Fund Future Projects |
- Projects with unidentified funding sources or with less support will fail to get off the ground during economic shocks
|
| Switch to Pay-As-You-Go (Paygo) Modality |
- May lead to project phasing as in Atlanta BeltLine or Colorado E-470
|
« PreviousNext »


 ;
;
 = real estate sector saw depreciation
 = real estate sector saw appreciation


