MANAGING ECONOMIC SHOCKS TO VALUE CAPTURE-FUNDED PROJECTS: IMPLICATIONS AND TOOLS FOR MANAGING-A PRESENTATION

March 2022

TABLE OF CONTENTS

« PreviousNext »

4. Tools to Manage Impacts

Tools to Manage


Mitigation Tool

Icon for Analyse Downsides

Analyze Downsides

Icon for Over-collateralize (coins)

Over-collateralize

Ion - piggy bank

Build in reserve funds

Icon racing flags

Collect revenues before project start

Icon dollar bills

Reduce early cash flow pressure

Icon train tracks Icon train tracks Icon train tracks

Develop projects by phase

Icon wall

Backstop with creditworthy sources


Icon for Analyse Downsides
ANALYSE dOWNSIDES.

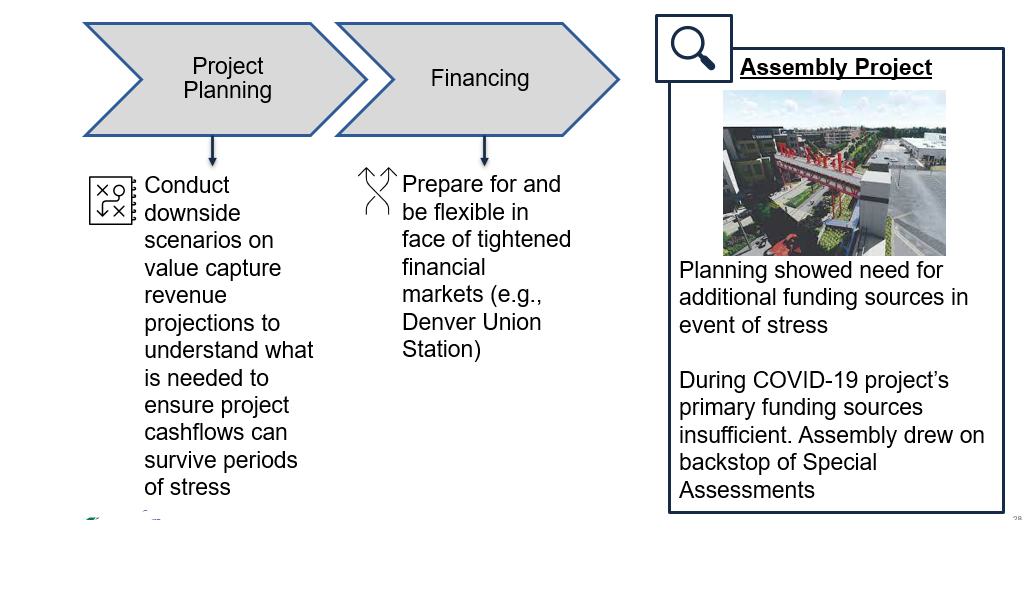
A graphic here of two arrow shapes that house text inside. The first arrow is titled Project Planning. This arrow points to another arrow titled Financing.

A graphic here of two arrow shapes that house text inside. The first arrow is titled Project Planning. This arrow points to another arrow titled Financing.

Conduct downside scenarios on value capture revenue projections to understand what is needed to ensure project cashflows can survive periods of stress

The next arrow - titled Financing - is connected to a block of text below:

Prepare for and be flexible in face of tightened financial markets (e.g., Denver Union Station)

A magnifying glass icon is above a block of information, titled 'Assembly Project.'

A photo of a real estate development. There's a gateway pictured with a sign that says 'The Yards.'

Planning showed need for additional funding sources in event of stress

During COVID-19 project's primary funding sources insufficient. Assembly drew on backstop of Special Assessments

Icon for Over-collateralize (coins)
Over-collateralize

Increase the Debt Service Coverage Ratio (DSCR) & Value to Bond Ratio

There is a formula setup that demonstrates an idea. DSCR = Net Operating Income over Annual Debt Payment. Net Operating Income is highlighted in a box.

There is a formula setup that demonstrates an idea. DSCR = Net Operating Income over Annual Debt Payment. Net Operating Income is highlighted in a box.

An arrow comes down from the Net Operating Income box just read in the above formula and leads to a text block below.

Commit additional cash to revenues

There is a formula setup that demonstrates another idea. Value to Bond = Assessed Values over Principal of Bond. Principal of Bond is highlighted in a box.

An arrow comes down from the Principal of Bond box just read in the above formula and leads to a text block below.

Reduce size of bond
Ion - piggy bank
Build in reserve funds

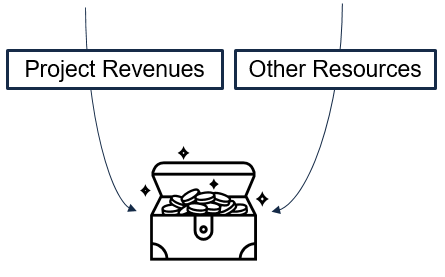
Project Revenues and Other Resources.

Project Revenues and Other Resources. There's a treasure chest icon here. The whole diagram starts at top with 'Build in Reserve Funds.' The two blocks below are Project Revenues and Other Resources and the treasure chest is at bottom. Arrows lead from the top and meet at the chest at bottom.
  • Either at sponsor’s discretion
  • Or, required per financial documents (e.g., Mosaic)


Ion - racing flag
Collect revenues before project start
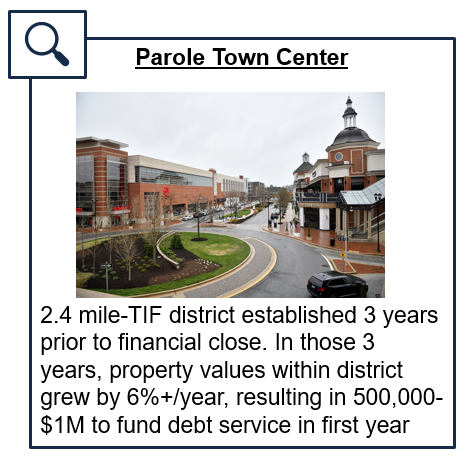
Parole Town Center
Parole Town Center. A photo of the development. Parole master plan envisions more green space and bike paths, less road congestion – Capital Gazette. 2.4 mile-TIF district established 3 years prior to financial close. In those 3 years, property values within district grew by 6%+/year, resulting in 500,000-$1M to fund debt service in first year

Source: Parole Town Center Project, Official Statement 2012, pp19-23


Ion -bills
Reduce early cash flow pressure

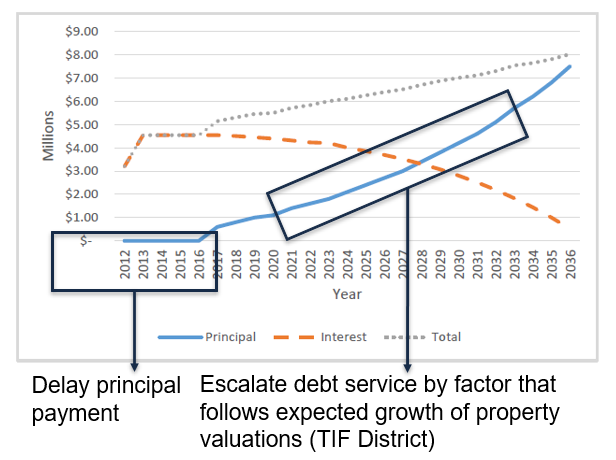
Mosaic Project Total Debt Service Payments 2012-2036
There's a line chart here. The Y axis runs from 1 to 9 million dollars. The X axis runs dates from 2012 out to 2036.

There's a line chart here. The Y axis runs from 1 to 9 million dollars. The X axis runs dates from 2012 out to 2036. The delayed principal payment line is highlighted and it is at zero dollars, running from 2012 to the start of 2017. Then the line starts to move up and is eventually highlighted, roughly from 2021 to 2034 (associated with escalated debt service - TIF District text to follow.). Delay principal payment. Escalate debt service by factor that follows expected growth of property valuations (TIF District)

Capitalize interest one year; or multiple years through capital appreciation bond

Source for underlying data: “$65,650,000 Mosaic District Community Development Authority (Fairfax County, Virginia) Official Statement (OS),” May 26, 2011,p. 15


Ion -bills Ion -bills Ion -bills
Develop projects by phase
  • Allows project to proceed as budgets and debt capacity become available
  • May take longer this way; but can help ensure completion of project


Colorado E-470

Map shown here with train tracks designated with solid fill.

47-mile toll highway forming half of beltway around Denver, CO.

Built in segments in response to economic issues that affected toll and value capture related projects


Ion -wall
Backstop with creditworthy sources

For example, Mosaic shopping & dining complex deployed this tool in case of depression in property values
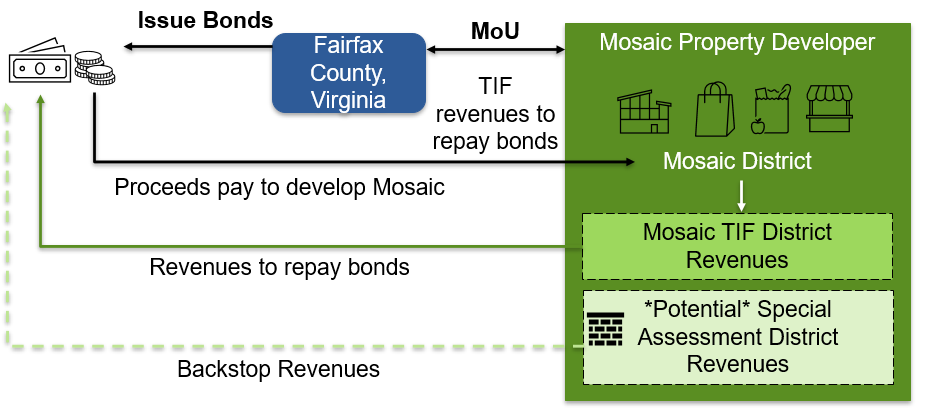
 

A graphic here titled "Mosaic Property Developer."
A graphic here titled "Mosaic Property Developer." It shows a row of icons. A building, a shopping bag, a grocery bag with food, a shop front. "Mosaic District" is the sub-title under the icons. Under that is a block with "Mosaic TIF District Revenues." Lastly is "Potential Special Assessment District Revenues." The graphic shows the relationship between each text/title block and revenues and bonds.


« PreviousNext »