« Previous
6 Annex: Covid-19 Impacts to Value Capture
The Pandemic may affect the future location of major employee occupational group during Pandemic, material number of employees have shifted to working from home (WFH)
This will primarily affect office workers and have implications for transit and real estate
% Office Employees Working in Offices
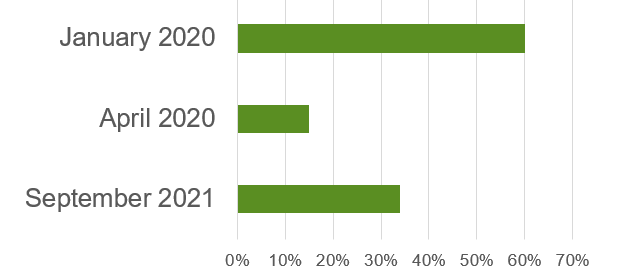
Source: Cushman & Wakefield, “Predicting the Return to the Office,” September 2021,pp. 10 &16
Several studies concluded that WFH Pandemic employee productivity was same as before or higher
13% productivity increase
- Less break time
- Quieter work environment
Source: Bloom, Nicholas et al. “Does Working from Home Work? Evidence From a Chinese Experiment,” The Quarterly Journal of Economics (2015), 165–218.
5% productivity increase
- 1/2 due to real productivity gain
- 1/2 due to reduced commute
Source: Barrero, Jose Maria, “The Work-From-Home Outlook in 2022 and Beyond,” Work From Home Research, January 2022.
Other evidence
- Reduced commute
- Less unproductive "water cooler talk"
- More exercise time
- Quiet spaces for complex work
- Greater work/non-work balance
Shea, Christopher, “No Commute, Less Water Cooler Talk, More Exercise, Maximum Productivity,” The Washington Post, October 14, 2021.
Despite what Elon Musk says, the hybrid—smaller—workplace may become the new normal
- No hybrid work 40% of employees would seek another job*
- Reduce space needs by 10 to 20 percent?
* Source: Grant Thornton, “Grant Thornton Survey: Employees value flexibility over salary increases — one-third looking for new jobs,” October 6, 2021, p.1
Monday |
Tuesday |
Wednesday |
Thursday |
Friday |
Work |
Home |
Work |
Work |
Home |
The nature of the office—purpose, layout, location—may change
More space for team-based work
New layouts: less open plan, more conference & training space
Changing office locations
White-collar employees are more likely to work outside of the office
- Long-term maybe 30% of U.S. work force will WFH some of time
Occupation |
% of U.S. Workforce* |
Type of Work |
WFH Candidate? |
White Collar |
26% |
 |
✓ |
Blue Collar |
23% |
 |
X |
White Coat |
52% |
 |
X? |
* Source: U.S. Bureau of Labor Statistics, “Labor Force Statistics from the Current Population Survey.”
In addition to office, there are other real estate sector losers and winners
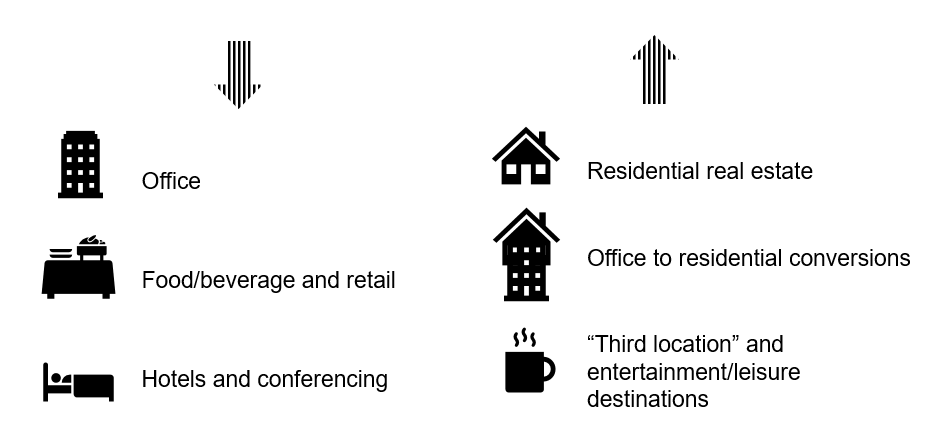
Changing patterns of real estate demand within metropolitan regions may affect real estate growth
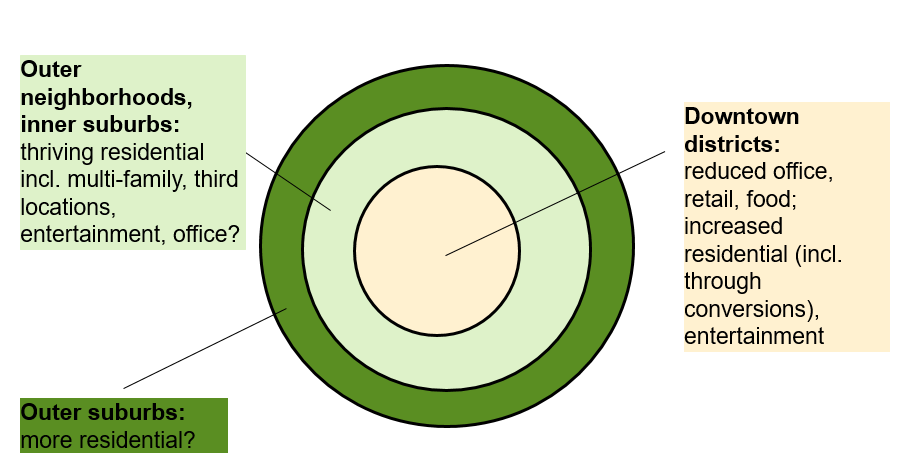
Outer suburbs is the third/outside ring.Outer neighborhoods, inner suburbs: thriving residential incl. multi-family, third locations, entertainment, office? - middle, Downtown districts:
reduced office, retail, food; increased residential (incl. through conversions), entertainment
- center
Real estate is more complicated . . . by region (1/2)
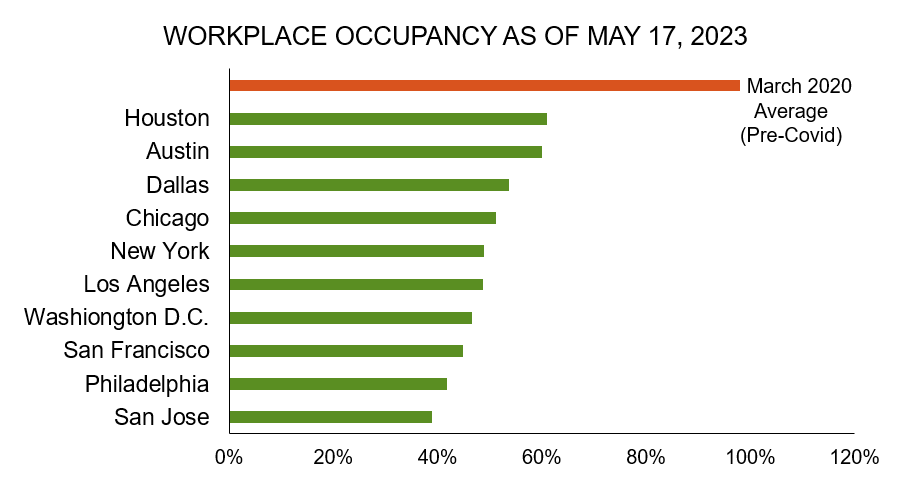
A horizontal bar chart is here. The X axis runs from 0% to 120%, along the bottom of the chart.
The Y axis starts with a bar that goes out to about 95%, labeled March 2020 Average (Pre-Covid)
These cities ar elisted below that bar:
Houston - 62%
Austin - 60%
Dallas - 57%
Chicago - 53%
New York - 51%
Los Angeles - 49%
Washington D.C. - 47%
San Francisco - 45%
Philadelphia - 43%
San Jose - 40%
Source: https://www.kastle.com/safety-wellness/getting-america-back-to-work/, accessed May 23, 2023
Note: Occupancy figure reflects swipes of Kastle access controls
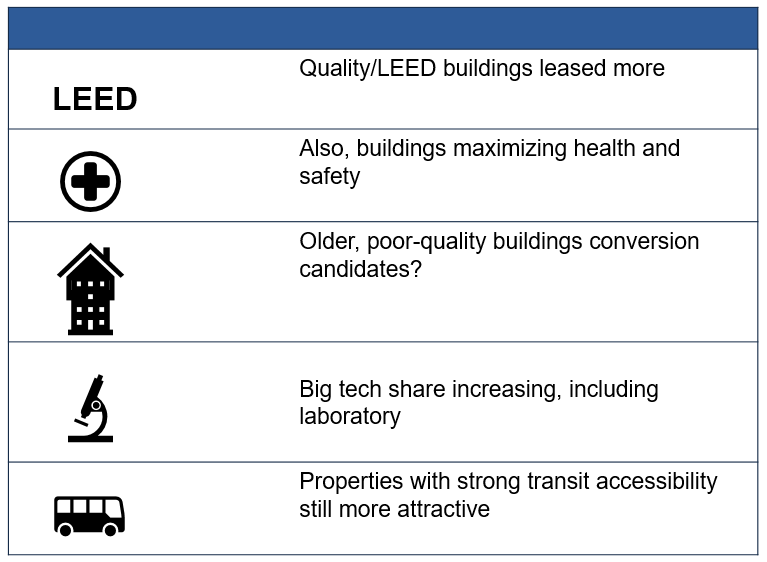
Real estate is more complicated . . . other nuances (2/2)
Impacts to real estate, transit, and value capture
Real estate:
- Office occupancy impaired as firms go hybrid
- Reduction of office days ≠ 1:1 leasing decline
- Changing locations
Transit: fewer passengers and diminished joint development interest in certain locations
Value capture:
- Lower property value appreciation dampens tax increment finance
- Lower assessments hurts special assessments
- Fewer eyeballs decreases naming rights $
Links to Resources
For more information, please contact……………
Thay Bishop
Senior Program Advisor
Center for Innovative Finance Support,
Office Innovative Program Delivery
Thay.Bishop@dot.gov
Stefan Natzke
Lead Community Planner
Office of Planning, Environment & Safety
Stefan.Natzke@dot.gov
« Previous

