U.S. Department of Transportation
Federal Highway Administration
1200 New Jersey Avenue, SE
Washington, DC 20590
202-366-4000
Conditions and Performance
Status
of the Nation's Highways, Bridges, and Transit:
2002 Conditions and Performance Report
|
Exhibit 11-21:
Urban Superstructure Materials by Owner and Functional Classification
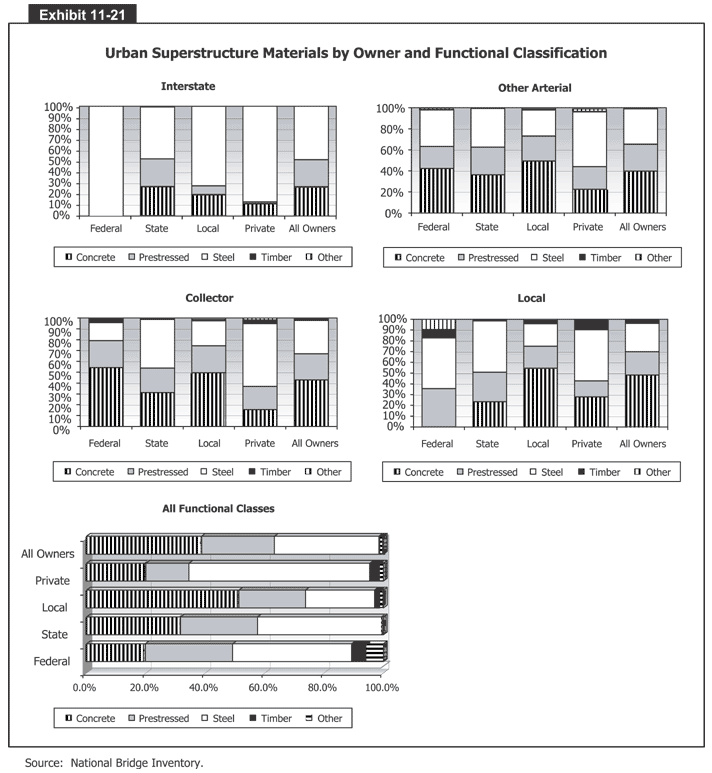 Exhibit 11-21 has five bar graphs that show urban superstructure materials by owner and functional classification. In the first graph, for interstates, the vertical axis measures percentages from 0 to 100 in increments of 10 percent. The horizontal axis has five bars, one for each type of bridge owner. 100 percent of Federal urban interstate superstructures are steel. About 28 percent of State urban interstate superstructures are concrete, 25 are prestressed, and 47 are steel. About 20 percent of local urban interstate superstructures are concrete, 8 are prestressed, and 72 are steel. About 12 percent of privately-owned urban interstate superstructures are concrete and 88 are steel. And among all owners of urban interstate superstructures, about 28 percent are concrete, 25 are prestressed, and 47 are steel. In the second graph, for other arterials, the vertical axis measures percentages from 0 to 100 in increments of 10 percent. The horizontal axis has five bars, one for each type of bridge owner. About 40 percent of Federal urban other arterial superstructures are concrete, 22 are prestressed, 37 are steel, and 1 is timber. About 38 percent of State urban other arterial superstructures are concrete, 24 are prestressed, and 22 are steel. About 48 percent of local urban other arterial superstructures are concrete, 25 percent are prestressed, 25 are steel, and 2 are timber. About 21 percent of privately-owned urban other arterial superstructures are concrete, 21 are prestressed, 55 are steel, and 3 are other. And among all owners of urban other arterial superstructures, about 40 percent are concrete, 23 percent are prestressed, and 37 are steel. In the third graph, for collectors, the vertical axis measures percentages from 0 to 100 in increments of 10 percent. The horizontal axis has five bars, one for each type of bridge owner. About 53 percent of Federal urban collector superstructures are concrete, 27 are prestressed, 16 are steel, and 4 are timber. About 30 percent of State urban collector superstructures are concrete, 23 are prestressed, and 47 are steel. About half of local urban collector superstructures are concrete, 25 percent are prestressed, 23 are steel, and 2 are timber. About 17 percent of privately-owned urban collector superstructures are concrete, 21 are prestressed, 57 are steel, and 2 are timber, and 1 is other. And among all owners of urban collector superstructures, 42 percent are concrete, 25 percent are prestressed, 32 are steel, and 1 is timber. In the fourth graph, for local bridges, the vertical axis measures percentages from 0 to 100 in increments of 10 percent. The horizontal axis has five bars, one for each type of bridge owner. About 37 percent of Federal urban local superstructures are prestressed, 43 are steel, 9 are timber, and 11 are other. About 23 percent of State urban local superstructures are concrete, 27 are prestressed, 49 are steel, and 1 is timber. About 55 percent of locally-owned urban local superstructures are concrete, 20 percent are prestressed, 20 are steel, and 5 are timber. About 28 percent of privately-owned urban local superstructures are concrete, 15 are prestressed, 45 are steel, and 12 are timber. And among all owners of urban local superstructures, about half are concrete, 20 percent are prestressed, 38 are steel, and 12 are timber. And in the fifth graph, for all functional classes, the vertical axis has five bars for the owners and the horizontal bars measures percentages from 0 to 100 in increments of 20 percent. About 18 percent of Federal urban superstructures are concrete, 30 are prestressed, 40 are steel, and 2 are other. About 30 percent of State urban superstructures are concrete, 28 are prestressed, and 42 are steel. About half of local urban superstructures are concrete, 19 percent are prestressed, 19 are steel, 1 is timber, and 1 is other. About 20 percent of privately-owned urban superstructures are concrete, 17 are prestressed, 60 are steel, 2 are timber, and 1 is other. And among all owners of urban superstructures, about 38 percent are concrete, 23 are prestressed, 38 are steel, and 1 is other.
Source: National Bridge Inventory.
Back
to Chapter 11
Return to top
Page last modified on November 7, 2014

