U.S. Department of Transportation
Federal Highway Administration
1200 New Jersey Avenue, SE
Washington, DC 20590
202-366-4000
Conditions and Performance
Status
of the Nation's Highways, Bridges, and Transit:
2002 Conditions and Performance Report
|
Exhibit 6-5:
Percent of Highway Revenue Derived From User Charges, for each Level of Government,
1957-2000
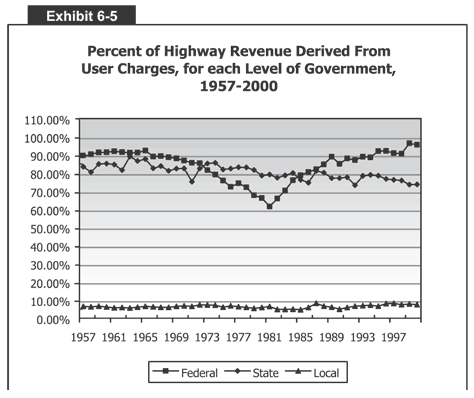 Exhibit 6-5 includes a chart that shows the percentage of highway revenue derived from user charges for each level of government-Federal, State, and Local-between 1957 and 2000. The vertical axis measures percentages from 0 to 110 in increments of 10 percent. The horizontal axis measures the years 1957 to 2000 in increments of 4 years. The Federal line goes between 90 and 93 percent from 1957 to 1969 before steadily declining to a low of 62 percent in 1981. From there it rises steadily to a peak of 98 percent by 2000. The State line parallels the Federal one, except where it intersects twice. It fluctuates between 79 and 90 percent between 1957 and 1988 (except for 1972, when it dropped to about 75 percent), then plateaus between 73 and 80 percent from 1989 to 2000. The local line is constantly between 5 and 9 percent from 1957 to 2000.
Source: Highway Statistice Summary to 1995 Table HF-210; Highway Statistics, various
years Tables HF-10A and HF-10.
Back
to Chapter 6
Return to top
Page last modified on November 7, 2014

