U.S. Department of Transportation
Federal Highway Administration
1200 New Jersey Avenue, SE
Washington, DC 20590
202-366-4000
Conditions and Performance
Status
of the Nation's Highways, Bridges, and Transit:
2002 Conditions and Performance Report
|
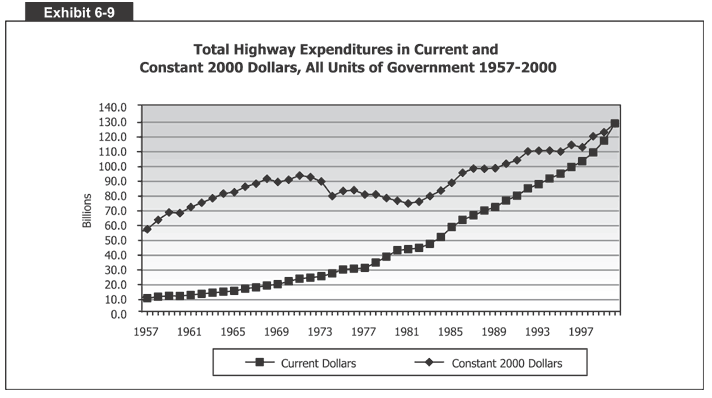
Exhibit 6-9:
Total Highway Expenditures in Current and Constant 2000 Dollars, All Units of
Government 1957-2000
 Exhibit 6-9 includes a chart that shows total highway expenditures in current and constant 2000 dollars for all units of government between 1957 and 2000. The vertical axis measures billions of dollars from 0 to 140 in increments of 10 billion. The horizontal axis measures the years from 1957 to 2000 in increments of 4 years. The first of two lines, for constant 2000 dollars, starts at about $57 billion in 1957, steadily rising to more than $90 billion by 1972. From there it dips gradually to about $75 billion in 1980, then gradually rises to a peak of $130 billion by 2000. The line for current dollars starts at $10 billion in 1957 and steadily increases to $50 billion by 1983. From there, the curve takes an even sharper rise, ending at $130 billion in 2000.
Back
to Chapter 6
Return to top
Page last modified on November 7, 2014
