U.S. Department of Transportation
Federal Highway Administration
1200 New Jersey Avenue, SE
Washington, DC 20590
202-366-4000
|
Status
of the Nation's Highways, Bridges, and Transit:
2002 Conditions and Performance Report |

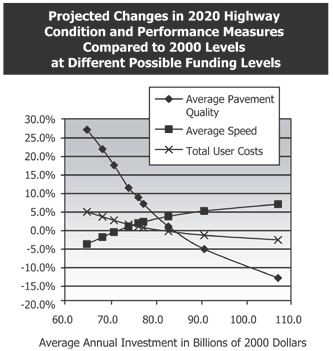
Exhibit ES16A is a chart that shows projected changes in 2020 highway condition and performance measures compared to 2000 levels at different possible funding levels. The vertical axis measures percentages from -20 percent to 30 percent in increments of 5 percent. The horizontal axis measures average annual investment in billions of 2000 dollars from 60 to 110 in increments of $10 billion. The graph shows projected changes in average pavement roughness, average
speed, and total highway user costs between 2000 and 2020 at various levels
of investment. At lower levels of investment, user costs and pavement
roughness would be higher in 2020 than in 2000, while average speeds would
be lower. At higher levels of investment, average pavement roughness and
total user costs would be lower in 2020 than in 2000, while average speeds
would be higher.
Back
to Executive Summary