

- The National Bridge Inspection Program and the Highway Bridge Replacement and Rehabilitation Program
- Overview and Evolution of the Bridge Programs
- Information Collected Through the Bridge Inspection Program
- Composition of the Bridge Network
- Bridges by ADT
- Bridges by Functional Classification
- Bridges by Age of Construction
- Bridges by Type of Superstructure Material
- Conditions of Bridges
- Actions Taken to Remove Deficiencies
- Conclusions
Conditions of Bridges
In Chapter 3, an overview of the condition of the highway bridge network was presented. Chapter 17 presented information on structural deficiencies and functional obsolescence for high and low-volume NHS and non-NHS mobility measure categories.
Structural deficiencies and functional obsolescence are not mutually exclusive, and a bridge may have both types of deficiencies. When deficiency percentages are presented, however, bridges are indicated as being structurally deficient, functionally obsolete, or nondeficient. As structural deficiencies may imply safety problems, they are considered more critical; thus, a bridge that is both structurally deficient and functionally obsolete is identified only as structurally deficient. Approximately 50 percent of the structurally deficient population also will have functional issues that must be addressed. Bridges that are indicated as functionally obsolete do not have structural deficiencies.
| Q. | What makes a bridge structurally deficient, and are structural deficient bridges unsafe? |
| A. | Bridges are considered structurally deficient if significant load carrying elements are found to be in poor or worse condition due to deterioration and/or damage or, the adequacy of the waterway opening provided by the bridge is determined to be extremely insufficient to point of causing intolerable traffic interruptions. The fact that a bridge is "deficient" does not immediately imply that it is likely to collapse or that it is unsafe. With hands-on inspection, unsafe conditions may be identified and, if the bridge is determined to be unsafe, the structure must be closed. A "deficient" bridge, when left open to traffic, typically requires significant maintenance and repair to remain in service and eventual rehabilitation or replacement to address deficiencies. In order to remain in service, structurally deficient bridges are often posted with weight limits to restrict the gross weight of vehicles using the bridges to less than the maximum weight typically allowed by statute. |
Overall, there are 162,869 bridges that are deficient within the highway bridge network. This represents 27.5 percent of the total inventory of highway bridges when bridges are weighted equally. The overall percentage of deficiencies is roughly the same when considering traffic carried (27 percent deficient) and deck area (27.5 percent deficient). Over 1 billion vehicles cross deficient bridges daily, and close to 90 million square meters of deck area are on deficient bridges.
Exhibit 15-12 shows the percentage of structurally deficient (SD) and functionally obsolete (FO) bridges by functional classification and owner. The overall percentage of structurally deficient bridges is approximately equal to the percentage of functionally obsolete bridges. There are nearly twice as many functionally obsolete bridges across all functional classifications for State and Federal owners. For bridges owned by local agencies, private entities, and others, the number of structural deficiencies outweigh the number of functionally obsolete bridges.
Deficiencies can be examined by functional classification irrespective of ownership. With bridges carrying higher functional classifications, such as the Interstates and arterials, the percentages of structural deficiencies is significantly lower than the percentages of functionally obsolete bridges. For bridges carrying collector roadways, the percentage of structurally deficient bridges is roughly equal to the percentage of functionally obsolete bridges. For bridges carrying local roadways, 20 percent are structurally deficient, outweighing the 12.7 percent functionally obsolete.
| Description | State # of Bridges %SD / %FO | Local # of Bridges %SD / %FO | Federal # of Bridges %SD / %FO | Other # of Bridges %SD / %FO | All # of Bridges %SD / %FO |
|---|---|---|---|---|---|
| Rural | |||||
| Interstate | 27283 4.0% / 11.7% | 10 10.0% / 30.0% | 18 0.0% / 5.6% | 5 0.0% / 40.0% | 27316 4.0% / 11.8% |
| Other Principal Arterial | 34686 5.4% / 9.5% | 300 7.0% / 13.7% | 55 5.5% / 25.5% | 186 2.2% / 4.3% | 35227 5.4% / 9.6% |
| Minor Arterial | 36682 8.5% / 11.1% | 2414 9.0% / 12.2% | 402 17.2% / 15.2% | 89 22.5% / 25.8% | 39587 8.6% / 11.2% |
| Major Collector | 52737 11.2% / 13.5% | 41742 13.1% / 7.3% | 179 13.4% / 10.6% | 123 34.2% / 19.5% | 94781 12.1% / 10.8% |
| Minor Collector | 16602 12.4% / 13.9% | 31423 14.7% / 9.7% | 1178 5.7% / 17.4% | 117 38.5% / 12.0% | 49320 13.8% / 11.3% |
| Local | 28177 14.3% / 16.9% | 173578 22.6% / 11.0% | 7255 7.5% / 15.0% | 712 39.8% / 22.3% | 209722 21.1% / 11.9% |
| All Classes | 196167 9.2% / 12.6% | 249467 19.9% / 10.2% | 9087 7.8% / 15.2% | 1232 32.0% / 18.7% | 455953 15.1% / 11.4% |
| Urban | |||||
| Interstate | 27601 6.0% / 20.0% | 307 21.2% / 30.6% | 2 50.0% / 0.0% | 19 0.0% / 26.3% | 27929 6.1% / 20.1% |
| Other Freeways and Expressways | 15429 6.1% / 20.3% | 970 8.9% / 26.3% | 2 0.0% / 0.0% | 443 0.5% / 10.8% | 16844 6.1% / 20.4% |
| Other Principal Arterial | 18785 8.9% / 20.9% | 5317 10.3% / 27.5% | 17 11.8% / 29.4% | 188 22.3% / 16.5% | 24307 9.4% / 22.3% |
| Minor Arterial | 11939 10.8% / 27.7% | 12288 10.0% / 24.6% | 42 26.2% / 11.9% | 247 28.7% / 27.5% | 24516 10.6% / 26.1% |
| Collector | 5086 11.6% / 30.7% | 9850 11.1% / 21.9% | 20 20.0% / 30.0% | 215 23.3% / 27.4% | 15171 11.5% / 24.9% |
| Local | 4956 10.4% / 29.6% | 21096 11.8% / 16.1% | 195 10.8% / 34.4% | 362 31.2% / 23.2% | 26609 11.8% / 18.8% |
| All Classes | 83796 8.0% / 22.6% | 49828 11.1% / 20.8% | 278 14.0% / 29.9% | 1474 18.9% / 20.0% | 135376 9.2% / 21.9% |
| All: Rural and Urban | |||||
| Interstate | 54884 5.0% / 15.9% | 317 20.8% / 30.6% | 20 5.0% / 5.0% | 24 0.0% / 29.2% | 55245 5.1% / 16.0% |
| Other Principal Arterials | 68900 6.5% / 15.0% | 6587 10.0% / 26.7% | 74 6.8% / 25.7% | 817 5.9% / 10.6% | 76378 6.8% / 16.0% |
| Minor Arterials | 48621 9.0% / 15.2% | 14702 9.9% / 22.5% | 444 18.0% / 14.9% | 336 27.1% / 27.1% | 64103 9.4% / 16.9% |
| Collectors | 74425 11.5% / 14.8% | 83015 13.5% / 9.9% | 1377 6.9% / 16.7% | 455 30.1% / 21.3% | 159272 12.5% / 12.3% |
| Local | 33133 13.7% / 18.8% | 194674 21.5% / 11.5% | 7450 7.6% / 15.5% | 1074 36.9% / 22.6% | 236331 20.0% / 12.7% |
| All Classes | 279963 8.8% / 15.6% | 299295 18.4% / 12.0% | 9365 8.0% / 15.7% | 2706 24.8% / 19.4% | 591329 13.7% / 13.8% |
FO = Functionally Obsolete
Rural functional classifications and ownership percentages follow the same general trend as the overall population. With bridges carrying higher functional classifications, such as Interstates and principal arterials, functional obsolescence percentages exceed the structural deficiency percentages. The reverse is true for bridges carrying lower functional classification roadways in rural environments where the structural deficiencies outweigh the functional issues. In the urban environment, functional obsolescence percentages were higher than structural deficiency percentages for all functional classifications and for all owners.
Exhibit 15-13 shows the percent of structural deficiencies and functional obsolescence where bridges are weighted using different methods. Percentages determined by equal weighting through counting of the number of bridges are compared with percentages where bridges are weighted by ADT and deck area. In general, if the percent deficiencies by ADT are higher than those determined using number of bridges, it may be inferred that the deficiencies are occurring on bridges with higher-than-average traffic volumes. Likewise, where the deck area percentages exceed the percentages determined by numbers, it may be inferred that the deficiencies are occurring on bridges with higher-than-average deck areas. For both cases, the converse is also true; with lower percentages, it may be inferred that the deficiencies are occurring on bridges with lower-than-average traffic or area.
The stacked bars in Exhibit 15-13 allow evaluation and comparison of deficiencies. For both rural and urban structures, percentages of deficiencies increase for the lower functional classifications. Bridges carrying principal arterials clearly have lower deficiency percentages than bridges carrying local roadways. Percentages of functionally obsolete bridges remain relatively constant across the functional classifications, and the increases shown are primarily attributable to structural deficiencies.
Actions Taken to Remove Deficiencies
Over $60 billion in HBRRP funding alone has been allocated and utilized to ensure safety and continuing functionality of the bridge network. Historically, HBRRP funds have been utilized only for repair, rehabilitation, or replacement of deficient bridges. An examination of bridge construction and bridge rehabilitation activity with Federal fund participation, including HBRRP and other funding programs through 1998 reveals the following:
- Over 50 percent of all activity focuses on replacement of deficient bridges.
- Approximately 40 percent of activity is used for major or minor rehabilitation of deficient bridges.
- The remaining 10 percent of activity is used for new bridge construction.
In 1990, 17 percent of activity with Federal fund participation involved new bridge construction. This percentage has decreased from 1990 to 1998, and today approximately 90 percent of all projects receiving Federal fund participation involve reconstruction or rehabilitation.
Exhibit 15-14 shows the number and percent of deficient bridges reconstructed, as indicated in the NBI database. The information is presented by functional classification, rural/urban designation, and owner. The average number of years before the reconstruction was undertaken is also indicated.
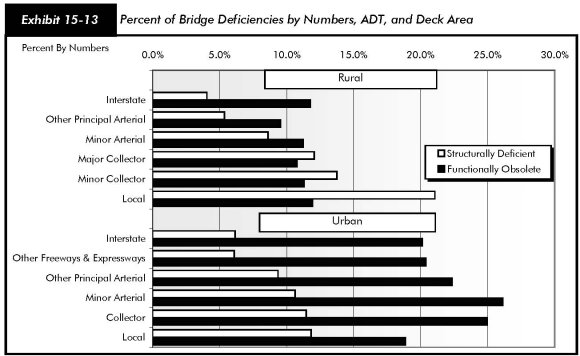
| Functional Classification | % by Numbers | % by ADT | % by Area | |||
|---|---|---|---|---|---|---|
| SD | FO | SD | FO | SD | FO | |
| Rural | ||||||
| Interstate | 4.0% | 11.8% | 4.5% | 10.8% | 4.9% | 9.7% |
| Other Principal Arterials | 5.4% | 9.5% | 5.4% | 10.3% | 6.8% | 10.4% |
| Minor Arterial | 8.6% | 11.2% | 8.8% | 15.2% | 9.8% | 12.9% |
| Major Collector | 12.1% | 10.8% | 10.4% | 18.8% | 11.4% | 11.1% |
| Minor Collector | 13.8% | 11.3% | 11.7% | 20.0% | 10.9% | 10.6% |
| Local | 21.1% | 11.9% | 11.8% | 26.3% | 14.7% | 13.0% |
| Urban | ||||||
| Interstate | 6.1% | 20.1% | 6.9% | 19.3% | 9.0% | 22.0% |
| Other Freeways & Expressways | 6.1% | 20.4% | 7.4% | 19.6% | 8.8% | 20.1% |
| Other Principal Arterial | 9.4% | 22.3% | 9.8% | 23.1% | 12.1% | 23.7% |
| Minor Arterial | 10.6% | 26.1% | 9.7% | 27.9% | 11.8% | 25.5% |
| Collector | 11.5% | 24.9% | 10.2% | 28.8% | 10.8% | 25.6% |
| Local | 11.8% | 18.8% | 8.5% | 31.8% | 10.1% | 26.8% |
Historically, Interstate bridges undergo rehabilitation approximately 22 years after they are placed in service. The time to rehabilitation is longer for other functional classifications. Bridges carrying higher functional classifications, such as Interstates and principal arterials, are rehabilitated sooner than bridges carrying lower functional classifications, such as collectors and local routes. This trend is seen for rural and urban functional classifications for all owners and does not necessarily apply for all owner/functional classification combinations.
| Functional Class | State | Local | Federal | Other | All |
|---|---|---|---|---|---|
| Rural | |||||
| Interstate | 6220 23% / 21 | 2 20% / 49 | 1 6% / 25 | 0 0% / 0 | 6223 23% / 21 |
| Other Principal Arterial | 7526 22% / 30 | 51 17% / 34 | 16 29% / 33 | 61 33% / 29 | 7654 22% / 30 |
| Minor Arterial | 8012 22% / 33 | 287 12% / 36 | 36 9% / 28 | 8 9% / 60 | 8343 21% / 33 |
| Collector | 8189 12% / 27 | 7312 10% / 41 | 88 6% / 36 | 40 17% / 49 | 15629 11% / 34 |
| Local | 2335 8% / 27 | 18576 11% / 40 | 1646 23% / 17 | 77 11% / 43 | 22634 11% / 37 |
| Urban | |||||
| Interstate | 6782 25% / 23 | 66 21% / 25 | 2 100% / 37 | 2 11% / 28 | 6852 25% / 23 |
| Other Principal Arterial | 7272 21% / 29 | 1315 21% / 33 | 5 26% / 38 | 100 16% / 32 | 8692 21% / 29 |
| Minor Arterial | 2115 18% / 30 | 2153 18% / 36 | 4 10% / 39 | 49 20% / 62 | 4321 18% / 33 |
| Collector | 713 14% / 29 | 1311 13% / 37 | 4 20% / 17 | 49 23% / 65 | 2077 14% / 35 |
| Local | 512 10% / 27 | 2140 10% / 38 | 56 29% / 30 | 65 18% / 48 | 2773 10% / 36 |
| All: Rural and Urban | |||||
| Interstate | 13002 24% / 22 | 68 21% / 26 | 3 15% / 33 | 2 8% / 28 | 13075 24% / 22 |
| Other Principal Arterial | 14798 21% / 29 | 1366 21% / 33 | 21 28% / 34 | 161 20% / 31 | 16346 21% / 29 |
| Minor Arterial | 10127 21% / 33 | 2440 17% / 36 | 40 9% / 29 | 57 17% / 61 | 12664 20% / 33 |
| Collector | 8902 12% / 27 | 8623 10% / 40 | 92 7% / 35 | 89 20% / 58 | 17706 11% / 34 |
| Local | 2847 9% / 27 | 20716 11% / 40 | 1702 23% / 17 | 142 13% / 45 | 25407 11% / 37 |
Progress has been made in reducing the deficiencies. More than 85,000 structures (15 percent of the inventory) have been reconstructed or rehabilitated and are in service today. These reconstruction and rehabilitation efforts have contributed to the reduction in deficiencies discussed in Chapter 3.
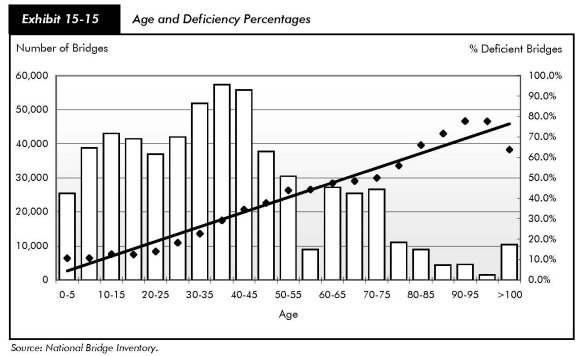
Exhibit 15-15 shows the relationship between bridge age and the percentage of bridges that are classified as deficient. When a structure is placed in service, the deterioration process begins on the components of the bridge. As bridges age, increasing numbers of structures become deficient and increasing funds are required to address these deficiencies. This is a concern with the increasing age of the large Interstate population and the relatively short period of time for the average reconstruction effort on Interstate bridges. With this ever-aging, continually deteriorating population of highway structures, increasing traffic demands, and limited budgets, the FHWA and the Nation need to take a closer look at transportation system preservation strategies. This includes increased activity in preventative maintenance and improved bridge inspection and management techniques to continue to ensure the safety of the motoring public and effective stewardship of the public trust.
Conclusions
As can be seen from the information presented in this chapter, the Nation's bridges are aging and traffic demands are increasing. Asset management principles through bridge management systems and transportation system preservation techniques are becoming more important as the States, locals, and Federal government struggle to maintain the safe condition of the Nation's bridges, while at the same time providing for increased demands on the highway bridge network. Improved bridge inspection techniques, through the use of new and innovative equipment, are needed to better ensure the safety of the motoring public. Longer design life structures, using the latest material and design technologies, are needed so that the Nation can maintain a safe bridge network that provides the life span needed to avoid congestion and improve safety of the highway bridge network. Such goals can be achieved only through an emphasis on fundamental long-term research.