


- Background
- System and Use Characteristics: Highways
- Physical Conditions: Highways
- System and Use Characteristics: Bridges
- Physical Conditions: Bridges
- Operational Performance
- Finance
- Capital Investment Requirements
- Rural NHS Routes
- Urban NHS Routes
- Bridge Preservation
- Current Spending Versus Investment Requirements
National Highway System
This chapter provides a snapshot of the physical conditions, operational performance, finance, and investment requirements of the National Highway System (NHS). The NHS includes the Interstate System as well as other routes most critical to national defense, mobility, and commerce. This chapter represents a supplementary analysis to the information presented for all highways and bridges in Chapters 2, 3, 4, 6, 7, 8, and 9.
Background
The Intermodal Surface Transportation Efficiency Act of 1991 (ISTEA) required Congress to establish an NHS by September 30, 1995. ISTEA authorized a NHS of up to 178,250 miles. The purpose of the NHS was to focus Federal resources on roads that are the most important to interstate travel and national defense, that connect with other modes of transportation, and that are essential for international commerce.
Although ISTEA required that certain key routes, such as the Interstate System, be included in the NHS, most of the NHS was not specified. The Federal Highway Administration (FHWA) worked with its State and local partners, public and private interest groups, and other agencies within the Department of Transportation to identify potential NHS routes. The National Highway System Designation Act of 1995, which became law on November 28, 1995, identified a 160,955-mile network. Additions to the NHS have been made since the initial authorization.
The NHS has five components. The Interstate System, described in Chapter 16, is the core of the NHS and includes the most-traveled routes. Many other rural and urban principal arterials, described in Chapter 2, are also included. The Strategic Highway Network (STRAHNET), described in Chapter 18, includes highways important to military mobilization. STRAHNET connectors, also described in Chapter 18, provide access between major military installations and routes that are part of STRAHNET. Intermodal connectors are highways that provide access between major intermodal passenger and freight facilities and the other four subsystems making up the NHS.
The NHS was designed to be a dynamic system able to change in response to future travel and trade demands. The Secretary of Transportation may approve modifications to the system without Congressional approval. States must cooperate with local and regional officials in proposing modifications. In metropolitan areas, local and regional officials must act through metropolitan planning organizations when proposing modifications.
System and Use Characteristics: Highways
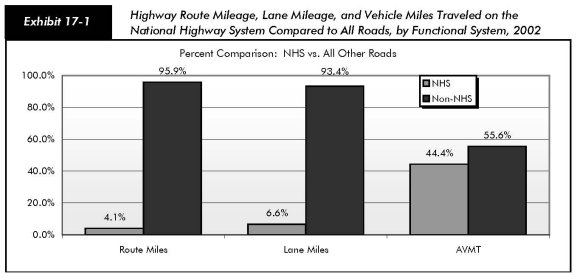
Exhibit 17-1 summarizes NHS route miles, lane miles, and vehicle miles traveled (VMT), including all five NHS components listed above. The NHS is overwhelmingly concentrated on higher functional systems. All Interstates are part of the NHS, 84.0 percent of rural other principal arterials are part of the NHS, and 87.1 percent of urban other freeways and expressways and 35.7 percent of urban other principal arterials are on the NHS. The share of minor arterials, collectors, and local roads on the NHS is relatively small. There are currently 161,538 route miles on the NHS, excluding some sections not yet open to traffic.
| Route Miles | Lane Miles | Annual Vehicle-Miles Traveled (Millions) | ||||
|---|---|---|---|---|---|---|
| Total on NHS | Percent of Functional System | Total on NHS | Percent of Functional System | Total on NHS | Percent of Functional System | |
| Rural NHS | ||||||
| Interstate | 33,107 | 100.0% | 135,032 | 100.0% | 281,461 | 100.0% |
| Other Principal Arterials | 83,153 | 84.0% | 220,431 | 86.0% | 226,736 | 87.9% |
| Minor Arterial | 1,935 | 1.4% | 4,847 | 1.7% | 4,558 | 2.6% |
| Major Collector | 745 | 0.2% | 1,633 | 0.2% | 1,391 | 0.6% |
| Minor Collector | 24 | 0.0% | 48 | 0.0% | 26 | 0.0% |
| Local | 46 | 0.0% | 88 | 0.0% | 36 | 0.0% |
| Subtotal Rural NHS | 119,009 | 3.9% | 362,078 | 5.7% | 514,208 | 45.4% |
| Urban NHS | ||||||
| Interstate | 13,640 | 100.0% | 75,864 | 100.0% | 412,481 | 100.0% |
| Other Freeway and Expressway | 8,170 | 87.1% | 38,423 | 88.4% | 175,824 | 92.2% |
| Other Principal Arterial | 19,151 | 35.7% | 70,818 | 37.6% | 166,762 | 40.6% |
| Minor Arterial | 1,129 | 1.2% | 3,412 | 1.4% | 5,791 | 1.7% |
| Collector | 312 | 0.3% | 835 | 0.4% | 1,173 | 0.8% |
| Local | 127 | 0.0% | 299 | 0.0% | 238 | 0.1% |
| Subtotal Urban NHS | 42,529 | 4.7% | 189,653 | 9.3% | 762,269 | 43.8% |
| Total NHS | 161,538 | 4.1% | 551,731 | 6.6% | 1,276,477 | 44.4% |
While only 4.1 percent of the Nation's total road mileage is on the NHS, these roads carry 44.4 percent of VMT. This represents an increase since 1997, when 43.5 percent of total VMT were on the NHS. The 551,731 lane miles on the NHS in 2002 represented 6.6 percent of the national total, reflecting the fact that NHS routes are wider on average than non-NHS routes.
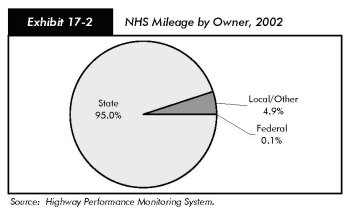
Exhibit 17-2 describes the ownership of NHS mileage. Approximately 95.0 percent of route miles were State-owned in 2002. Only 4.9 percent were locally owned, and the remaining 0.1 percent were owned by the Federal government. By comparison, Exhibit 2 2 in Chapter 2 shows that 19.5 percent of all route miles in the United States were State-owned, 77.5 percent were locally owned, and 3.0 percent were owned by the Federal government. Since the NHS is concentrated on higher functional systems, the percentage of locally owned NHS routes is relatively small.
Physical Conditions: Highways
The FHWA's 1998 National Strategic Plan introduced a new measure of pavement condition: "acceptable ride quality." This measure is described more comprehensively in Chapter 3. The National Strategic Plan stated that by 2008, 93 percent of NHS mileage should meet pavement standards for "acceptable ride quality." This goal was achieved in 1999 [see Exhibit 17-3].
The FHWA has adopted a new metric based on the percent of VMT on "acceptable" pavement, also described in Chapter 3. By adopting this metric, FHWA has broadened its emphasis to include the benefits of good surface quality to the user. In its FY 2005 Performance Plan, FHWA aimed to have 93.5 percent of VMT on NHS be on pavements rated "acceptable" or better by 2005. The VMT on NHS pavements with "acceptable ride quality" declined slightly between 2000 and 2002, as described in Exhibit 17-3.
Routes on the NHS tend to have better overall pavement condition than the remainder of the highway system pavement. In 2002, the percent of NHS route miles with acceptable ride quality was 93.7 compared to 87.4 percent for the total highway system. With regard to VMT, 90.6 percent on the NHS was on pavement with acceptable or better ride quality compared with 85.3 percent for the total highway system.
| 1995 | 1997 | 1999 | 2000 | 2002 | |
|---|---|---|---|---|---|
| Total VMT on NHS | 2,773,938,956 | 3,033,588,343 | 3,241,907,944 | 3,312,712,815 | 3,475,416,799 |
| Total VMT on NHS Acceptable Pavements | 2,468,437,385 | 2,703,589,578 | 2,937,581,806 | 3,013,107,389 | 3,147,569,206 |
| Total Miles of NHS | 154,254 | 157,749 | 159,123 | 159,012 | 161,538 |
| Total Miles of NHS with Acceptable Ride Quality | 139,450 | 144,766 | 147,926 | 148,684 | 151,361 |
| Percent VMT on NHS Acceptable Pavements | 89.0% | 89.1% | 90.6% | 91.0% | 90.6% |
| Percent Miles of NHS Pavement with Acceptable Ride Quality | 90.4% | 91.8% | 93.0% | 93.5% | 93.7% |
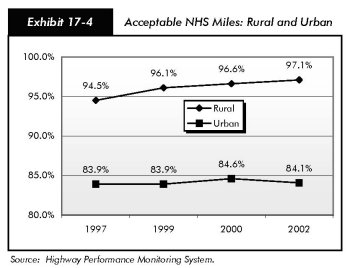
Rural NHS routes tend to have better pavement conditions than urban NHS routes, which is consistent with the results reported for all roads in Chapter 3. As shown in Exhibit 17-4, in 2002 97.1 percent of rural NHS route miles had acceptable ride quality, compared to only 84.1 percent of urban NHS route miles. Rural NHS ride quality has risen more consistently since 1997 than has urban NHS ride quality.
| Q. | What is the condition of the intermodal connectors on the National Highway System? |
| A. | A 2000 FHWA report to Congress on the condition and performance of intermodal connectors found that there were 517 freight-only terminals representing port (ocean and river), truck/rail, and pipeline/truck facilities. In addition to these freight-only terminals, 99 major freight airports (which handle both passenger and freight) were included in the list of freight intermodal terminals. The majority of mileage is in urban areas and is classified as arterials. The report made several conclusions about physical deficiencies of these connectors. First, connectors to ports were found to have twice the percentage of mileage with pavement deficiencies when compared to non-Interstate NHS routes. Connectors to rail terminals had 50 percent more deficient mileage than non-Interstate NHS routes. Connectors to airport and pipeline terminals appeared to be in better condition with about the same percent of mileage with pavement deficiencies as those on non-Interstate NHS. This may be due to the high volume of passenger travel on airport roads. Second, problems with shoulders, inadequate turning radii, and inadequate travel way width were most often cited as geometric and physical deficiencies with connectors. Data were not available to directly compare connectors and other NHS routes with regard to rail crossings, lane width, and other deficiencies. A general comparison of functional class attributes suggests that lane width, cross section, and design attributes are significantly more deficient when compared to non-Interstate NHS mainline routes. See chapter 25 of the 2002 edition of the C&P report for additional details. |
System and Use Characteristics: Bridges
Historically, bridge performance measures have been based almost exclusively on the number of bridges, with the number of deficient bridges giving an indication of the status of the inventory. However, this creates a situation in which the condition of a bridge on the Interstate System with average daily traffic (ADT) of 100,000 vehicles has the same weight as a bridge on a local road that carries 100 vehicles per day. While all bridges in the system are important; from a national perspective, the structure carrying 100,000 vehicles daily contributes more toward the overall mobility of the traveling public. As discussed in Chapter 3, bridge performance measures can be weighted by deck area and/or travel volume to give a more balanced perspective on the overall state of the Nation's bridges.
To guide management of the bridge inventory and improve the system by reducing the amount of deck area on deficient bridges, the performance goals in FHWA's annual performance plans have been subdivided into four categories to better reflect the relative importance of the bridges in improving user mobility. The four categories were developed based on ADT and NHS designation as follows:
High-Volume NHS Bridges – ADT greater than or equal to 50,000
Low-Volume NHS Bridges – ADT less than 50,000
High-Volume Non-NHS Bridges – ADT greater than or equal to 10,000
Low-Volume Non-NHS Bridges – ADT less than 10,000
As shown in Exhibit 17-5, the 114,587 NHS structures constitute 19.4 percent of all bridges in terms of numbers, but carry 71.0 percent of the total daily traffic volume serviced by the bridge inventory. Among the NHS structures, 14,651 bridges carry 50,000 or more vehicles daily and are classified as "high-volume NHS bridges." These structures comprise 12.7% of the NHS bridges in terms of numbers, but carry half of the total daily traffic serviced by the NHS inventory. The remaining 99,936 NHS bridges carrying the other half of the daily traffic volume are classified as "low-volume NHS bridges."
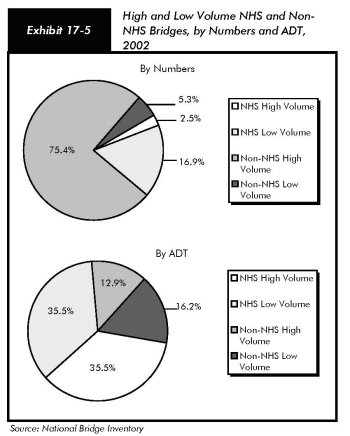
The 477,053 non-NHS bridges comprise 80 percent of all bridges by numbers, but carry 30 percent of the total daily traffic volume serviced by the bridge inventory. There are 31,176 non-NHS bridges carrying 10,000 vehicles or more daily. These structures, classified as "high-volume non-NHS bridges" carry 55 percent of the total daily traffic serviced by non-NHS bridges in the inventory. The 445,877 "low-volume non-NHS bridges" (93% of all non-NHS bridges) carry 45% of the total ADT serviced by non-NHS bridges.
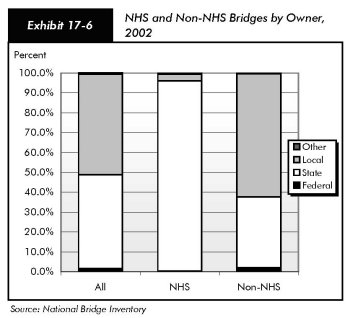
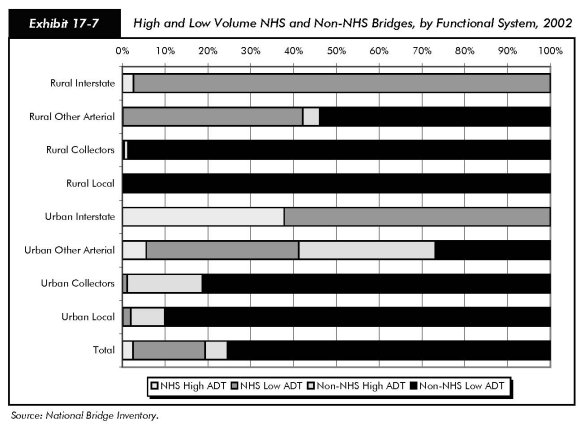
As shown in Exhibit 17-6, the vast majority of NHS structures (95.9 percent) are owned by State agencies, while the majority of non-NHS bridges (62.0 percent) are owned by local agencies. Exhibit 17-7 shows NHS and non-NHS bridges by functional system and ADT level. Most NHS bridges are on higher-ordered functional systems with higher traffic volumes.
Physical Conditions: Bridges
The percentages of structurally deficient and functionally obsolete bridges on the NHS compared with non-NHS system bridges are shown in Exhibit 17-8 for high-and low-volume bridges in each of the established performance categories. To consider the traffic carried, percentages are shown where bridges are weighted by the ADT carried by the structures. To consider the size of the structure, bridges are weighted by the deck area. The impacts of considering these variables on the deficiency percentages may be determined by comparing the respective percentages to those determined by numbers where bridges are equally weighted. See Chapter 3 for a more detailed discussion of bridge conditions and the definitions of the terms "structurally deficient" and "functionally obsolete."
| Category | Total | Structurally Deficient | Functionally Obsolete | Percent Structurally Deficient |
Percent Functionally Obsolete |
|---|---|---|---|---|---|
| Numbers of bridges shown for each category and used for percentages | |||||
| NHS | |||||
| High Volume | 15,267 | 1,061 | 3,365 | 6.9% | 22.0% |
| Low Volume | 99,590 | 5,550 | 16,018 | 5.6% | 16.1% |
| NonNHS | |||||
| High Volume | 32,534 | 3,008 | 9,710 | 9.2% | 29.8% |
| Low Volume | 445,510 | 70,269 | 60,830 | 15.8% | 13.7% |
| ADT in millions shown for each category and used for percentages | |||||
| NHS | |||||
| High Volume | 1,490.6 | 112.4 | 318.6 | 7.5% | 21.4% |
| Low Volume | 1,428.2 | 85.6 | 260.4 | 6.0% | 18.2% |
| NonNHS | |||||
| High Volume | 673.6 | 59.2 | 207.1 | 8.8% | 30.7% |
| Low Volume | 525.1 | 55.1 | 115.0 | 10.5% | 21.9% |
| Deck area (millions of square meters) shown for each category and used for percentages | |||||
| NHS | |||||
| High Volume | 43.4 | 6.0 | 11.2 | 13.8% | 25.7% |
| Low Volume | 116.3 | 8.2 | 22.2 | 7.1% | 19.1% |
| NonNHS | |||||
| High Volume | 40.4 | 4.1 | 13.3 | 10.1% | 32.9% |
| Low Volume | 123.4 | 14.5 | 19.7 | 11.8% | 16.0% |
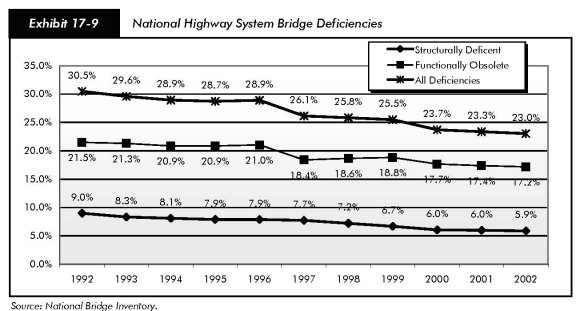
The overall condition of the bridges on the NHS has shown consistent improvement since 1992. In 1992, 30.5 percent of all NHS bridges were rated as deficient. This had declined to 23.0 percent in 2002. The percent of structurally deficient bridges declined from 9.0 percent to 5.9 percent, and the percent of functionally deficient bridges declined from 21.5 percent to 17.2 percent over the same time period [see Exhibit 17-9].
Operational Performance
Since 2000, use of the NHS has continued to increase more rapidly than its capacity has been expanded. The volume of traffic on the NHS has increased by 4.2 percent, while NHS lane miles grew by 1.3 percent. Daily vehicle miles traveled (DVMT) per lane mile grew by 3.0 percent on the rural NHS and 2.1 percent on the urban NHS. However, DVMT per lane mile on the NHS in urban areas is still almost three times larger than in rural areas.
Data for the three major performance indicators highlighted in Chapter 4, "Percent of Additional Travel Time," "Annual Hours of Delay," and "Percent of Travel Under Congested Conditions" are not available separately for the NHS. However, the NHS represents a major subset of the urban principal arterials, for which statistics are presented in that chapter. The operational performance of the Interstate component of the NHS is addressed in Chapter 16.
Finance
Exhibit 17-10 describes highway capital outlay on the NHS by functional system in 2002. Approximately $14.9 billion were spent on NHS rural arterials and collectors in 2002, and another $20.4 billion were spent on urban arterials and collectors on the NHS. Reported State government spending on NHS routes functionally classified as rural local or urban local was negligible in the year 2002. It is not currently possible to identify spending by local government on these routes, which would mainly consist of intermodal connectors and STRAHNET connectors. STRAHNET is discussed in Chapter 18.
| Functional Class | Total ($Billions) |
|---|---|
| Rural Arterials and Collectors | |
| Interstate | $6.6 |
| Other Principal Arterial | $7.6 |
| Minor Arterial | $0.5 |
| Major Collector | $0.2 |
| Minor Collector | $0.0 |
| Subtotal | $14.9 |
| Urban Arterials and Collectors | |
| Interstate | $10.5 |
| Other Freeway & Expressway | $4.5 |
| Other Principal Arterial | $5.1 |
| Minor Arterial | $0.2 |
| Collector | $0.0 |
| Subtotal | $20.4 |
| Subtotal, Rural and Urban | $35.3 |
| Rural and Urban Local | $0.0 |
| Total, All Systems | $35.3 |
The $35.3 billion spent by all levels of government for capital improvements to the NHS in 2002 constituted 51.8 percent of the $68.2 billion identified in Chapter 6 as the total amount of highway capital investment on all roads. Exhibit 17-11 categorizes this total by type of improvement. System preservation expenditures constituted 47.2 percent of this total, with system expansion constituting 44.7 percent and system enhancements 8.1 percent).
| Total Invested (Billions of Dollars) |
Percent of Total NHS | NHS Percent of Total for all Highways |
|||||
|---|---|---|---|---|---|---|---|
| Rural | Urban | Total | Rural | Urban | Total | ||
| System Preservation | |||||||
| Highway Preservation | $5.4 | $5.7 | $11.1 | 31.5% | 22.0% | 23.4% | 45.3% |
| Bridge Preservation | $2.0 | $3.5 | $5.5 | 15.7% | 17.7% | 31.3% | 49.1% |
| Subtotal | $7.4 | $9.3 | $16.7 | 47.2% | 20.6% | 25.9% | 46.5% |
| System Expansion | |||||||
| Additions to Existing Roadways | $3.5 | $4.1 | $7.6 | 21.5% | 25.7% | 30.2% | 55.9% |
| New Routes | $2.8 | $4.7 | $7.5 | 21.4% | 24.0% | 40.0% | 64.0% |
| New Bridges | $0.2 | $0.4 | $0.6 | 1.8% | 19.1% | 38.5% | 57.6% |
| Subtotal | $6.5 | $9.2 | $15.8 | 44.7% | 24.7% | 34.9% | 59.6% |
| System Enhancements | $1.0 | $1.9 | $2.9 | 8.1% | 17.0% | 31.9% | 49.0% |
| Total Investment | $14.9 | $20.4 | $35.3 | 100.0% | 21.9% | 29.9% | 51.8% |
Capital Investment Requirements
This section mirrors the investment analysis in Chapter 16 for rural and urban Interstates, expanding it to include the non-Interstate sections of the NHS. Exhibits 17-12 through 17-15 show the impacts of different levels of future capital spending on the physical conditions and operational performance of the rural and urban portions of the NHS. The first line in each exhibit shows current values for each of the measures, and the second line corresponds to the maximum economically efficient level of investment. All investment levels are in constant 2002 dollars.
| Q. | Is it possible to spend above the Maximum Economic Investment (Cost to Improve) level in a given year, while still investing only in cost-beneficial projects? |
| A. | Yes. The values identified in this report for the Maiximum Economic Investment scenario are average annual values for a 20-year period. There is currently a significant backlog of cost beneficial improvements that could be made. It would be possible for investment to exceed the Cost to Improve level for several years, before this backlog would be exhausted. |
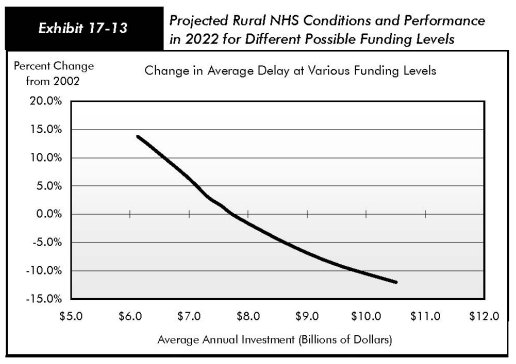
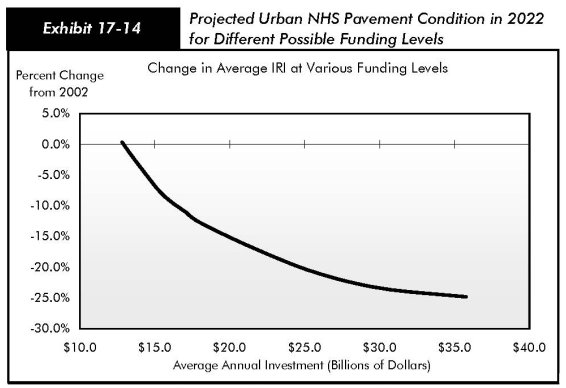
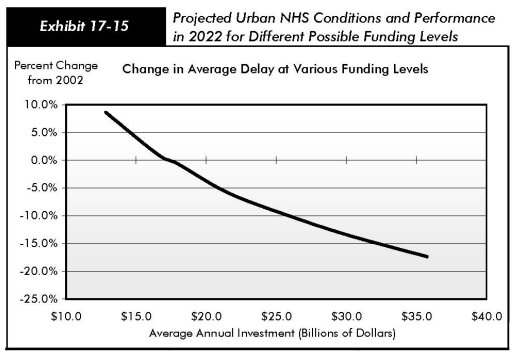
Exhibits 17-12 and 17-14 show the impact of different levels of combined highway preservation and expansion spending on rural and urban pavement condition, respectively, and Exhibits 17-13 and 17-15 show the impact of these same outlays on measures of rural and urban operational performance. Highway preservation and system expansion investment requirements are modeled by the Highway Economic Requirements System (HERS) (see Appendix A).
Expenditures on system enhancements (including traffic operational improvements, safety improvements, and environmental enhancements) are not directly modeled and are not included in the totals shown in the exhibits. Bridge preservation investment requirements are discussed separately below.
Rural NHS Routes
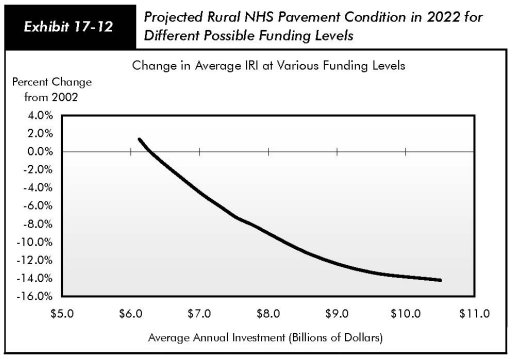
Exhibit 17-12 shows projected values for the average International Roughness Index (IRI), and the percentage of VMT at an IRI below 95 ("Good" ride quality) and below 170 ("Acceptable" ride quality). The exhibit shows that the 2002 preservation and expansion investment level of $11.9 billion on rural NHS routes exceeded the maximum economic investment level of $10.5 billion estimated by HERS. As a result, significant improvements in pavement quality on the rural NHS would be expected if 2002 funding levels were maintained in constant dollars over 20 years. However, as pointed out in Chapter 16, the large increase in rural Interstate spending between 2000 and 2002 suggests that 2002 may simply have been an unusually high year for rural Interstate and rural NHS capital expenditure.
Average IRI and the percent of NHS travel on roads with "Acceptable" ride quality could be maintained at a funding level of $6.33 billion annually.
Exhibit 17-12 indicates that significant improvements in operational performance on the rural portion of the NHS would also result if the preservation and expansion investment levels for 2002 were continued in the future, with values for average delay per VMT (discussed in Chapter 9), total user costs, and travel time costs all declining. Average user costs on rural NHS routes would be maintained at an average annual investment level of $6.13 billion, while maintaining average travel time costs would require a funding level of $6.98 billion. Average delay on the rural NHS would be maintained at an investment level between $7.55 and $7.78 billion.
| Average Annual Highway Preservation + Expansion Investment (Rural NHS) (Billions of 2002 Dollars) |
Percent Change in Average IRI |
Percent of VMT on Roads with | Funding Level Description: Investment Required to... |
|
|---|---|---|---|---|
| IRI<95 | IRI<170 | |||
| $11.92 | 67.1% | 96.7% | 2002 Values | |
| $10.50 | -14.2% | 84.3% | 99.5% | |
| $9.47 | -13.3% | 82.3% | 99.1% | |
| $8.61 | -11.4% | 79.4% | 98.7% | |
| $7.78 | -8.1% | 75.4% | 98.1% | |
| $7.55 | -7.3% | 74.1% | 97.9% | |
| $7.31 | -6.1% | 72.5% | 97.7% | |
| $6.98 | -4.4% | 70.3% | 97.4% | ...Maintain VMT with IRI<95 |
| $6.33 | -0.3% | 65.7% | 96.7% | ...Maintain Avg IRI and VMT with and <170 |
| $6.13 | 1.4% | 63.8% | 96.4% | |
| Average Annual Highway Preservation + Expansion Investment (Rural NHS) (Billions of 2002 Dollars) |
Percent Change in | Funding Level Description: Investment Required to... | ||
|---|---|---|---|---|
| Average Total Delay | Total User Costs | Travel Time Costs | ||
| $11.92 | 2002 Values | |||
| $10.50 | -12.1% | -2.0% | -2.6% | |
| $9.47 | -8.9% | -1.9% | -2.2% | |
| $8.61 | -5.0% | -1.6% | -1.7% | |
| $7.78 | -0.4% | -1.2% | -1.0% | ...Maintain Average Delay |
| $7.55 | 1.4% | -1.1% | -0.7% | |
| $7.31 | 3.1% | -1.0% | -0.5% | |
| $6.98 | 6.5% | -0.7% | -0.1% | ...Maintain Average Travel Time Costs |
| $6.33 | 12.1% | -0.2% | 0.8% | |
| $6.13 | 13.8% | 0.0% | 1.1% | ...Maintain Average User Costs |
Urban NHS Routes
Exhibits 17-14 and 17-15 show the impacts on the same measures of conditions and performance for different levels of capital spending on the urban portion of the NHS. Exhibit 17-14 shows that the current preservation and expansion investment level of $15.0 billion on urban NHS sections would be sufficient to improve average IRI on these sections by between 4.8 and 7.3 percent, assuming the mix of future preservation and capacity investments was consistent with those that HERS has identified. The percentages of travel on urban NHS pavements with "Good" and "Acceptable" ride quality would also increase significantly at this level of investment. Average IRI could be maintained at 2002 levels with an investment of between $12.82 and $13.42 billion annually.
| Average Annual Highway Preservation + Expansion Investment (Urban NHS) (Billions of 2002 Dollars) |
Percent Change in Average IRI |
Percent of VMT on Roads with | Funding Level Description: Investment Required to... |
|
|---|---|---|---|---|
| IRI<95 | IRI<170 | |||
| $14.97 | 40.2% | 86.5% | 2002 Values | |
| $35.76 | -24.8% | 72.4% | 95.6% | |
| $30.12 | -23.4% | 71.6% | 95.8% | |
| $25.68 | -20.8% | 69.0% | 95.6% | |
| $21.54 | -16.8% | 65.1% | 95.2% | |
| $17.97 | -12.7% | 60.5% | 95.0% | |
| $17.00 | -10.9% | 59.0% | 95.0% | |
| $16.04 | -9.3% | 57.6% | 92.8% | |
| $15.17 | -7.3% | 55.4% | 92.5% | |
| $13.42 | -1.7% | 50.5% | 92.1% | ...Maintain Average IRI |
| $12.82 | 0.3% | 48.5% | 91.7% | |
Exhibit 17-15 indicates that an average annual investment level in highway preservation and capacity expansion of between $17.0 and $18.0 billion would be needed to maintain average delay on urban NHS routes. Average total user costs would be maintained at a slightly lower level of $16.0 billion, while maintaining travel time costs alone on the NHS in urban areas would require between $18.0 and $21.5 billion annually. These amounts are $1 to $6 billion higher than the comparable 2002 funding level of $15.0 billion. Preservation and expansion funding levels on the urban NHS as a whole are thus much closer (in percentage terms) to the levels that would be needed to maintain performance than is the case for the Interstate portion of the NHS alone.
| Average Annual Highway Preservation + Expansion Investment (Urban NHS) (Billions of 2002 Dollars) |
Percent Change in | Funding Level Description: Investment Required to... | ||
|---|---|---|---|---|
| Average Total Delay | Total User Costs | Travel Time Costs | ||
| $14.97 | 2002 Values | |||
| $35.76 | -17.4% | -5.6% | -6.9% | |
| $30.12 | -13.5% | -4.6% | -5.2% | |
| $25.68 | -9.8% | -3.6% | -3.5% | |
| $21.54 | -5.8% | -2.3% | -1.4% | ...Maintain Average Travel Time Costs |
| $17.97 | -0.7% | -0.8% | 0.9% | ...Maintain Average Delay |
| $17.00 | 0.3% | -0.4% | 1.5% | |
| $16.04 | 2.0% | 0.0% | 2.2% | ...Maintain Average User Costs |
| $15.17 | 3.8% | 0.6% | 3.1% | |
| $13.42 | 7.4% | 2.0% | 5.2% | |
| $12.82 | 8.6% | 2.5% | 6.0% | |
Bridge Preservation
As described in Chapter 7, the National Bridge Investment Analysis System (NBIAS) model identifies preservation investment requirements for all bridges, including those on the NHS. The current NHS bridge preservation backlog is estimated at $23.9 billion.
Exhibit 17-16 describes what the NHS bridge backlog after 20 years would be at different funding levels. An average annual investment in bridge preservation of $3.79 billion is required so that the NHS bridge investment backlog would not increase above its current level over a 20-year period. An average annual investment of $5.00 billion is estimated to be sufficient to eliminate the existing NHS bridge investment backlog and correct other deficiencies that are expected to develop over the next 20 years, where it is cost-beneficial to do so.
| (Billions of 2002 Dollars ) | |
|---|---|
| Average Annual Investment | 2022 NHS Bridge Backlog |
| $5.00 | $0.0 |
| $4.68 | $6.6 |
| $4.42 | $11.5 |
| $4.01 | $19.2 |
| $3.79 | $23.9 |
| $3.52 | $29.4 |
| $3.03 | $39.6 |
| $2.51 | $51.8 |
Exhibit 17-11 indicated that bridge preservation expenditures on the NHS totaled $5.5 billion in 2002. However, this represents a 77 percent increase over the comparable 2000 spending figure of $3.1 billion, driven largely by the increase in rural Interstate bridge spending noted in Chapter 16. If bridge preservation spending reverts to a level more consistent with that observed in 2000, then the investment backlog would tend to increase, rather than decrease.
Current Spending Versus Investment Requirements
Exhibits 17-12 through 17-16 indicate that current levels of highway preservation and system expansion investment on rural sections of the NHS are well above the levels necessary to maintain conditions and performance in the future, and even exceed the maximum level of economic investment estimated by HERS. The same is true of current levels of bridge investment relative to the investment requirements identified in NBIAS. It should be noted, however, that this comparison is being made with a single year's funding, and that patterns of highway capital outlay between NHS and non-NHS routes (and between urban and rural areas) in 2002 are significantly different from those observed in 2000, and could easily shift back. On urban Interstates, current funding levels for preservation and expansion would be expected to result in improved pavement quality, but a decline in overall operational performance.