

- Introduction
- Grade Separation Improvements
- Grade Crossing Traffic Distribution Scenarios
- Peak Traffic
- Uniform Traffic
Highway-Rail Grade Crossings
Introduction
In 2004, growth in rail and truck traffic continues to test infrastructure capacity limits along many of the Nation's freight corridors, establishing a trend expected to continue for the foreseeable future. Freight rail traffic tonnage is expected to grow by at least 67 percent over the next 20 years, led by the growth of intermodal rail traffic, while freight truck tonnage is expected to double over the same period. Intermodal rail shipments increased by 10.4 percent in 2004 over the previous year. Some of the recent growth in rail traffic can be attributed to diversions of intermodal traffic from truck to rail. Such diversions are expected to continue in response to increased domestic and international trade and fluctuations in the price of fuel. Double track crossings currently serve as many as 140 trains per day, and the number of crossings serving more than 100 trains per day is expected to more than double over the next 20 years. Crossings near intermodal facilities, major ports, rail yards, and classification and switching areas will continue to experience significant increases in rail and truck traffic. Highly congested rail lines already extend from Chicago to the Pacific Northwest and from Los Angeles to all destinations.
| Q. | What is a highway-rail grade crossing? |
| A. | A highway-rail grade crossing is the intersection of highway lanes and railroad track. The Federal Railroad Administration has identified over 260,000 public and private grade crossings in the United States. Passive warning devices protect over 78 percent of the grade crossings. Flashing lights, automated gates, and other train-activated warning devices protect the remaining grade crossings. State and local governments have the responsibility of enforcing traffic laws at highway-rail grade crossings. |
| Q. | Does this analysis cover highway-rail grade crossing safety? |
| A. | Traditionally, grade crossings have been viewed as a safety concern. This analysis focuses on delay-related highway user costs and includes safety. For more information on grade crossing safety, see Chapter 11. |
Railroads have improved productivity by running longer trains. More and longer trains increase the amount of time grade crossings are blocked to highway traffic. As a result, delay to motorists, truckers, and pedestrians could reach unacceptable levels in many communities, blocking emergency vehicles, disrupting local commerce, inconveniencing residents, and creating societal divisions.
The Federal Railroad Administration (FRA) has analyzed grade crossings located on the Federal-aid highway system in metropolitan and surrounding areas. These crossings serve high volumes of rail traffic and are closed for large portions of the day, causing significant delay to both passenger vehicles and trucks.
The FRA analysis suggests that, during the first 10 years of the 20-year analysis period, total hours of delay for trucks, autos, and buses could increase by 8 percent annually at the Nation's busiest crossings. The annual increases could reach 18 percent during the last 10 years of the analysis period, depending on whether trains travel through the crossings when highway traffic volume is at its highest. The large annual increase in delay in the latter portion of the analysis period is attributed to the congested highway conditions compounded by the increased number of gate closures due to higher rail traffic volumes. Annual hours of delay for autos could increase from 2004 levels by between 64.4 million and 86.6 million hours by 2024, and trucks could spend between 9.9 million and 10.7 million more hours annually behind closed gates by 2024 than at present, depending on how frequently trains arrive at the gates during daily highway traffic peaks. The cost to highway users in lost time at the most heavily traveled crossings on the Federal-aid system would increase to between $9 billion and $10 billion over the 20-year analysis period.
Grade Separation Improvements
When traffic volumes reach the levels noted above, the most effective solution may be to separate highway and rail traffic by building a bridge. The analysis of the costs and benefits of grade separation investment presented here focuses on the length of time highway vehicles spend queued up waiting for a train to pass. Most important is to determine how many highway vehicles are affected each time a train arrives at the crossings. This analysis was limited to grade crossings on the Federal-aid highway system.
| Q. | How do the highway-rail grade separation investment requirement estimates presented in this chapter compare with current spending on such activities? |
| A. | The State and local highway financial reporting that forms the basis of the analysis of highway spending presented in Chapter 6 of this report is not sufficiently detailed to determine the amount of current spending that is used specifically for this purpose. Consequently, it is not possible to make a direct comparison of these investment requirement estimates with current spending by all levels of government for the types of improvements that are modeled. At the Federal level, of the total amount apportioned to States for the Surface Transportation Program (STP), 10 percent is set-aside for safety programs. Of this amount, States are required to reserve an amount each year for the elimination of hazards at highway-rail crossings that is not less than the amount that was apportioned to States for this purpose in 1991, which was $155 million. (States have the option of devoting a larger portion of their STP Safety set-aside funds for this purpose, as long as they reserve another amount each year equal to their apportionments in 1991 for the Hazard Elimination program.) Note that only a portion of the amount reserved for the elimination of hazards at highway-rail crossings are available to be spent for grade separations; at least one-half of these funds are required to be spent for the installation of protective devices. Other types of improvements to eliminate hazards at grade crossings are also eligible for funding. |
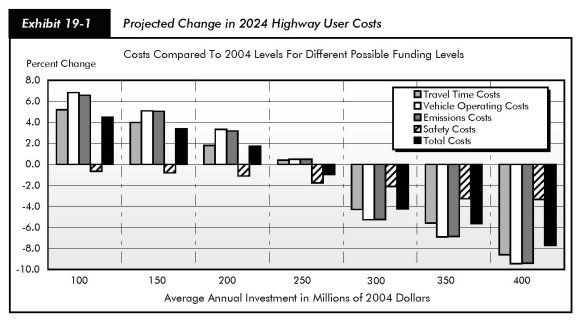
Exhibit 19-1 shows the projected changes in different types of highway user and emissions costs in 2024 (compared with 2004 levels) at different annual levels of investment in grade separation improvements. This analysis indicates the following:
- An average annual investment in highway-rail grade separation improvements of $250 million would be sufficient to maintain highway user costs at these crossings at 2004 levels. This investment level is comparable to the "Maintain User Costs" scenario for highways discussed in Chapter 7. Under this investment scenario, grade crossing-related user costs would be held constant at 2004 levels.
- Increasing average annual investment to $400 million would be sufficient to undertake all cost beneficial separation projects on the Federal-aid system. This level is comparable to the "Maximum Economic Investment" scenario for highways discussed in Chapter 7. Under this investment scenario, all grade crossing separation projects that have estimated benefits in excess of their estimated costs would be undertaken. Grade crossing-related user costs would decline below 2004 levels under this scenario.
- Grade separation improvements are at least partially captured in the external adjustments made in Chapter 7 to account for nonmodeled capital investments (particularly safety enhancements). The FRA analysis, however, also captures separation improvements motivated by highway user delay caused by increasing highway and railroad traffic, which likely are not fully reflected in the two highway investment scenarios.
| Q. | What assumptions were made about highway and rail traffic to estimate the change in highway user costs resulting from these funding levels? |
| A. | The highway user costs used in Exhibit 19-1 are the average of the two traffic scenarios, uniform and peak, established in this analysis. All highway user cost estimates depend on the amount of highway traffic affected when trains arrive at grade crossings. |
As did the highway and bridge analysis presented in Chapter 7, the FRA analysis finds a significant backlog of grade separation improvements that could be immediately justified. The backlog of such improvements in 2004 totals $2.2 billion.
In practice, grade crossing separations are planned in conjunction with the closing of adjacent grade crossings. Highway traffic is rerouted from the closed to the grade separated crossing. As a result, the grade separation eliminates wait time at both the closed and separated crossings. While a more thorough analysis would consider the benefits associated with the redirected traffic (as well as the residual value of capital investments in grade separation), they are not included in this analysis.
Grade separation improvements require extensive planning and costly construction. While this analysis focuses on local impacts of these types of improvements, there may be broader regional considerations that are not captured. For example, a sudden increase in train traffic due to rail line consolidation could significantly increase the highway delay experienced by a local community, though it would receive only a small portion of the economic benefits of the increased rail traffic. While issues of cost responsibility go beyond the scope of this report, it is important to recognize that the distribution of benefits in situations such as these may influence decisions concerning how specific grade separation improvements might be financed.
Grade Crossing Traffic Distribution Scenarios
Delays at grade crossings occur when highway and rail traffic arrive at the gate simultaneously. The analysis of such delay thus depends on assumptions about the distribution of highway and rail traffic among different time periods. In the FRA analysis, two traffic distributions were analyzed: peak traffic and uniform traffic.
| Q. | Does this analysis cover issues relating to truck-to-rail diversion? |
| A. | The models used in this report are mode-specific and do not directly reflect the impacts that investments in one mode could have on other transportation modes in that area. Research is underway to identify approaches for tying the individual models more closely together (see Part V). |
Peak Traffic
As shown in Exhibit 19-2, allowing both highway and train traffic to peak at grade crossings could result in automobile delay increasing by 86.5 million hours annually by 2024 at the 50 percent confidence interval. Similarly, trucks would likely experience an additional 10.7 million hours of delay annually in 20 years and bus delay could increase by an average 8.9 million hours of delay at the 50 percent confidence interval. The present value of delay for all vehicles for the 20-year period is valued at $8.8 billion at the 50 percent confidence interval. In other words, under these assumptions, one can be 50 percent certain that the hours of delay would equal or exceed the values stated above. At the 50 percent confidence interval, annual carbon monoxide emissions would increase by 40,000 metric tons, annual hydrocarbon emissions would increase by 2,500 metric tons, and annual nitrogen oxide emissions would increase by 900 metric tons. The present value of total emission costs for the 20-year analysis period is $34 million at the 50 percent confidence interval. Similarly, the annual fuel burned idling at grade crossings would increase by 72 million gallons of gasoline, 15 million gallons of diesel fuel, and 6 million gallons of lubricating oil.
| Confidence Interval | 50% Average |
80% Minimum |
20% Maximum |
|---|---|---|---|
| Transportation Mode | Delay, hours | ||
| Auto | 86,573,550 | 30,547,530 | 246,871,600 |
| Truck | 10,727,495 | 4,132,080 | 30,362,520 |
| Bus | 8,939,580 | 3,443,400 | 25,302,100 |
| Pollutant Type | Emissions, metric tons | ||
| CO | 39,853 | 12,903 | 114,149 |
| HC | 2,484 | 804 | 7,114 |
| NOX | 886 | 291 | 2,535 |
| Fuel Type | Consumption, gallons | ||
| Gasoline | 71,614,900 | 22,955,870 | 205,260,500 |
| Diesel | 15,277,460 | 5,395,000 | 43,492,040 |
| Lubricating Oil | 5,613,480 | 1,831,542 | 16,070,080 |
| Present Value of All Costs for the Entire 2005-2024 Analysis Period | Cost, $Thousands | ||
| Safety | $699,674 | $561,230 | $965,651 |
| Delay | $8,783,935 | $4,430,055 | $17,392,695 |
| Emissions | $34,065 | $13,548 | $92,880 |
| Vehicle Operating Costs | $477,842 | $266,363 | $1,031,463 |
| Total Cost | $9,995,517 | $5,271,196 | $19,482,689 |
Vehicle operating costs are the sum of the costs of additional fuel and lubricating oil burned while idling at grade crossings, and these combined costs add $480 million (in present value) to the total user costs of highway-rail grade crossings. All categories of accidents (fatal, injury, and property damage only) combined add another $700 million in present-value costs to the total.
On average, the total increase in costs for all years and all categories over the 20-year analysis period is valued at nearly $10 billion in present-value dollars. Thirty-five percent of the deviation from the mean is attributed to variations in train length, and 15 percent is attributed to variations in the number of passenger trains.
Uniform Traffic
Exhibit 19-3 shows that, when highway and rail traffic is uniformly distributed, it is estimated that the automobile traffic delay would increase over 64 million hours by 2024, trucks would spend an additional 9.9 million hours queued up behind closed gates, and bus delay would increase by 8.2 million hours at the 50 percent confidence interval. The total value of time lost for all vehicle types over the 20-year period amounts to $7.8 billion in present value. Idling vehicles would emit an additional 29,000 metric tons of carbon monoxide, 1,800 metric tons of hydrocarbons, and 700 metric tons of nitrogen oxides annually than in 2004. The changes in emissions over the analysis period convert to over $28 million in present value dollars. An additional 51 million gallons of gasoline, 13 million gallons of diesel fuel, and 4 million gallons of lubricating oil would be burned at the closed grade crossings than in the first year of the analysis period and would add a total of $400 million in present-value dollars to the national fuel bill. Safety costs of all predicted categories would be valued at $712 million in present-value dollars. The total present-value costs of increased delay, fuel consumption, and accident risk at high-volume crossings on the Federal-aid highway system would exceed $8.9 billion at the 50 percent confidence interval if all highway and rail traffic were uniformly distributed.
| Confidence Interval | 50% Average |
80% Minimum |
20% Maximum |
|---|---|---|---|
| Transportation Mode | Delay, hours | ||
| Auto | 64,390,600 | 27,125,205 | 180,965,250 |
| Truck | 9,906,245 | 4,173,110 | 27,840,810 |
| Bus | 8,255,205 | 3,477,591 | 23,200,675 |
| Pollutant Type | Emissions, metric tons | ||
| CO | 29,084 | 11,681 | 82,107 |
| HC | 1,812 | 728 | 5,117 |
| NOX | 667 | 268 | 1,883 |
| Fuel Type | Consumption, gallons | ||
| Gasoline | 51,067,200 | 20,511,065 | 144,169,400 |
| Diesel | 13,476,225 | 5,412,705 | 38,045,145 |
| Lubricating Oil | 4,169,678 | 1,674,745 | 11,771,545 |
| Present Value of All Costs for the Entire 2005-2024 Analysis Period | Cost, $Thousands | ||
| Safety | $711,564 | $570,890 | $981,413 |
| Delay | $7,841,520 | $4,165,215 | $15,250,575 |
| Emissions | $28,125 | $12,380 | $74,682 |
| Vehicle Operating Costs | $398,425 | $244,175 | $835,014 |
| Total Cost | $8,979,634 | $4,992,660 | $17,141,683 |
In the uniformly distributed traffic scenario, 40 percent of the deviation from the mean is attributed to variations in train length and 8 percent is attributed to variations in volume of passenger trains. This is expected because all traffic is uniformly distributed under this scenario; thus, the additional passenger trains would not be adding to congested conditions during peak traffic periods.
| Q. | How was this analysis conducted? |
| A. | The FRA relied on its GradeDec 2000 software to conduct a Monte Carlo simulation to provide a range of values for all benefit categories at the 20, 50, and 80 percent confidence intervals for each scenario. Train length was allowed to vary from 30 to 90 cars, and the number of passenger rail trains varied between zero and four. All other variables were held constant. Two scenarios, uniform and peak, were established to evaluate a reasonable range of highway traffic volumes affected by grade crossing closures. In the uniform scenario, parameters were set so that highway and rail traffic are evenly distributed across each hour of the day. The peak scenario sets parameters to adjust daily traffic volumes so that 48 percent of daily highway traffic is allowed to peak at an increasing rate over 6 hours of the day to a maximum peak of 0.08 percent of daily traffic. All highway traffic above 900 vehicles per lane per hour is redirected away from the crossing. The costs and benefits of redirecting traffic are not included in this analysis. Thirty-seven percent of daily traffic is distributed evenly over the next 12 hours, and the remaining 15 percent is distributed evenly for the remaining 6 hours. Train traffic is allowed to cluster at any time, including the 6-hour peak period for highway traffic. |