- Summary
- Highway Conditions
- Bridge Conditions
- Transit Conditions
- Road Conditions
- Pavement Terminology and Measurements
- Overall Pavement Condition
- Rural and Urban Pavement Conditions
- Pavement Condition by Functional Classification
- Roadway Alignment
- Lane Width
- Bridge System Conditions
- Classification of Bridge Deficiencies
- Condition Rating Structural Deficiencies
- Structural Appraisal Ratings
- Appraisal Rating Functional Obsolescence
- Number of Deficient Bridges
- Deficient Bridges by Owner
- Deficient Bridges by Functional Classification
- Classification of Bridge Deficiencies
- Transit System Conditions
- Bus Conditions
- Urban Bus Maintenance Facilities
- Age
- Condition
- Rail Vehicle Conditions
- Urban Rail Maintenance Facilities
- Age
- Condition
- Other Rail Urban Infrastructure
- The Value of U.S. Transit Assets
- Rural Transit Vehicles and Facilities
- Special Service Vehicles
Road Conditions
Pavement Terminology and Measurements
Pavement condition affects costs associated with travel, including vehicle operation, delay, and crash expenses. Poor road surfaces cause additional wear and tear on, or even damage to, vehicle suspensions, wheels, and tires. Delay occurs when vehicles slow for potholes or very rough pavement; in heavy traffic, such slowing can create significant queuing and subsequent delay. Inadequate road surfaces may reduce road friction, which affects the stopping ability and maneuverability of vehicles. This, and unexpected changes in surface conditions, may result in crashes.
The pavement condition ratings in this section are derived from one of two measures: the International Roughness Index (IRI) or the Present Serviceability Rating (PSR). The IRI measures the cumulative deviation from a smooth surface in inches per mile. The PSR is a subjective rating system based on a scale of 0 to 5. Prior to 1993, all pavement conditions were evaluated using PSR values. Exhibit 3-2 contains a description of the PSR system.
| PSR | Description |
|---|---|
| 4.0 - 5.0 | Only new (or nearly new) superior pavements are likely to be smooth enough and distress free (sufficiently free of cracks and patches) to qualify for this category. Most pavements constructed or resurfaced during the data year would normally be rated in this category. |
| 3.0 - 4.0 | Pavements in this category, although not quite as smooth as those described above, give a first-class ride and exhibit few, if any, visible signs of surface deterioration. Flexible pavements may be beginning to show evidence of rutting and fine random cracks. Rigid pavements may be beginning to show evidence of slight surface deterioration, such as minor cracking and spalls. |
| 2.0 - 3.0 | The riding qualities of pavements in this category are noticeably inferior to those of the new pavements and may be barely tolerable for high-speed traffic. Surface defects of flexible pavements may include rutting, map cracking, and extensive patching. Rigid pavements may have a few joint fractures, faulting and/or cracking, and some pumping. |
| 1.0 - 2.0 | Pavements have deteriorated to such an extent that they affect the speed of free-flow traffic. Flexible pavement may have large potholes and deep cracks. Distress includes raveling, cracking, and rutting and occurs over 50 percent or more of the surface. Rigid pavement distress includes joint spalling, faulting, patching, cracking, and scaling and may include pumping and faulting. |
| 0.0 - 1.0 | Pavements are in extremely deteriorated conditions. The facility is passable only at reduced speed and considerable ride discomfort. Large potholes and deep cracks exist. Distress occurs over 75 percent or more of the surface. |
| Q. | Do other measures of pavement condition exist? |
| A. | Other principal measures of pavement condition or distress such as rutting, cracking, and faulting exist, but are not reported in HPMS. States vary in the inventories of these distress measures for their highway systems. To continue improving our pavement evaluation, FHWA is undertaking an effort to determine which measures are commonly collected by most states. Adding such measures to FHWA's database would enable the agency to account for pavement needs nationwide more accurately. |
States are required to report IRI data for the Interstate system, other principal arterials, rural minor arterials, and the National Highway System (NHS) regardless of functional classification. IRI reporting is recommended for all functional classifications. For those sections of rural major collectors for which ride quality data were reported, the use of IRI as the reporting method has decreased from 63.7 percent in 2000 to 62.7 percent in 2002. For every other functional classification for which a ride quality was reported, the percentage of miles for which it was reported in IRI increased between 2000 and 2002. The Federal Highway Association's (FHWA's) Highway Performance Monitoring System (HPMS) Field Manual requires rural roadway sample sections that are functionally classified higher than major collectors to have a ride quality reported in IRI. Compliance with this requirement varies from 99.75 percent on the Interstate to 99.47 percent on minor arterials. The HPMS Field Manual requires a ride quality of one form or another to be reported for all standard sample sections, including rural major collectors. A similar requirement exists within urban areas where roadway sections functionally classified higher than minor arterials are required to have a ride quality reported in IRI. Compliance in the urban areas varies from 99.10 percent on other freeways and expressways to 93.56 percent on other principal arterials. Reporting of ride quality in IRI drops to 53.91 percent for the urban minor arterials. The urban minor arterials and the rural major collectors classifications have increased their respective percentage of reporting using IRI between 2000 and 2002.
The FHWA adopted the IRI for the higher functional classifications because it is an objective measurement and is generally accepted worldwide as a pavement roughness measurement. The IRI system results in more consistent data for trend analyses and cross jurisdiction comparisons. Exhibit 3-3 contains a description of qualitative pavement condition terms and corresponding quantitative PSR and IRI values. The translation between PSR and IRI is not exact; IRI values are based on objective measurements of pavement roughness, while PSR is a subjective evaluation of a broader range of pavement characteristics. For example, a given Interstate pavement section could have an IRI rating of 165, but might be rated a 2.4 on the PSR scale. Such a section would be rated as acceptable based on its IRI rating, but would not have been rated as acceptable had PSR been used. Thus, the mileage of any given pavement condition category may differ depending on the rating methodology. The historic pavement ride quality data in this report go back to 1995, while IRI data only began to be collected in 1993.
Since the translation between PSR and IRI is imprecise, caution should be used when making comparisons with older data from earlier editions of this report that relied more heavily on PSR data.
| Ride Quality Terms* | All Functional Classifications | |
|---|---|---|
| IRI Rating | PSR Rating | |
| Good | < 95 | ≥ 3.5 |
| Acceptable | ≤ 170 | ≥ 2.5 |
| Not Acceptable | > 170 | < 2.5 |
C&P report is the 170 IRI value as set by the FHWA Performance
Plan for the NHS. Some transportation agencies may use less
stringent standards for lower functional classification highways
to be classified as "Acceptable."
| Q. | What is FHWA's current target for NHS ride quality? |
| A. | The FHWA Fiscal Year 2005 Performance Plan includes a goal to have 93.5 percent of all VMT on the NHS to be on pavements with acceptable ride quality. Additional details can be found in Chapter 17. |
The Federal Highway Administration 1998 National Strategic Plan introduced a new descriptive term for pavement condition: "acceptable ride quality." That plan stated that, by 2008, 93 percent of the NHS mileage should meet pavement standards for "acceptable ride quality," which was defined as having an IRI value less than or equal to 170 inches per mile. This goal was accomplished in 1999. The FHWA subsequently revised this metric to be based on the percentage of vehicle miles traveled (VMT) on NHS pavements with acceptable ride quality. This revised metric places more emphasis on the benefits of ride quality to highway users and presents a more challenging performance target, since in recent years the percentage of VMT on NHS pavements with an IRI of less than or equal to 170 has been lower than the percentage of mileage meeting that standard. In 2002, while 93.7 percent of NHS pavements had an IRI of less than or equal to 170, only 90.6 percent of VMT on the NHS was on pavements with acceptable ride quality. The physical condition of the NHS is discussed in more detail in Chapter 17.
Some previous editions of the annual FHWA Performance plan also included targets for "good ride quality," which represented a subset of acceptable ride quality. For ride quality to be rated as good, it must occur on pavements with an IRI value of less than 95 inches per mile. In this chapter, overall ride quality is presented based on the qualitative condition terms: good, acceptable, and not acceptable.
Previous editions of the C&P report have focused mainly on pavement conditions in terms of mileage. This edition retains exhibits of that nature to maintain continuity, but also adds a number of parallel exhibits based on the percentage of VMT occurring on pavements with acceptable ride quality. This increased emphasis on the impacts of system conditions in highway conditions is intended to make this chapter more consistent with the approaches used in the operational performance and future investment requirement analyses included in Chapters 4 and 7, respectively. This approach is also intended to make this chapter more logically consistent with the revised NHS ride quality metric that has been adopted in the annual FHWA performance plans.
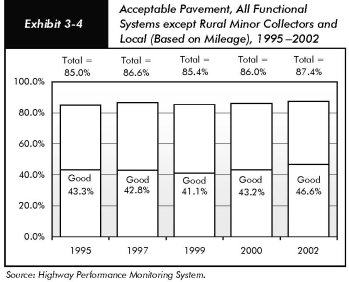
Overall Pavement Condition
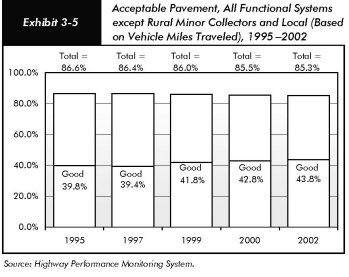
The highway systems covered in this chapter include all mileage except rural minor collectors and local functional classifications. In 2002, 87.4 percent of total road mileage evaluated was rated acceptable including 46.6 percent that met the standard for good [Exhibit 3-4], and 85.3 percent of VMT occurred on pavements rated acceptable, including 43.8 percent that occurred on pavements rated as good [Exhibit 3-5].
Rural and Urban Pavement Conditions
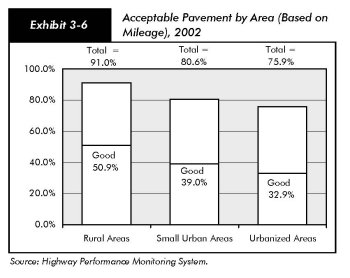
When discussing pavement conditions, it is important to note the different travel characteristics between rural and urban areas. As noted in Chapter 2, rural areas contain 77.3 percent of road miles, but only 39.4 percent of annual VMT. In other words, although rural areas have a larger percentage of road miles, the majority of travel is occurring in urban areas. According to 2002 mileage data, pavement conditions in rural areas are slightly better than those in small urban and urbanized areas. Exhibit 3-6 shows that 91.0 percent of total road miles in rural areas are rated acceptable, while 80.6 percent of road miles in small urban areas are rated acceptable, and 75.9 percent of the total road miles in urbanized areas are rated acceptable. The percentages shown as acceptable include mileage that also met the more stringent limit to be classified as good, 50.9 percent of rural miles, 39.0 percent of small urban miles, and 32.9 percent of urbanized miles. The rural and small urban percentages have increased in both categories between 2000 and 2002, while the urbanized percentages have decreased. The rural minor collector and local functional system mileages are not included in these percentages since those data are not collected in the HPMS on a universal basis.
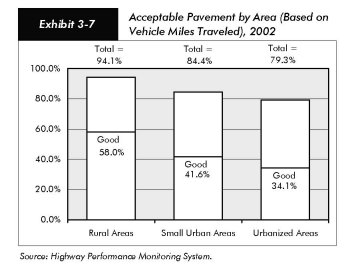
According to the 2002 VMT data, ride quality in rural areas is better than in small urban and urbanized areas. Exhibit 3-7 shows that 94.1 percent of VMT in rural areas is on pavements that are rated acceptable, while 84.4 percent of VMT in small urban areas is on pavements that are rated acceptable, and 79.3 percent of the VMT in urbanized areas is on pavements that are rated acceptable. These percentages also include VMT on pavements that met the more stringent limit to be classified as good, 58.0 percent for rural areas, 41.6 percent for small urban areas, and 34.1 percent for urbanized areas. Note that rural minor collector and local functional system routes also are not included in these percentages, for the same reason as given above.
| Q. | How can the percentage of mileage with acceptable pavement shown in Exhibit 3-4 logically be higher than the percentage of VMT on acceptable pavements shown in Exhibit 3-5 for all areas combined, while the opposite is true for rural, small urban and urbanized areas individually? |
| A. | As shown in Exhibits 3-6 and 3 7, the percentage of acceptable pavement based on mileage is lower than the percentage of acceptable pavements based on VMT for rural areas, small urban areas, and urbanized areas. However, these exhibits also show that ride quality in rural areas is significantly better than in urbanized areas on either a mileage or VMT basis. Since a majority of mileage is in rural areas, while a majority of VMT is in urban areas, this means that the condition of rural roads has a much greater impact on a mileage-based measure (such as that shown in Exhibit 3 4) than it does on a VMT-weighted measure (such as that shown in Exhibit 3-5). |
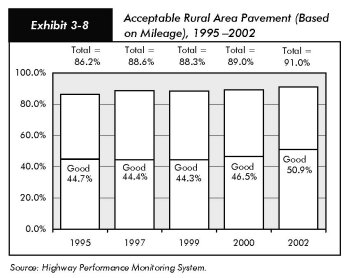
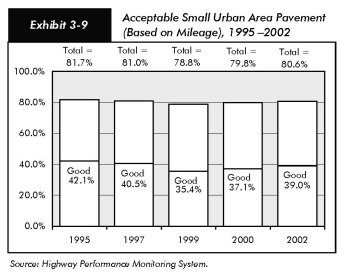
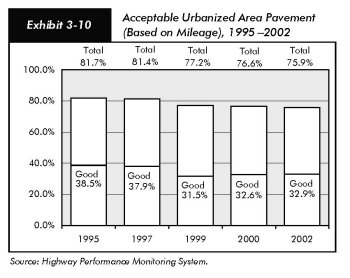
Pavement conditions based on mileage in rural areas have generally been improving over time. Since 1995, the percentage of road miles in acceptable condition has increased from 86.2 percent to 91.0 percent in rural areas [Exhibit 3-8]. However, both small urban and urbanized areas have experienced decreases in acceptable pavement miles, from 81.7 percent to 80.6 percent [Exhibit 3-9] and from 81.7 percent to 75.9 percent [Exhibit 3-10], respectively, between 1995 and 2002. Comparable trends can be observed in the percentage of miles rated as good.
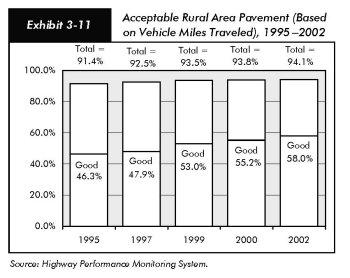
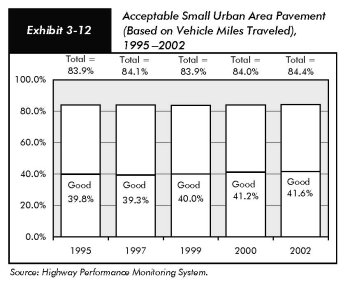
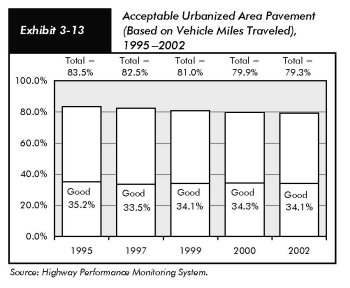
Ride quality based on VMT has followed a similar trend in rural and urbanized areas, and remained somewhat constant in small urban areas. Since 1995, the percentage of VMT on pavements rated in acceptable condition has increased from 91.4 percent to 94.1 percent in rural areas [Exhibit 3-11]. The percentage of VMT on pavements rated in acceptable condition in small urban areas has fluctuated from a low of 83.9 percent in 1995 and 1999 to a high of 84.4 percent in 2002 [Exhibit 3-12]. The percentage of VMT on pavements rated in acceptable condition has decreased from 83.5 percent to 79.3 percent in urbanized areas [Exhibit 3-13]. The percentage of VMT on pavements rated as good in rural areas has increased from 46.3 percent in 1995 to 58.0 percent in 2002. For small urban areas, the percentage increases very slightly over time. For urbanized areas, the percentage fluctuates, with a high of 35.2 percent in 1995 and a low of 34.1 percent in 1999 and 2002.
Pavement Condition by Functional Classification
As stated in Chapter 2, approximately 52.9 percent of the total mileage in the United States is functionally classified as local. Nevertheless, roads classified as Interstate have the largest percentage of VMT per lane mile, followed (in order) by other principal arterials, minor arterials, collectors, and locals. Therefore, improving ride quality on a mile of Interstate route affects more users than improving ride quality on a mile of road on a lower functional classification. Interstate mileage in rural areas is 97.8 percent acceptable. In small urban areas, Interstate mileage is 95.3 percent acceptable. In urbanized areas, Interstate mileage is 91.7 percent acceptable. The equivalent percentages based on VMT are 97.3, 94.6, and 89.3 percent, respectively. Ride quality on pavements rated as good follows the same order. For every functional classification, the same pattern as shown for Interstates is followed for each combination of population area and pavement rating, whether comparing based on mileage or VMT, with the exception that, based on mileage, collector routes in large urban areas are generally rated better than those in small urban areas.
A historical view helps clarify where pavement improvements are occurring and at what rate. Exhibit 3-14 shows the pavement condition by category, functional classification, and location from 1995 to 2002 based on mileage. The exhibit illustrates that pavement conditions have changed in a variety of ways. For example, since 1995, the percentage of Interstate miles in rural areas classified as acceptable has increased from 94.5 percent to 97.8 percent.
The percentage of Interstate miles in urbanized areas rated as acceptable has increased from 90.0 percent to 91.7 percent. However, during the same time period, the percentage of other principal arterials in urbanized areas listed as acceptable has decreased from 75.9 percent to 67.5 percent.
| Functional System | 1995 | 1997 | 1999 | 2000 | 2002 | ||
|---|---|---|---|---|---|---|---|
| Percent Acceptable | |||||||
| Rural Interstate | 94.5% | 95.9% | 97.6% | 97.8% | 97.8% | ||
| Rural Other Principal Arterial | 91.4% | 93.7% | 95.4% | 96.0% | 96.6% | ||
| Rural Minor Arterial | 85.1% | 89.8% | 92.0% | 92.0% | 93.8% | ||
| Rural Major Collector |
82.5% | 84.0% | 79.7% | 82.1% | 85.9% | ||
| Small Urban Interstate | 94.4% | 95.8% | 95.4% | 95.7% | 95.3% | ||
| Small Urban Other Freeway & Expressway | 90.2% | 91.2% | 92.8% | 93.7% | 94.8% | ||
| Small Urban Other Principal Arterial | 82.0% | 80.5% | 81.7% | 82.9% | 83.0% | ||
| Small Urban Minor Arterial | 82.5% | 82.2% | 78.1% | 80.0% | 81.3% | ||
| Small Urban Collector
| 76.4% | 75.9% | 68.3% | 68.9% | 70.8% | ||
| Urbanized Interstate | 90.0% | 90.0% | 92.2% | 93.0% | 91.7% | ||
| Urbanized Other Freeway & Expressway | 87.5% | 87.7% | 88.8% | 88.3% | 88.8% | ||
| Urbanized Other Principal Arterial | 75.9% | 73.2% | 67.6% | 67.7% | 67.5% | ||
| Urbanized Minor Arterial | 82.1% | 82.6% | 78.5% | 78.3% | 75.9% | ||
| Urbanized Collector | 84.4% | 86.4% | 80.3% | 77.4% | 77.6% | ||
| Percent Good | |||||||
| Rural Interstate | 51.8% | 56.9% | 65.4% | 68.5% | 71.9% | ||
| Rural Other Principal Arterial | 41.0% | 47.5% | 54.0% | 57.4% | 60.9% | ||
| Rural Minor Arterial | 40.7% | 45.3% | 46.9% | 47.7% | 50.2% | ||
| Rural Major Collector | 47.7% | 40.1% | 32.5% | 36.2% | 37.1% | ||
| Small Urban Interstate | 49.8% | 51.4% | 58.2% | 61.6% | 64.9% | ||
| Small Urban Other Freeway & Expressway | 41.2% | 35.8% | 41.3% | 43.8% | 49.7% | ||
| Small Urban Other Principal Arterial | 36.3% | 32.6% | 33.7% | 36.6% | 35.4% | ||
| Small Urban Minor Arterial | 46.8% | 45.5% | 37.2% | 38.1% | 42.1% | ||
| Small Urban Collector |
43.4% | 44.4% | 29.3% | 29.8% | 33.1% | ||
| Urbanized Interstate | 41.3% | 39.3% | 45.0% | 48.2% | 48.7% | ||
| Urbanized Other Freeway & Expressway | 36.8% | 31.4% | 35.5% | 37.9% | 39.6% | ||
| Urbanized Other Principal Arterial | 28.7% | 26.6% | 23.5% | 23.9% | 22.7% | ||
| Urbanized Minor Arterial | 44.8% | 45.2% | 37.2% | 37.6% | 37.7% | ||
| Urbanized Collector | 44.3% | 46.6% | 30.2% | 31.4% | 33.4% | ||
One consistent trend is the faster rate of pavement condition improvement in rural areas versus small urban and urbanized areas. Since 1995, the percent of total rural road miles classified as acceptable has increased in each of the four functional classes of rural roads. However, for the five functional classes of roads for small urban areas, three functional classifications—Interstate, other freeway and expressway, and other principal arterials—have seen an increase in acceptable road miles, while two functional classes—minor arterials and collectors—have experienced declines in acceptable road miles. For the five functional classes of roads for the urbanized areas, two functional classifications—Interstate and other freeway and expressway—have seen an increase in acceptable road miles, and three functional classes—other principal arterials, minor arterials, and collectors—have experienced declines in acceptable road miles.
Exhibit 3-15 shows the equivalent pavement condition by category, functional classification, and location from 1995 to 2002 based on VMT. The exhibit illustrates that pavement conditions based on VMT have generally mirrored those based on mileage. For example, since 1995, the percentage of Interstate VMT in rural areas on pavements classified as acceptable has increased from 94.5 percent to 97.3 percent.
| Functional System | 1995 | 1997 | 1999 | 2000 | 2002 | ||
|---|---|---|---|---|---|---|---|
| Percent Acceptable | |||||||
| Rural Interstate | 94.5% | 95.7% | 97.4% | 97.4% | 97.3% | ||
| Rural Principal Arterial | 92.9% | 93.8% | 95.5% | 96.0% | 96.2% | ||
| Rural Minor Arterial | 91.2% | 92.1% | 93.2% | 93.1% | 93.8% | ||
| Rural Major Collector | 86.4% | 87.3% | 86.1% | 86.9% | 87.6% | ||
| Small Urban Interstate | 94.9% | 96.1% | 95.9% | 95.3% | 94.6% | ||
| Small Urban Other Freeway & Expressway | 91.1% | 92.6% | 93.0% | 94.4% | 95.3% | ||
| Small Urban Other Principal Arterial | 82.1% | 80.6% | 82.2% | 83.3% | 83.8% | ||
| Small Urban Minor Arterial | 82.4% | 84.0% | 81.8% | 81.7% | 82.1% | ||
| Small Urban Collector |
78.8% | 78.7% | 76.6% | 74.3% | 74.9% | ||
| Urbanized Interstate | 88.8% | 88.1% | 90.4% | 91.0% | 89.3% | ||
| Urbanized Other Freeway & Expressway | 87.8% | 86.9% | 87.6% | 86.8% | 87.4% | ||
| Urbanized Other Principal Arterial | 76.4% | 73.3% | 68.3% | 68.8% | 68.8% | ||
| Urbanized Minor Arterial | 83.4% | 83.3% | 80.2% | 75.7% | 75.4% | ||
| Urbanized Collector | 82.1% | 84.4% | 80.1% | 76.4% | 74.5% | ||
| Percent Good | |||||||
| Rural Interstate | 53.3% | 56.5% | 66.8% | 69.6% | 72.2% | ||
| Rural Principal Arterial | 43.6% | 47.0% | 54.3% | 56.8% | 60.2% | ||
| Rural Minor Arterial | 42.8% | 43.8% | 47.2% | 48.9% | 51.0% | ||
| Rural Major Collector |
43.9% | 41.9% | 38.6% | 39.9% | 42.4% | ||
| Small Urban Interstate | 51.4% | 52.9% | 59.8% | 62.5% | 65.1% | ||
| Small Urban Other Freeway & Expressway | 42.9% | 38.2% | 39.8% | 41.6% | 48.1% | ||
| Small Urban Other Principal Arterial | 36.0% | 32.9% | 35.0% | 38.0% | 37.0% | ||
| Small Urban Minor Arterial | 41.1% | 43.6% | 39.2% | 38.2% | 38.5% | ||
| Small Urban Collector | 35.8% | 36.6% | 36.0% | 34.1% | 32.8% | ||
| Urbanized Interstate | 39.1% | 35.4% | 39.7% | 42.5% | 43.8% | ||
| Urbanized Other Freeway & Expressway | 34.1% | 27.4% | 31.3% | 31.9% | 32.8% | ||
| Urbanized Other Principal Arterial | 27.3% | 26.1% | 24.2% | 25.0% | 23.8% | ||
| Urbanized Minor Arterial | 39.9% | 40.8% | 37.8% | 33.9% | 33.4% | ||
| Urbanized Collector | 35.8% | 39.8% | 39.9% | 38.5% | 35.9% | ||
Again, a consistent trend is the faster rate of pavement condition improvement in rural areas versus small urban and urbanized areas. Since 1995, the percent of total rural road VMT on pavements classified as acceptable has increased in each of the four functional classes of rural roads. However, for the five functional classes of roads for small urban areas, only two functional classifications—other freeway and expressway, and other principal arterials—have seen an increase in VMT on pavements rated as acceptable, while the other three functional classes-Interstate, minor arterials, and collectors—have experienced declines. For the five functional classes of roads for the urbanized areas, only one functional classification—Interstate— has seen an increase in VMT on pavements rated as acceptable, while the other four functional classes—other freeway and expressway, other principal arterials, minor arterials, and collectors—have experienced declines.
Since the statistics based on VMT track reasonably well with those based on mileage and since the FHWA has chosen to use the former as its measure of effectiveness for performance planning, future editions of this report are likely to scale back on the use of mileage-based statistics in favor of VMT-based statistics.
Roadway Alignment
Alignment adequacy affects the level of service and safety of the highway system. There are two types of alignment: horizontal (curves) and vertical (grades). Inadequate alignment may result in speed reductions and impaired sight distance. In particular, excessive grades and/or curves may significantly affect the speeds at which trucks can safely operate. Alignment adequacy is evaluated on a scale from Code 1 (best) to Code 4 (worst). Exhibit 3-16 explains the alignment rating system.
| Rating | Description |
|---|---|
| Code 1 | All curves and grades meet appropriate design standards. |
| Code 2 | Some curves or grades are below design standards for new construction, but curves can be negotiated safely at prevailing speed limits. Truck speed is not substantially affected. |
| Code 3 | Infrequent curves or grades occur that impair sight distance or severely affect truck speeds. May have reduced speed limits. |
| Code 4 | Frequent grades occur that impair sight distance or severely affect truck speeds. Generally, curves are unsafe or uncomfortable at prevailing speed limit, or the speed limit is severely restricted due to the design speed limits of the curves. |
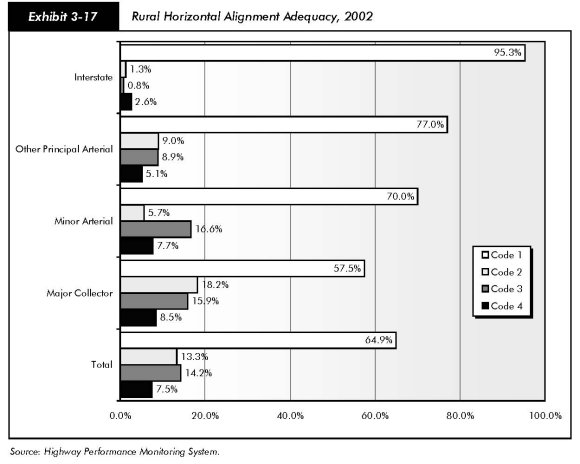
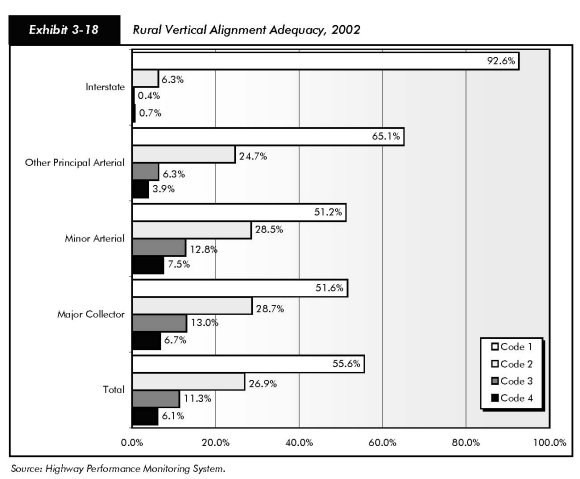
Adequate alignment is more important on roads with higher travel speeds and/or higher volumes (e.g., Interstates). Alignment is normally not an issue in urban areas; therefore, this section presents only rural data. Exhibits 3-17 and 3-18 illustrate that 95.3 percent of rural Interstate miles are classified as Code 1 for horizontal alignment and 92.6 percent are classified as Code 1 for vertical alignment. The share of rural roads classified as Code 4 for horizontal alignment is 7.5 percent. For vertical alignment, 6.1 percent are rated Code 4. Roadway alignment continues to improve gradually as sections with poor alignment are reconstructed.
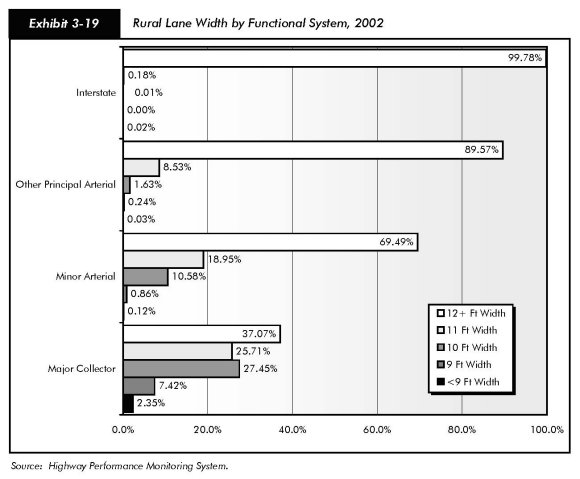
Lane Width
Lane width affects capacity and safety; narrow lanes prevent a road from operating at capacity. As with roadway alignment, lane width is more crucial on those functional classifications with higher travel volumes.
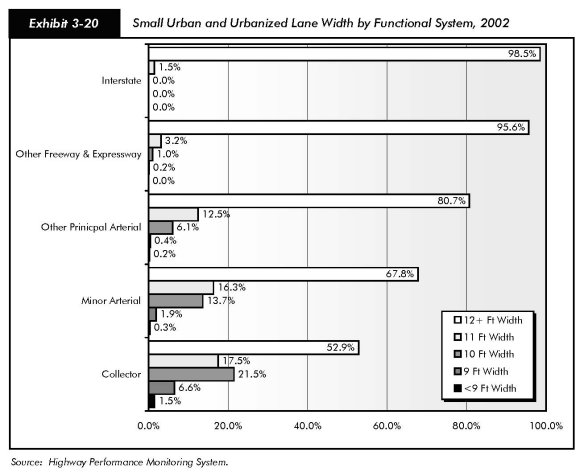
Currently, high-type facilities (e.g., Interstates) are expected to have 12-foot lanes. Exhibits 3-19 and 3-20 illustrate that almost the entire Interstate System meets the 12-foot standard (less than one-quarter of 1 percent of the rural Interstate and only 1.5 percent of the urban Interstate do not). The percentage of miles with 12-foot-plus lane widths is lower on lower-type facilities that carry less traffic. Lanes that are less than 9 feet wide are mainly concentrated on the collector roads.
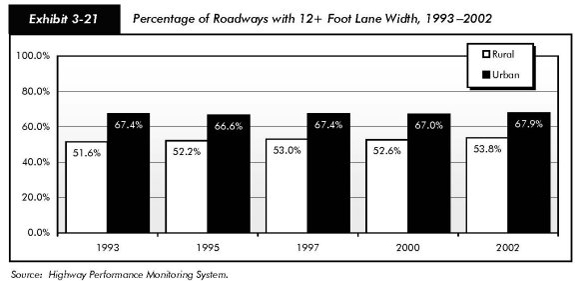
Lanes have been widened over time through new construction, reconstruction, and widening projects. Total rural mileage with lane width greater than or equal to 12 feet increased from 51.6 percent in 1993 to 53.8 percent in 2002. The urban mileage with 12-foot-plus lanes has fluctuated; but, in 2002, it was up to 67.9 percent from a low of 66.6 percent in 1995. Part of the reason for the urban fluctuation may be the reclassification of roads from rural to urban from time to time as a result of population growth [Exhibit 3-21].