

- Summary
- Highway Conditions
- Bridge Conditions
- Transit Conditions
- Road Conditions
- Pavement Terminology and Measurements
- Overall Pavement Condition
- Rural and Urban Pavement Conditions
- Pavement Condition by Functional Classification
- Roadway Alignment
- Lane Width
- Bridge System Conditions
- Classification of Bridge Deficiencies
- Condition Rating Structural Deficiencies
- Structural Appraisal Ratings
- Appraisal Rating Functional Obsolescence
- Number of Deficient Bridges
- Deficient Bridges by Owner
- Deficient Bridges by Functional Classification
- Classification of Bridge Deficiencies
- Transit System Conditions
- Bus Conditions
- Urban Bus Maintenance Facilities
- Age
- Condition
- Rail Vehicle Conditions
- Urban Rail Maintenance Facilities
- Age
- Condition
- Other Rail Urban Infrastructure
- The Value of U.S. Transit Assets
- Rural Transit Vehicles and Facilities
- Special Service Vehicles
Transit System Conditions
The condition of the U.S. transit infrastructure depends on the quantity, the age, and the physical condition of the assets that comprise it. This infrastructure includes vehicles in service, maintenance facilities and the equipment they contain, and other supporting infrastructure such as guideways, power systems, rail yards, stations, and structures such as bridges and tunnels.
The Federal Transit Administration (FTA) uses a numerical scale ranging from 1 to 5 to describe the condition of transit assets. This scale corresponds to the Present Serviceability Rating formerly used by the Federal Highway Administration to evaluate pavement conditions. A rating of 5, or "excellent," is synonymous with no visible defects or nearly new condition. At the other end of the scale, a rating of 1 indicates that the asset needs immediate repair and may have a seriously damaged component or components [Exhibit 3-39].
| Rating | Condition | Description |
|---|---|---|
| Excellent | 5 | No visible defects, near new condition. |
| Good | 4 | Some slightly defective or deteriorated components. |
| Fair | 3 | Moderately defective or deteriorated components |
| Marginal | 2 | Defective or deteriorated components in need of replacement. |
| Poor | 1 | Seriously damaged components in need of immediate repair. |
The FTA uses the Transit Economic Requirements Model (TERM) to estimate the conditions of transit assets. This model comprises a database of transit assets and deterioration schedules that express asset conditions principally as a function of an asset's age and, in the case of vehicles, as a function of their estimated usage and maintenance history. The deterioration schedules used by TERM were initially estimated using data collected by the Regional Transportation Authority of Northeastern Illinois and the Chicago Transit Authority in the 1990s and mid-1980s and, to a lesser extent, on data collected by the Metropolitan Commuter Rail Authority (Metra) and the suburban bus authority (Pace) at the same time. A detailed description of these deterioration schedules is provided in a January 1996 FTA report, "The Estimation of Transit Asset Condition Ratings." The deterioration curves developed from the Chicago data continue to be used in TERM, with the exception of those for vehicles, maintenance facilities, and stations. The deterioration schedules for these assets have been re estimated based on information collected from nationwide on site engineering sample surveys.
The FTA has found that the condition of transit vehicles can vary considerably even if they are the same age. Vehicle conditions depend on how well vehicles are maintained and the location in which they operate. Vehicles that are well maintained are generally in better condition for their age than vehicles that are not. Vehicles that operate in coastal areas or in areas where salt is extensively used to melt ice during the winter deteriorate more rapidly than vehicles that do not operate under these conditions. Between 1999 and 2003, FTA conducted a large number of on site inspections and collected information on the condition, age, and maintenance history of 1,179 transit vehicles. A total of 284 rail vehicles have been inspected: 88 commuter rail vehicles at 9 agencies, 94 heavy rail vehicles at 6 agencies, and 102 light rail vehicles at 11 agencies. A total of 895 bus vehicles have been inspected at 43 agencies. Fifty-eight articulated buses, 626 standard 40-foot buses, 84 low-floor 40-foot buses, 77 small buses (i.e., shorter than 40 feet), and 50 paratransit and vanpool vans were inspected [Exhibit 3-40].

| Vehicles | Number of Agencies |
|
|---|---|---|
| Buses | 895 | 43 |
| 1999 | 572 | 31 |
| 2001-2002 | 323 | 12 |
| Commuter Rail | 88 | 9 |
| 2003 | 88 | 9 |
| Heavy Rail | 94 | 6 |
| 2000 | 92 | 5 |
| 2001 | 2 | 1 |
| Light Rail | 102 | 11 |
| 2000 | 28 | 5 |
| 2001 | 74 | 6 |
| Total Number of Vehicles Inspected | 1,179 |
Each vehicle inspected was assigned an overall level of condition based on a weighted average of the condition of its subcomponents. For example, in the case of commuter rail, for which the most recent inspections were made, the subcomponents that were examined included the couplers, frame, bolster, gearbox, pneumatic piping, and wiring and connections. Vehicle exterior and interior subcomponents also were rated.
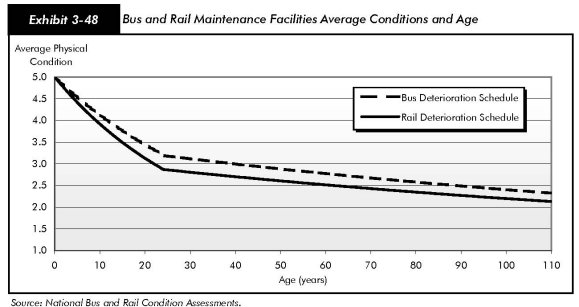
The FTA also has made a major effort to re estimate the deterioration schedules for maintenance facilities. Between 1999 and 2003, 165 on-site maintenance facility surveys have been conducted at 45 rail and bus agencies. Facility conditions were determined by the conditions of a range of facility components and subcomponents. The components that were examined included the roof structure, heating and ventilation systems, mechanical and plumbing systems, electrical equipment, specialty shops, and work bays and their subcomponents. The condition of each type of specialty shop (e.g., machine shop, metal working shop) was evaluated separately. The condition of each component is estimated as an average of the condition of its subcomponents. For example, the condition of a roof structure is based on an average of the conditions of its roofing frames, its gutters, and its drainage system. Bus and rail facilities, on average, follow different deterioration schedules. While rail facilities are estimated to fall to a condition of 3.0 in just under 25 years, bus facilities take 40 years to reach this condition. Most of the decline in both rail and bus maintenance facility conditions takes place in the first 23 years. During this time, facilities undergo relatively little major rehabilitation. After 23 years, they begin to undergo periods of rehabilitation, which leads to a very gradual deterioration over the remaining years of their lives [Exhibit 3-48 on page 3-44].
Since the 2002 edition of the C&P report, stations have used the same deterioration schedule as maintenance facilities. Prior to this report, stations used deterioration curves based on the relationship between station age and structure condition from data collected in Chicago. The decision to replace the station deterioration schedule based on Chicago data with the deterioration schedule for maintenance facilities was based on the premise that both stations and maintenance facilities are primarily structures, and the data collected for maintenance facilities were more recent and more accurate than the Chicago data. Engineering assessments of stations have recently been completed. Condition estimates based on newly estimated station deterioration curves will be provided in the 2006 edition of this report.
The TERM includes a detailed inventory of the physical assets of transit agencies in urbanized areas that report to the National Transit Database (NTD). Assets are segmented by mode, asset type, and asset age. This asset inventory was initially based on FTA studies in the early 1990s, which collected the number, purchase price, and date of purchase of bus, light rail, and heavy rail assets. This information was updated and supplemented with data collected from Chicago (also used to estimate deterioration schedules) and subsequently, through special data collection efforts, directly from agencies. The TERM has internal checks, which are used to generate values for assets that are not reported by agencies or in cases where the quality of asset information reported to FTA is poor. Missing or incorrect assets are identified using relationships between agency-mode-dimensions and expected dimensions. For example, an agency with 20 miles of rail investment would be expected to have half the investment in train control equipment as an agency with 40 miles of investment. The TERM uses industry standard relationships like this to check that the asset inventory in TERM makes sense and makes adjustments to the industry data as required. Industry standard relationships are also used to estimate data where no data exist.
Transit asset condition estimates are updated with information collected from on-site assessments in each edition of the C&P report to reflect any revisions made to deterioration rates. This edition of the report uses newly estimated deterioration curves for bus vehicles and for commuter rail vehicles. Since the last edition of the report in 2002, 323 bus vehicles inspections were undertaken at 12 agencies. This bus sample included a mix of full-size, 40 to 60-foot buses; medium and small buses; and vans. In 2003, 88 commuter rail vehicle inspections were undertaken at 9 agencies.
Transit vehicle asset conditions also reflect the most recently available information on vehicle age, use, and level of maintenance from the NTD. The information used in this report is for 2002. Age information is available on a vehicle-by-vehicle basis from the NTD, but information on use and maintenance expenditures are not reported for each vehicle separately. However, average vehicle use, i.e., vehicle revenue miles per vehicle, is available by agency, by mode. Average maintenance expenditures per vehicle are also available on an agency and modal basis. For this reason, for the purpose of calculating conditions, average agency use and maintenance expenditures for a particular mode are assumed to be the same for all vehicles operated by an agency in that mode. Because maintenance levels may fluctuate from year to year, TERM uses a 5-year average.
| Q. | What is the Asset Conditions Reporting Module (ACM)? |
| A. | The ACM is an effort, undertaken in 2002 through the NTD, to expand the collection of data on the Nation's transit asset infrastructure and its physical condition. Participation by agencies was voluntary. Several large operators opted not to participate, and not all agencies that participated submitted a complete set of information. The ACM data cover all asset types, excluding revenue vehicles. The ACM provided the following information, which is used to estimate transit asset conditions: (1) asset type, (2) asset age and quantity, (3) asset replacement cost, (4) the year in which the asset replacement cost is denominated, and (5) the percentage of the asset (e.g., facility) used by the reporting agency to provide transit services. In some cases, information reported to the ACM on the condition of an asset and its useful life was used to estimate the current age of the asset, which is used as input into TERM. |
Condition estimates in each new edition of the C&P report are based on updated asset inventory information and reflect updates in TERM's asset inventory. Since the 2002 C&P report, conditions for approximately 70 percent of the Nation's transit assets have been updated. Vehicle data from the NTD was used to update 22 percent of the TERM data and data collected by the NTD Asset Conditions Reporting Module (ACM) was used to update approximately 15 percent. An additional 30 percent of TERM data was updated with inventory data provided by the New York Metropolitan Transportation Authority (MTA). Capital unit costs were updated for heavy and light rail based on FTA capital cost studies undertaken since the last edition of this report.
The ACM data included asset inventories for a few key major rail operators—including the Southeastern Pennsylvania Transit Authority and Massachusetts Bay Transportation Authority—whose assets had previously been estimated within TERM. The ACM also provided real data for several recent light rail investments for which assets had previously been estimated, and more complete coverage on small to medium-size bus operators than what was previously available. In general, the ACM asset records were more complete and often implicitly reported a higher total replacement value for an asset than what existed in TERM.
Since the MTA alone accounts for roughly one fourth of the Nation's transit assets in urbanized areas, the data received from the MTA were used to update more than 50 percent of all data obtained directly from transit operators.
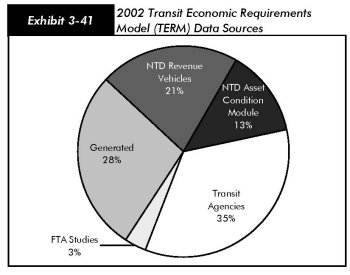
Thirty-five percent of the TERM's existing asset inventory is currently based on asset information directly provided by transit agencies. Twenty-one percent is based on revenue vehicle data from the 2002 NTD, and 13 percent is based on asset data from the 2002 ACM. Three percent is based on information collected by asset studies undertaken by FTA in the early to mid- 1990s. Twenty-eight percent of the asset inventory in TERM is generated endogenously; 35 percent of the data was generated endogenously before the inventory was updated with asset information collected by the ACM and from the MTA. Asset quantities are converted to values with asset replacement cost information collected by FTA. [Exhibit 3-41].
Bus Conditions
As a result of the bus assessments completed since the last edition of this report, bus deterioration schedules have been revised to reflect the fact that bus conditions decline slightly more rapidly during the first three years of life than previously estimated, and slightly less rapidly after the age of 15. The study found that vans, paratransit vehicles, and small buses tend to decay more rapidly than full-size buses and their condition estimates, although included in the total average, is based on a decay curve that is different from the one used to estimate the conditions of mid-size, full-size, and articulated motor buses. Variations among the average age of agencies' fleets and maintenance practices created large differences in average fleet conditions. Vehicles that are rehabilitated have condition levels approximately 0.5 higher than vehicles that are not.
Bus vehicle age and condition information is reported according to bus vehicle type for 1993 to 2002 in Exhibit 3-42. These condition estimates are based on slightly revised deterioration schedules for buses based on engineering surveys undertaken since the last report. The allocation of buses among bus categories also has been revised since the last edition of this report. The 2002 NTD collected information on buses according to length and seating capacity. Previously bus information had been collected according to the number of seats only, except for articulated buses, which were reported separately. Two condition estimates are reported in Exhibit 3-42 for 2002. The first column reports average conditions based on bus categories determined by seating capacity only (old classification system), and the second column reports conditions based on bus categories determined first by length, and when length was not available, by seating capacity (new classification system). The 2002 NTD data on length revealed that a larger percentage of buses were 45 feet or longer than was previously estimated. All buses 45 feet or longer must be articulated for structural reasons. Four hundred and fifty-eight vehicles were shifted from the full-size bus category to the articulated bus category. A considerable number of buses that were previously categorized as full-size and mid-size (4,761) have been reclassified as small. The number of articulated buses increased by 20 percent as a result of the reclassification, the number of full-size buses decreased by 7 percent, the number of mid-size buses decreased by 18 percent, and the number of small buses increased by 47 percent. Vans were not affected by the reclassification.
| Year | 1993 | 1995 | 1997 | 1999 | 2000 | 2002 | Revised Basis 2002 |
|---|---|---|---|---|---|---|---|
| Articulated Buses | |||||||
| Total Fleet | 1,807 | 1,716 | 1,523 | 1,967 | 2,078 | 2,307 | 2,765 |
| Percent Overage Vehicles | 16% | 33% | 61% | 46% | 29% | 15% | 17% |
| Average Age | 9.5 | 10.7 | 11.8 | 8.7 | 6.9 | 6.7 | 7.1 |
| Average Condition | 2.88 | 2.66 | 2.49 | 3.10 | 3.33 | 3.17 | 3.11 |
| Full-Size Buses | |||||||
| Total Fleet | 46,824 | 46,335 | 47,149 | 49,195 | 49,721 | 50,294 | 46,685 |
| Percent Overage Vehicles | 20% | 23% | 25% | 26% | 25% | 22% | 19% |
| Average Age | 8.5 | 8.6 | 8.2 | 8.7 | 8.5 | 7.7 | 7.5 |
| Average Condition | 2.82 | 2.83 | 2.86 | 2.90 | 2.93 | 2.99 | 3.02 |
| Mid-Size Buses | |||||||
| Total Fleet | 3,598 | 3,879 | 5,328 | 6,807 | 7,643 | 8,914 | 7,304 |
| Percent Overage Vehicles | 24% | 23% | 18% | 14% | 15% | 21% | 34% |
| Average Age | 6.4 | 6.8 | 5.6 | 5.7 | 5.7 | 5.6 | 8.1 |
| Average Condition | 3.14 | 3.08 | 3.30 | 3.30 | 3.30 | 3.30 | 2.93 |
| Small Buses | |||||||
| Total Fleet | 4,064 | 5,447 | 7,081 | 8,461 | 9,039 | 10,096 | 14,857 |
| Percent Overage Vehicles | 13% | 13% | 13% | 13% | 12% | 14% | 18% |
| Average Age | 4.0 | 4.0 | 3.7 | 4.0 | 4.2 | 4.1 | 4.5 |
| Average Condition | 3.48 | 3.55 | 3.56 | 3.51 | 3.47 | 3.53 | 3.39 |
| Vans2 | |||||||
| Total Fleet | 8,353 | 11,969 | 13,796 | 14,539 | 16,234 | 17,300 | 17,300 |
| Percent Overage Vehicles | 22% | 21% | 22% | 5% | 6% | 11% | 11% |
| Average Age | 3.1 | 3.2 | 2.3 | 3.2 | 3.2 | 3.2 | 3.2 |
| Average Condition | 3.59 | 3.71 | 3.75 | 3.71 | 3.71 | 3.62 | 3.62 |
| Total Fleet | 64,646 | 69,346 | 74,877 | 80,969 | 84,715 | 88,911 | 88,911 |
| Percent Overage Vehicles | 20% | 22% | 24% | 20% | 19% | 19% | 19% |
| Weighted Average Age | 7.4 | 7.3 | 6.6 | 7.0 | 6.8 | 6.2 | 6.2 |
| Average Condition | 2.87 | 2.88 | 2.94 | 3.01 | 3.05 | 3.21 | 3.19 |
2 Vehicles used in for both demand response and vanpool services.
Conditions have gradually improved for all bus vehicle types since 1993. In 2002, the estimated average condition of the urban bus fleet was 3.21 (old classification) and 3.19 (new classification) compared with 3.05 in 2000 and 2.87 in 1993. [Note that all condition estimates prior to 2002 are based on the old classification system since information on length was not collected.] This improvement in conditions reflects a decrease in the average age of the bus vehicle fleet from 7.4 years in 1993, to 6.8 years in 2000, to 6.2 years in 2002. Since 1993, larger vehicles (articulated, full-size, and mid-size buses) have tended to have, on average, slightly lower-rated conditions than smaller vehicles (small buses, vans). Vans, paratransit vehicles, and small buses, in general, decay more rapidly than full-size buses. Vans typically reach a condition of 2.5 in 7 years, compared with 14 years, on average, for a 40-foot bus. Average bus fleet conditions vary considerably from agency to agency. Average bus fleet conditions ranged from 2.30 to 4.40 for the 31 agencies that participated in the most recent FTA bus vehicle conditions assessment.
Articulated buses experienced the largest fluctuations in conditions between 1993 and 2002, ranging from 2.49 in 1997 to 3.33 in 2000. In 2002, the average condition of articulated buses was 3.11 (new classification) and 3.17 (old classification). The fluctuations in articulated bus conditions are most likely the result of a 12-year industry replacement policy and the fact that the bulk of articulated buses were purchased between 1983 and 1984. This replacement cycle is evidenced by a peak in the percentage of articulated buses that were overage at 61 percent in 1997, and the subsequent decline in this percentage to 17 percent (new classification) in 2002. Mid-size buses have maintained an average condition above 3.0 in all years based on the old bus classification systems. However, based on the new classification system, their average condition fell from 3.30 in 2000 to 2.93 in 2002 as a considerable number of these vehicles in better-than-average condition for this category were reclassified as small buses. Both small buses and vans have consistently maintained an average condition of close to 3.5 or higher. Vehicles reclassified from the full and mid-size bus categories to the small bus category lowered the average conditions of small buses from 3.47 in 2000 to 3.39 in 2002. Full-size buses, which were on average consistently just below "adequate" condition between 1993 and 2000, reached an "adequate" average condition of 3.02 in 2002 under the new classification system.
Urban Bus Maintenance Facilities
Age
The estimated age distribution of urban maintenance facilities for bus, vanpool, and demand response systems in 2002 is shown in Exhibit 3-43. This distribution is based on age information collected by the 1999 and 2002 National Bus Condition Assessments and applied to the total national bus facilities in 2002 as reported in the NTD. The percentage of bus maintenance facilities less than 10 years old increased from 8 percent in 2000 to 12 percent in 2002, and the percentage more than 30 years old declined from 31 to 24 percent. The percentage of facilities aged 11 to 30 years remained about the same, increasing from 61 to 64 percent, but within this distribution the proportion of facilities aged 20 years to 30 years increased. Individual facility ages may not relate well to condition, since substantive renovations are made to facilities at varying intervals over time.

| Age (years) | 2002 | |
|---|---|---|
| Number | Percent | |
| 0-10 | 151 | 12% |
| 11-20 | 406 | 33% |
| 21-30 | 372 | 31% |
| 31+ | 289 | 24% |
| Total | 1,219 | 100% |
and purchased transportation services. Exhibit 2-18
in Chapter 2 reports the number of maintenance
facilities for directly operated services only.
Condition
The average condition of maintenance facilities for buses, including vans and demand response vehicles, improved from 3.23 in 2000 to 3.34 in 2002. In 2002, 55 percent of all urban bus maintenance facilities were in adequate condition, 6 percent in good condition, and 7 percent in excellent condition, for a combined total of 68 percent in compared with 71 percent in adequate-or-better condition in 2000. Thirty-three percent of these facilities, however, are estimated to be in unacceptable condition—32 percent in substandard condition and 1 percent in poor condition. In 2000, 24 percent were in substandard condition and 5 percent in poor condition. [The average condition within each condition category increased, leading to an increase in average condition in spite of the slight decrease in the percentage of facilities in adequate or better condition.] [Exhibit 3-44]
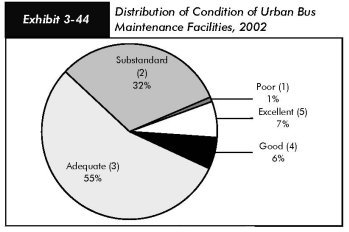
| Condition | 2002 | |
|---|---|---|
| Number | Percent | |
| Excellent (5) | 83 | 7% |
| Good (4) | 68 | 6% |
| Adequate (3) | 672 | 55% |
| Substandard (2) | 387 | 32% |
| Poor (1) | 10 | 1% |
| Total | 1,219 | 100% |
Rail Vehicle Conditions
The average rail vehicle condition increased to 3.47 in 2002, from 3.38 in 2000, reflecting a decline in the average age from 21.8 years in 2000 to 20.4 years in 2002. By comparison, in 1993 the average rail vehicle condition was 3.54 and average age 17.7 years [Exhibit 3-45]. Average rail vehicle age and condition are heavily influenced by the average age and condition of heavy rail vehicles, which account for 60 percent of the total U.S. rail fleet. All rail vehicles combined have been, on average, in slightly better condition than all bus and bus-type vehicles. The condition of all rail vehicles combined averaged 3.45 for the years 1993 to 2002.
Changes in ages and conditions of all rail vehicles appear to fall within the range of normal depreciation, rehabilitation, and replacement cycles. In 2002, the average condition of each of the individual vehicle types was slightly lower or the same as in 1993, and the average age slightly higher except in the case of commuter rail self-propelled passenger coaches, which is significantly higher. In contrast with other rail vehicle types, the average age of commuter rail self-propelled vehicles has increased substantially, although the decline in their average condition has been more moderate, indicating that these vehicles have received a substantial amount of rehabilitation since 1993. (The percentage of overage commuter rail self-propelled passenger coaches increased from 6 percent in 1993 to 68 percent in 2002, their average age climbed from 18.2 to 27.1 years, and their condition declined from 3.69 to 3.50).
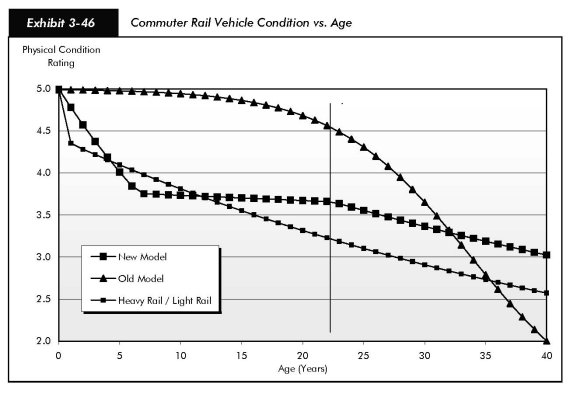
The average condition of commuter rail vehicles has been re-estimated based on engineering surveys of rail vehicle physical conditions undertaken in 2002. These new estimates are lower than those previously reported. This downward revision is similar to the one that occurred for heavy and light rail vehicles as a result of surveys made between 1999 and 2001 and reported in the 2002 edition of this report. It has led to a reduction in the commuter rail conditions, reported in earlier editions of this report, by about 15 percent. Analysis of the rail vehicle condition information collected by the engineering survey revealed that commuter rail vehicles decay more rapidly in early years than previously estimated. It was also revealed that the deterioration schedule of commuter rail vehicles differs from the deterioration schedule of heavy and light rail vehicles. Heavy and light rail vehicles deteriorate most rapidly in the first year of life, and then shift to a more gradual rate of constant decline for the remainder of their lives. By comparison, commuter rail vehicles deteriorate most rapidly in the first five years of their lives, at which point their conditions plateau until they reach approximately 22 years. After this, their condition starts to decline again albeit very gradually [Exhibit 3-46]. The conditions, shown in Exhibit 3-46, reflect these revisions and are not directly comparable to conditions reported in earlier editions of this report.
| Year | 1993 | 1995 | 1997 | 1999 | 2000 | 2002 |
|---|---|---|---|---|---|---|
| Commuter Rail Locomotives | ||||||
| Total Fleet | 556 | 570 | 586 | 644 | 591 | 709 |
| Percent Overage Vehicles | 17% | 21% | 22% | 17% | 19% | 23% |
| Average Age | 15.6 | 15.6 | 16.5 | 16.1 | 15.8 | 16.9 |
| Average Condition | 3.77 | 3.77 | 3.70 | 3.82 | 3.77 | 3.72 |
| Commuter Rail Passenger Coaches | ||||||
| Total Fleet | 2,402 | 2,402 | 2,470 | 2,886 | 2,793 | 2,985 |
| Percent Overage Vehicles | 29% | 36% | 33% | 32% | 29% | 34% |
| Average Age | 18.6 | 20.1 | 19.8 | 18.5 | 17.7 | 19.0 |
| Average Condition | 3.68 | 3.63 | 3.68 | 3.74 | 3.76 | 3.68 |
| Commuter Rail Self-Propelled Passengers Coaches | ||||||
| Total Fleet | 2,526 | 2,645 | 2,681 | 2,455 | 2,472 | 2,389 |
| Percent Overage Vehicles | 6% | 24% | 25% | 60% | 61% | 68% |
| Average Age | 18.2 | 19.7 | 22.0 | 24.3 | 25.2 | 27.1 |
| Average Condition | 3.69 | 3.68 | 3.62 | 3.57 | 3.55 | 3.50 |
| Heavy Rail | ||||||
| Total Fleet | 10,074 | 10,157 | 10,173 | 10,366 | 10,375 | 11,093 |
| Percent Overage Vehicles | 27% | 37% | 36% | 40% | 40% | 36% |
| Average Age | 17.8 | 19.3 | 21.0 | 22.5 | 23.0 | 20.0 |
| Average Condition | 3.47 | 3.39 | 3.31 | 3.26 | 3.25 | 3.41 |
| Light Rail | ||||||
| Total Fleet | 943 | 955 | 1,132 | 1,400 | 1,524 | 1,637 |
| Percent Overage Vehicles | 10% | 12% | 10% | 15% | 13% | 14% |
| Average Age | 14.9 | 14.8 | 14.6 | 18.9 | 18.4 | 16.1 |
| Average Condition | 3.64 | 3.55 | 3.63 | 3.62 | 3.63 | 3.61 |
| Total Rail | ||||||
| Total Fleet | 16,501 | 16,729 | 17,042 | 17,751 | 17,755 | 18,813 |
| Percent Overage Vehicles | 23% | 33% | 32% | 39% | 38% | 37% |
| Weighted Average Age | 17.7 | 19.1 | 20.4 | 21.6 | 21.8 | 20.4 |
| Weighted Average Condition | 3.54 | 3.48 | 3.42 | 3.40 | 3.38 | 3.47 |
Urban Rail Maintenance Facilities
Age
Data collected since the last edition of this report through the ACM reveal that a much larger percentage of rail maintenance facilities are less than 10 years old and a much smaller percentage are more than 30 years old than was previously estimated. In 2002, 30 percent of all rail facilities were estimated to be 10 years old or less (compared with 15 percent in 2000), and 33 percent were estimated to be more than 30 years old (compared with 48 percent in 2000) [Exhibit 3-47].

| Age of Facility | Number | Percent |
|---|---|---|
| 0-10 | 47 | 30% |
| 11-20 | 38 | 24% |
| 21-30 | 19 | 12% |
| 31+ | 52 | 33% |
| Total | 156 | 100% |
Condition
In 2002, the average condition of urban rail maintenance facilities was estimated to be 3.56, compared with 3.20 in 2000. The estimated condition improved largely due to expanded information on facilities ages collected by the ACM. As Exhibit 3-49 shows, in 2000, 30 percent of all rail maintenance facilities were estimated to be in good or excellent condition and 80 percent in adequate or better condition. Twenty percent, however, are believed to be in poor or substandard condition and have immediate capital investment needs.
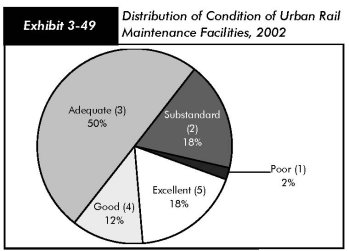
| Condition | 2002 | |
|---|---|---|
| Number | Percent | |
| Excellent (5) | 27 | 18% |
| Good (4) | 18 | 12% |
| Adequate (3) | 76 | 50% |
| Substandard (2) | 27 | 18% |
| Poor (1) | 3 | 2% |
| Total | 152 | 100% |
Other Rail Urban Infrastructure
The condition of rail urban infrastructure other than maintenance facilities and stations is estimated on the basis of decay curves principally relating condition to age, although the conditions a few nonvehicle assets are also estimated on the basis of usage and maintenance history. This information is based primarily on rail asset information collected by the Chicago Transit Authority during the 1980s and 1990s for an Engineering Condition Assessment. Additional, but considerably more limited, asset condition data were provided by Metra and Pace, two transit operators in the Chicago area at that time. The data collected were used to estimate decay curves for more than 40 types of transit assets and averaged into a smaller number of aggregate decay curves, according to each asset's contribution to the total replacement cost for the group of assets into which it was averaged. As a part of the validation process, industry experts reviewed the results and assessed whether they accurately captured the dynamics of transit asset decay. The results were published in The Estimation of Transit Asset Condition Ratings, Heavy Rail Systems, January 1996.
Infrastructure data are based on the dollar amounts spent on different asset types (in constant dollars) rather than a numeric count of the assets. Earlier versions of this report, therefore, only provided condition results for these assets displayed as percentages across condition levels. This information is believed to be more accurate than average condition estimates. Bearing this in mind, however, this edition of the report also provides estimates of average condition by asset type [Exhibit 3-50].
| CONDITION ESTIMATES 2000 |
CONDITION ESTIMATES 2002 |
Distribution of Assets by Condition | |||||||||||||||
|---|---|---|---|---|---|---|---|---|---|---|---|---|---|---|---|---|---|
| 1 POOR 1997 2000 2002 |
2 SUBSTANDARD 1997 2000 2002 |
3 ADEQUATE 1997 2000 2002 |
4 GOOD 1997 2000 2002 |
5 EXCELLENT 1997 2000 2002 |
|||||||||||||
| Maintenance | |||||||||||||||||
| Facilities | 3.20 | 3.56 | 6% | 12% | 2% | 17% | 24% | 18% | 17% | 43% | 50% | 53% | 21% | 12% | 7% | 0% | 18% |
| Yards | 4.00 | 3.64 | 0% | 0% | 0% | 0% | 0% | 20% | 37% | 50% | 48% | 63% | 50% | 31% | 0% | 0% | 1% |
| Power Systems | |||||||||||||||||
| Substations | 4.17 | 4.33 | 12% | 6% | 4% | 6% | 6% | 2% | 10% | 10% | 12% | 57% | 58% | 51% | 15% | 20% | 31% |
| Overhead Wire | 4.00 | 3.93 | 5% | 6% | 8% | 11% | 6% | 11% | 18% | 11% | 16% | 34% | 61% | 46% | 32% | 16% | 19% |
| Third Rail | 4.05 | 4.10 | 14% | 8% | 7% | 11% | 8% | 7% | 15% | 11% | 13% | 43% | 48% | 50% | 17% | 24% | 23% |
| Track | 4.06 | 4.17 | 7% | 7% | 6% | 10% | 10% | 9% | 10% | 12% | 12% | 49% | 45% | 34% | 24% | 26% | 40% |
| Structures | |||||||||||||||||
| Elevated Structure | 4.02 | 4.27 | 1% | 2% | 2% | 29% | 22% | 7% | 12% | 16% | 3% | 59% | 59% | 83% | 0% | 2% | 5% |
| Underground Tunnels | 3.75 | 4.09 | 9% | 12% | 8% | 19% | 11% | 9% | 18% | 19% | 13% | 47% | 46% | 37% | 7% | 12% | 34% |
| Stations | 3.44 | 2.99 | 15% | 0% | 30% | 13% | 16% | 26% | 15% | 50% | 18% | 46% | 33% | 22% | 11% | 1% | 3% |
Information collected by ACM and directly from MTA has replaced 46 percent of the nonvehicle data collected from these earlier studies, which was used in the last edition of this report. The nonvehicle asset condition levels for 2002 provided in Exhibit 3-50 reflect these updates to the asset inventory information and new information provided to the NTD. The decay curves used to estimate conditions are the same as used in previous editions of this report. Conditions for 1992, reported in the 2000 edition of this report, have been dropped from Exhibit 3-50. These condition estimates were based on earlier surveys and are not fully comparable with estimates for subsequent years.
As discussed earlier, rail maintenance facilities are in better condition than previously estimated. By comparison, the condition of maintenance yards (vehicle storage yards) has declined. In 2002, 32 percent of all yards were in good or excellent condition, compared with 50 percent in 2000. The percentage in substandard condition increased from 0 percent in 2000 to 20 percent in 2002. No yards were reported as being in poor condition in either 2000 or 2002.
Power systems are on average in good condition. Changes in the conditions of power systems are mixed, depending on the particular asset type. The estimated condition of substations increased from 4.17 in 2000 to 4.33 in 2002. The percentage of substations in excellent condition increased from 20 percent in 2000 to 31 percent in 2002. The condition of overhead wire declined slightly from 4.00 in 2000 to 3.93 in 2002. In 2002, 65 percent of overhead wire was reported to be in good or excellent condition compared with 77 percent in 2000. The estimated conditions of third rail increased very slightly from 4.05 to 4.10. There were only very minor changes in the distribution of third rail according to condition.
Track conditions are estimated to have improved slightly from an average condition of 4.06 in 2000 to an average condition of 4.17 in 2002, principally on the basis of updated information. The percentage of track in excellent condition increased from 26 percent in 2000 to 40 percent in 2002, and the percentage in good condition declined from 45 to 34 percent. The percentage of track in substandard or poor condition was relatively unchanged, falling from 17 to 15 percent.
The estimated conditions of structures also improved. The average condition of elevated structures increased from 4.02 in 2000 to 4.27 in 2002. The percentage of elevated structures in good or excellent condition increased from 59 percent in 2000 to 83 percent in 2002, and the percent in excellent condition increased from two to five percent over the same period. The average condition of underground tunnels increased from 3.75 to 4.09. The percentage of underground tunnels in excellent condition increased from 12 percent in 2000 to 34 percent in 2002, largely due to a shift out of the good to the excellent condition category. The percentage of underground tunnels in substandard and poor condition decreased from 23 percent in 2000 to 17 percent in 2002.
The condition of rail stations is estimated to have declined from 3.53 to 2.87. Although the percentage of all stations in excellent condition increased from 1 percent in 2000 to 3 percent in 2002, the percentage in good condition fell from 33 to 22 percent and the percentage in substandard or poor condition increased from 42 percent in 2000 to 56 percent in 2002. FTA will be undertaking physical inspections of a sample of stations in 2004. The results of these inspections will be included in the 2006 edition of this report.
| Q. | How does the condition of nonrail stations compare with the condition of rail stations? |
| A. | Nonrail stations are in better condition than rail stations. The condition of nonrail stations is estimated to have declined from 4.65 in 2000 to 4.37 in 2002. The condition of stations for all modes combined declined from 3.44 in 2000 to 2.99 in 2002. |
The Value of U.S. Transit Assets
The value of the transit infrastructure in the United States is estimated to be $347.7 billion in 2002 dollars based on the information contained in TERM and on data collected through the NTD and the other data collection efforts discussed in this chapter. It excludes the value of assets that belong to rural and special service operators that do not report to the NTD. The reader should bear in mind that this is a very preliminary estimate, which will be subject to revision as more information is collected. Rail assets are estimated to be $264.6 billion, nonrail assets are estimated to be $66.7 billion, and systems are estimated to be $16.4 billion [Exhibit 3-51]. The systems category comprises assets that serve more than one mode within a single agency. Systems investments include administrative facilities, the external structure and furniture and equipment within, intermodal transfer centers, agency communications systems (such as PBX, radios, and computer networks), and vehicles used by agency management (such vans and autos).
| (Billions of current dollars) | ||||
|---|---|---|---|---|
| Nonrail | Rail | Systems | Total | |
| Maintenance Facilities | $38.0 | $6.4 | $4.4 | $48.9 |
| Guideway Elements | $2.5 | $130.9 | $0.6 | $134.0 |
| Stations | $1.4 | $42.9 | $9.0 | $53.3 |
| Power Systems | $0.6 | $33.6 | $1.5 | $35.6 |
| Vehicles | $24.3 | $50.7 | $0.9 | $75.9 |
| Grand Total | $66.7 | $264.6 | $16.4 | $347.7 |
Rural Transit Vehicles and Facilities
Data on the conditions of rural vehicles and facilities have not been updated since the 2002 edition of the report. The most recent data available were collected from surveys funded by the FTA and conducted by the Community Transportation Association of America. The information was collected between June 1997 and June 1999. The responses of the 158 rural operators that responded to these surveys have been combined. Note that for the purpose of these surveys, rural operators are defined as those operators outside urbanized areas, a different definition than used by the U.S. Census. These surveys found that more than 50 percent of the rural transit fleet was over age. Forty-one percent of small buses, 34 percent of medium-size buses, 27 percent of full-size buses, and 60 percent of vans and other vehicles were found to be overage [Exhibit 3-52]. Small buses more than 7 years old, medium buses more than 10 years old, large buses more than 12 years old, and vans more than 5 years old were categorized as over age.
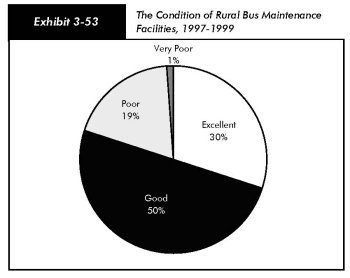
These surveys also found that 30 percent of bus rural maintenance facilities were in excellent condition, 50 percent in good condition, 19 percent in poor condition, and 1 percent in very poor condition [Exhibit 3-53].

| 1997-1999 | Total Fleet | Average Age | Percent Overage |
|---|---|---|---|
| Full-Size buses | 767 | 7.8 | 27% |
| Medium-Size Buses | 1,727 | 7.6 | 34% |
| Small Buses | 4,413 | 5.7 | 41% |
| Vans and Other | 11,991 | 7.0 | 60% |
| Total | 18,898 | 6.8 | 52% |
Special Service Vehicles
No information is available on the age and condition of special service vehicles. FTA estimated that in 2002 nearly 60 percent of special service vehicles were more than 5 years old.