


System Conditions: Transit
U.S. transit system conditions depend on the quantity, age, and physical condition of the assets that make up the Nation's transit infrastructure. This infrastructure includes vehicles in service, maintenance facilities, the equipment they contain, and other supporting infrastructure such as guideways, power systems, rail yards, stations, and structures (bridges and tunnels).
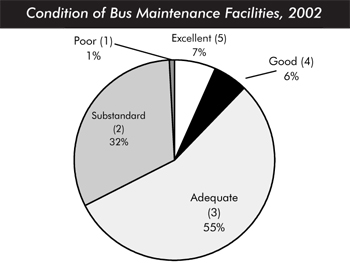
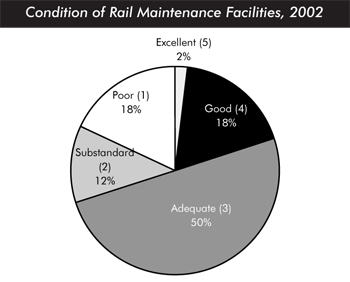
The Federal Transit Administration (FTA) has undertaken extensive engineering surveys and collected a considerable amount of data on the U.S. transit infrastructure to evaluate transit asset conditions. FTA uses a rating system of 1 "poor" to 5 "excellent" to describe asset conditions.
| Rating | Condition | Description |
|---|---|---|
| Excellent | 5 | No visible defects, near new condition. |
| Good | 4 | Some slightly defective or deteriorated components. |
| Fair | 3 | Moderately defective or deteriorated components |
| Marginal | 2 | Defective or deteriorated components in need of replacement. |
| Poor | 1 | Seriously damaged components in need of immediate repair. |
The average condition of urban bus vehicles increased from 3.05 in 2000 to 3.19 in 2002. The average condition of bus maintenance facilities increased from 3.23 in 2000 to 3.34 in 2002. In 2002, 68 percent of bus maintenance facilities were in adequate or better condition.
The average condition of rail vehicles increased from 3.38 in 2000 to 3.47 in 2002. The average age of rail vehicles declined from 21.8 years in 2000 to 20.4 years in 2002. Commuter rail vehicle conditions have been revised using new deterioration schedules based on engineering surveys undertaken in 2002. As a result, the commuter rail conditions in this edition of the report are about 15 percent lower than those reported in earlier editions.
Additional data collected by FTA since the last edition of this report revealed that the percentage of rail maintenance facilities that are less than 10 years old is higher than previously estimated. This new information has led to an upward revision in the condition estimate of rail maintenance facilities from 3.18 in 2000 to 3.56 in 2002. In 2002, 80 percent of rail maintenance facilities were estimated to be in adequate or better condition.
From 2000 to 2002, the conditions of track, substations, structures and third rail improved. The conditions of rail yards, overhead wire and stations declined. Station conditions fell from 3.4 in 2000 to 3.0 in 2002. This decrease was largely the result of new information collected directly from transit agencies rather than an actual change. Rail station conditions are, on average, considerably lower than bus station conditions.