

- Summary
- Highways and Bridges
- Transit
- Highway and Bridge Spending Versus Investment Scenario Estimates
- Average Annual Investment Scenario Estimates Versus 2004 Spending
- Types of Improvements
- Comparison with Previous Reports
- Transit Capital Spending Compared with Investment Scenario Estimates
- 2004 Capital Spending and Estimated Average Annual Investment by Scenario.
- Comparisons by Asset Type
- Historical Comparisons
- Capital Investment and Rehabilitation and Replacement Needs
- Capital Spending and TERM Investment Estimates
- 2004 Capital Spending and Estimated Average Annual Investment by Scenario.
Summary
This chapter compares the current spending for capital improvements described in Chapter 6 with the future investment scenarios outlined in Chapter 7. These comparisons are intended to be illustrative, rather than to endorse a specific level of future investment. While the analysis identifies gaps between the investment scenario estimates and current spending levels, it does not take a position as to whether or not these gaps should be closed. The impacts of different levels of investment are discussed in Chapter 9.
The size of the gap between an investment scenario and current spending is dependent on the investment analysis and the underlying assumptions used to develop that analysis. See the Introduction to Part II for critical caveats concerning the interpretation of these results. Chapter 10 explores the impacts that varying some assumptions would have on the investment scenario estimates.
Exhibit 8-1 compares the difference between the investment scenario estimates and spending in this report with the corresponding difference based on the data shown in the 2004 C&P report. The first column of figures contains values shown in the 2004 C&P report, which compared 2002 spending with the average annual investment scenario estimates for 2003 to 2022.
| Percent by which Investment Scenario Estimates Exceed Current Spending |
Based on 2002 Data | Based on 2004 Data |
|---|---|---|
| Cost to Maintain | ||
| Highways and Bridges | 8.3% | 12.2% |
| Transit | 26.8% | 25.4% |
| Cost to Improve | ||
| Highways and Bridges (Maximum Economic Investment Level) | 74.3% | 87.4% |
| Transit | 95.1% | 73.0% |
Highways and Bridges
The average annual investment level under the "Cost to Maintain Highways and Bridges" scenario in the 2004 C&P report was 8.3 percent ($5.7 billion) higher than highway capital expenditures in 2002. The estimated gap increased to 12.2 percent ($8.5 billion) in 2004. The difference between the "Maximum Economic Investment Level for Highways and Bridges (Cost to Improve)" and 2004 spending is 87.4 percent ($61.4 billion). This represents an increase over the 74.3 percent gap estimated in the 2004 C&P report ($50.7 billion), based on the spending figures for 2002 presented in that report.
The changes in the size of the estimated gap between current spending and the investment scenarios are largely the result of improvements in the modeling of highway performance (most notably the linkage of investment levels to revenue sources) and the cost of capital improvements, particularly in large urbanized areas. The net impact of these changes is a small increase in the size of the estimated gap.
Transit
The estimated gap between current spending on transit capital investment and the investment estimates to maintain and improve conditions and performance has narrowed since the 2004 report. The estimated gap between actual spending and the amount to maintain conditions and performance narrowed very slightly from 26.8 to 25.4 percent; the estimated gap between actual spending and the amount to improve conditions and performance declined more markedly from 95.1 to 73.0 percent due to the decrease in the estimated amount to improve performance.
The Federal Transit Administration's (FTA's) estimate of the average annual investment to maintain transit asset conditions and performance between 2005 and 2024 is $15.8 billion annually, $3.2 billion (25.4 percent) more than actual spending in 2004; FTA's estimate to improve transit asset conditions and performance between 2005 and 2024 is $21.8 billion annually, $9.2 billion (73.0 percent) more than actual spending in 2004. FTA estimates to maintain conditions and performance from 2003 to 2022 provided in the 2004 report were 26.8 percent above actual capital spending in 2002; FTA estimates to improve conditions and performance were 95.1 percent above actual capital investment in 2002.
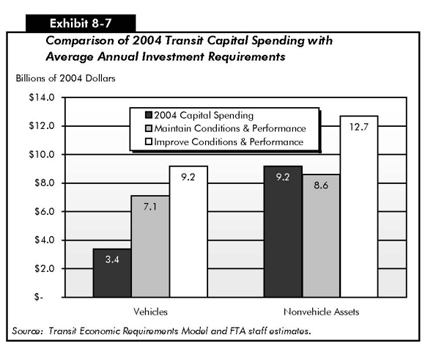
The portion of the "Maintain Conditions and Performance" scenario estimate for capital investment in vehicles is $7.1 billion annually, 109 percent more than actual expenditures of $3.4 billion in 2004; the portion of the "Improve Conditions and Performance" scenario estimate for capital investment in vehicles is $9.2 billion annually, or 171 percent more than actual expenditures in 2004. The nonvehicle transit infrastructure component of the "Maintain Conditions and Performance" scenario is estimated to be $8.6 billion annually, or 7 percent below actual expenditures of $9.2 billion in 2004; the capital investment in nonvehicle transit infrastructure component of the "Improve Conditions and Performance" scenario is estimated to be $12.7 annually, or 38 percent more than actual expenditures in 2004.
Highway and Bridge Spending Versus Investment Scenario Estimates
This section compares the average annual investment scenario estimates presented in Chapter 7 with the 2004 highway and bridge capital spending outlined in Chapter 6. As noted in Chapter 7, the investment scenario estimates presented here are based on the assumption that the current financing structure for highways in the United States will continue into the future. Changes in this structure toward a more efficient regime using congestion pricing would have an impact on the future investment scenario estimates and any gaps with current spending levels. Chapter 10 includes an analysis of the theoretical impact that an efficient pricing system could have on the estimates.
|
|
|
Does this report recommend any specific level of investment?
No. The investment analysis in this report is intended to estimate what the consequences of various levels of spending might mean for highway system performance. The comparisons in this chapter between current spending and the highway and bridge investment scenarios are intended to be illustrative only. They are not intended to endorse any of the investment scenarios as the "correct" level of transportation investment.
|
Average Annual Investment Scenario Estimates Versus 2004 Spending
Exhibit 8-2 compares the average annual investment estimates under the "Cost to Maintain" and "Maximum Economic Investment" scenarios [see Chapter 7] with 2004 highway and bridge capital expenditures. The average annual "Cost to Maintain Highways and Bridges" projected for the 2005 to 2024 period is $8.5 billion (12.2 percent) higher than 2004 capital expenditures, while the estimated "Maximum Economic Investment for Highways and Bridges" exceeds current spending by $61.4 billion (87.4 percent). Expenditures for bridge rehabilitation in 2004 exceeded the corresponding component of the "Cost to Maintain" scenario, which is drawn from the "Maintain Economic Backlog" scenario in the National Bridge Investment Analysis System (NBIAS) [see Chapter 7].
| Investment Scenario Estimates (Billions of 2004 Dollars) | |||||
|---|---|---|---|---|---|
| 2004 Capital Outlay ($ Billions) | Cost to Maintain | Percent Above Current Spending | Maximum Economic Investment | Percent Above Current Spending | |
| System Rehabilitation: Highways | $26.0 | $31.9 | 23.0% | $48.6 | 87.1% |
| System Rehabilitation: Bridges | $10.5 | $8.7 | -16.6% | $12.4 | 18.6% |
| System Expansion | $27.5 | $31.0 | 12.9% | $58.8 | 113.9% |
| System Enhancements | $6.4 | $7.1 | 12.2% | $11.9 | 87.4% |
| Total | $70.3 | $78.8 | 12.2% | $131.7 | 87.4% |
While the percentage "gap" between 2004 highway resurfacing and reconstruction spending and the "Cost to Maintain" scenario is the largest among the subsets of highway and bridge spending shown in Exhibit 8-2, this does not indicate that current investment is inadequate to maintain pavement conditions. As noted in Chapter 7, the Highway Economic Requirements System (HERS)-derived component of the "Cost to Maintain" scenario is aimed at maintaining user costs rather than maintaining pavement conditions. The larger "gap" shown for the highway component of system preservation indicates that HERS has identified a large pool of potential pavement improvements that could yield significant benefits in terms of reducing user costs. While the ride quality on many functional systems has been improving in recent years (as reported in Chapter 3), the models indicate that many pavement improvements in both the near-term and longer-term future will continue to have high rates of return. The impact of investment on highway conditions and performance is discussed in more detail in Chapter 9.
Types of Improvements
Exhibit 8-3 compares the distribution of highway and bridge capital outlay by improvement type for the "Cost to Maintain Highways and Bridges" and the "Maximum Economic Investment for Highways and Bridges" with the actual pattern of capital expenditures in 2004. In that year, 39.1 percent of highway and bridge capital outlay went for system expansion.
|
|
|
How does the improvement mix for the investment scenarios in this report compare with those in the 2004 C&P report?
The investment scenarios in this report are more heavily weighted toward capacity relative to system rehabilitation improvements than in the previous report. One factor in this shift is the lower percentage of total investment under the scenarios that are represented by bridge rehabilitation and replacement, which has not changed significantly since the previous report. Other factors are related to changes in the HERS methodology discussed in Chapters 7 and 10 and in Appendix A, including revised estimates of the unit costs of the different types of capital improvements (particularly in large urbanized areas) and to the use of lower values for travel demand elasticity.
|
The distribution of funding by investment type suggested by the investment scenarios developed using the HERS and NBIAS models depends on the level of available funding. For the "Cost to Maintain Highways and Bridges" scenario, 39.4 percent of the projected 20-year investment level is for system expansion, marginally higher than its share of current capital spending. If funding were to rise significantly above this level, the analysis suggests that even more cost-beneficial system expansion expenditures would be found, so that, for the "Maximum Economic Investment" scenario, 44.6 percent of the total investment is for system expansion, slightly below the share for system rehabilitation (46.3 percent).
| System Rehabilitation | ||||||
|---|---|---|---|---|---|---|
| Highway | Bridge | Total | System Expansion | System Enhancement | Total | |
| 2004 Capital Outlay | 37.0% | 14.9% | 51.8% | 39.1% | 9.0% | 100.0% |
| Cost to Maintain Highways and Bridges | 40.5% | 11.1% | 51.6% | 39.4% | 9.0% | 100.0% |
| Maximum Economic Investment for Highways and Bridges | 36.9% | 9.4% | 46.3% | 44.6% | 9.0% | 100.0% |
As discussed in Chapter 7, investment estimates for non-modeled items were determined by assuming that any future increase in this type of investment would be proportional to increases in total capital spending. For system enhancement, the percentages for the "Maximum Economic Investment for Highways and Bridges" and for the "Cost to Maintain Highways and Bridges" were set at 9.0 percent to match the percentage of expenditures in 2004.
|
|
|
What options are available to reduce the "funding gaps" cited in this chapter?
As previously noted, this report does not endorse any of the investment scenarios as the "correct" level of transportation investment. If one were to explore options for closing these "gaps", then the discussions in Chapter 6 describing current highway financing mechanisms could serve as useful background material. Note, however, that while that chapter focuses on Federal, State, and local government investment in highway infrastructure, it is important not to overlook the private sector. While the financial data currently available are much more thorough in capturing public sector highway spending than that of the private sector, the private sector is playing an increasing role in highway finance. Mechanisms such as public-private partnerships are intended to foster increasing private investment in the future. Chapter 13 discusses public-private partnerships and other innovative finance programs in more detail.
The discussion of congestion pricing in the Introduction to Part II of this report focused on the potential impacts that this type of tolling might have on the future investment scenario estimates, and thus on reducing the funding gap. An analysis of the theoretical impact that this could have in reducing the level of investment under the Cost to Maintain and Maximum Economic Investment scenarios is presented in Chapter 10. However, it is also important to note that congestion tolling could also provide a substantial stream of additional revenue, assuming such revenues were dedicated to be used for highway purposes, and that these user charges would be additive to those currently imposed (such as fuel taxes and motor-vehicle taxes and fees), rather than replacing them. Congestion pricing could thus present a "two-pronged" approach to reducing the spending gap.
Note that the "Cost to Improve Highways and Bridges" is presented in this report as a maximum level of investment above which it would not be cost-beneficial to invest, even if available funding were unlimited. As highway investment increases above current levels, the marginal returns for each additional dollar invested would be expected to decline. Closing this larger "gap" entirely would also be desirable only if all other potential cost-beneficial spending opportunities across other government functions were similarly exhausted.
|
Comparison with Previous Reports
Exhibit 8-4 compares the estimated differences between current spending and the average annual investment scenario estimates for this and the 1997, 1999, 2002, and 2004 C&P reports.
The percentage difference between current spending and the "Cost to Maintain Highways and Bridges" is somewhat higher than that in the 2004 report. As shown in Exhibit 8-4, the 2004 C&P report estimated that average annual investment under this scenario would be 8.3 percent above current spending. Estimates of the gap based on the 1997, 1999, and 2002 reports, however, were higher than the estimate in this edition.
|
|
|
Why has the gap between current spending and the investment scenario estimates increased since the 2004 report?
While highway capital outlays increased by 3.1 percent between 2002 and 2004, the estimated "Cost to Maintain Highways" presented in this report also increased, by nearly 7 percent. As discussed in Chapter 7, this increase is due primarily to revised estimates of the cost of construction in large urbanized areas. Projects in these areas are becoming more complex, involving more environmental mitigation and construction strategies (such as night work) intended to reduce the impacts of work zones on users. Urban highway construction costs in general also increased between 2002 and 2004, by 11.2 percent (rural construction costs declined by 3.5 percent over the same period). Finally, traffic congestion has continued to increase, thereby increasing the number and severity of highway capacity deficiencies.
|
Based on the information in the 1997 C&P report, the difference between the "Cost to Improve Highways and Bridges" would have been 108.9 percent. This difference was 92.9 percent in the 1999 C&P report and fell below 75 percent in the 2002 and 2004 reports. While it has risen in this report, it remains below the estimates from those earlier editions.
| Percent Above Current Spending | |||
|---|---|---|---|
| Report Year | Relevant Comparison | Cost to Maintain Highways & Bridges (Low Scenario*) | Cost to Improve Highways & Bridges (High Scenario*) |
| 1997 | Average annual investment scenario estimates for 1996–2015 compared with 1995 spending | 21.0% | 108.9% |
| 1999 | Average annual investment scenario estimates for 1998–2017 compared with 1997 spending | 16.3% | 92.9% |
| 2002 | Average annual investment scenario estimates for 2001–2020 compared with 2000 spending | 17.5% | 65.3% |
| 2004 | Average annual investment scenario estimates for 2003–2022 compared with 2002 spending | 8.3% | 74.3% |
| 2006 | Average annual investment scenario estimates for 2005–2024 compared with 2004 spending | 12.2% | 87.4% |
Transit Capital Spending Compared with Investment Scenario Estimates
This section compares the estimated average annual investment estimates for transit for the "Maintain" and "Improve" scenarios provided in Chapter 7 with actual 2004 capital spending on transit as discussed in Chapter 6. It is important to remember that the funding gaps between estimated investment under these scenarios and actual capital expenditures reflect passenger travel projections, the asset condition replacement thresholds chosen by the Transit Economic Requirements Model (TERM), and investment assumptions to improve performance by increasing passenger speed and reducing crowding as discussed in Chapter 7.
2004 Capital Spending and Estimated Average Annual Investment by Scenario
As indicated in Chapter 6, in 2004, total capital investment in transit by Federal, State, and local governments was $12.6 billion. The "Maintain" scenario estimate is $3.2 billion more annually or 25.4 percent above actual capital investment in 2004, and the "Improve" scenario estimate is $9.2 billion more annually or 73.0 percent above actual investment in 2004 [Exhibit 8-5]. These estimates are based on TERM. The gap between actual capital investment and the TERM estimate to maintain conditions and performance is similar to the 26.8 percent gap reported in the 2004 C&P report. Actual capital investment and the TERM estimate to maintain conditions and performance both are slightly higher than what was reported in 2004. However, the gap between actual capital investment and the TERM estimate to improve conditions and performance shrank considerably (from 95.1 percent in the 2004 C&P report) due to a decrease in the estimated amount needed to improve conditions and performance.
| (Billions of 2004 Dollars) | Average Annual Investments Minus Actual Expenditures in 2004 | Average Annual Investments Percent Above Actual Expenditures in 2004 | |
|---|---|---|---|
| Actual 2004 Capital Expenditures | $12.6 | ||
| Estimated Annual Average Investments 2005–2024 Costs to: |
|||
| Maintain Conditions & Performance | $15.8 | $3.2 | 25.4% |
| Improve Conditions & Maintain Performance | $16.4 | $3.8 | 30.2% |
| Maintain Conditions & Improve Performance | $21.2 | $8.6 | 68.3% |
| Improve Conditions & Performance | $21.8 | $9.2 | 73.0% |
Comparisons by Asset Type
In 2004, $3.4 billion was invested in transit vehicles and $9.2 billion was invested in nonvehicle transit infrastructure, facilities, guideway elements, stations, and systems, compared with $4.1 billion and $8.2 billion in 2002 [Exhibits 8-6 and 8-7]. The gap between actual vehicle capital investment and the TERM estimate to maintain and improve the conditions of vehicle assets has widened since the last report and the gap between actual nonvehicle asset investment and the TERM estimate to maintain and improve the conditions of nonvehicle assets has declined, in part, due to a decrease in the share of capital spending on vehicles from 31 percent in 2002 to 27 percent in 2004, and an increase in the share of capital spending on nonvehicles from 69 to 73 percent.
| Vehicles | Nonvehicle Assets | |||||
|---|---|---|---|---|---|---|
| Billions of 2004 Dollars | Percent Above Actual Spending | Percent of Total Capital Investment | Billions of 2004 Dollars | Percent Above Actual Spending | Percent of Total Capital Investment | |
| 2004 Capital Spending | $3.4 | 27% | $9.2 | 73% | ||
| Costs to | ||||||
| Maintain Conditions & Performance | $7.1 | 109% | 45% | $8.6 | -7% | 55% |
| Improve Conditions & Performance | $9.2 | 171% | 42% | $12.7 | 38% | 58% |
Vehicles
The average annual amount estimated by TERM to maintain the conditions and performance of the Nation's transit vehicle assets between 2005 and 2024 is $7.1 billion annually, 109 percent above the actual spending of $3.4 billion in 2004. The average annual amount estimated by TERM to improve the conditions and performance of the Nation's transit vehicle assets is $9.2 billion annually, 171 percent above the actual 2004. [Note that in the 2004 report, the comparable gaps were 68 percent for the "Maintain" scenario and 127 percent for the "Improve" scenario.]
To maintain conditions, the entire bus fleet will need to be replaced at least once during the period 2005 to 2024, in spite of a reduction in the number of bus vehicles exceeding FTA's minimum replacement age. A large proportion of the existing rail fleet will also need to be replaced between 2005 and 2024. In addition to rehabilitating and replacing existing bus and rail vehicles, the annual investment under the "Maintain" scenario includes investment for expansion to accommodate projected transit ridership growth and improve operating performance. To serve projected growth in bus passengers would require expanding the existing bus fleet by roughly 46,000 vehicles from 2005 to 2024, approximately 42 percent. The investment to improve service performance would expand the 2004 bus fleet by an additional 26,000 vehicles, or 24 percent. Similarly, expansion to serve projected growth in rail passengers would require close to 5,500 additional vehicles for the period 2005 to 2024, an increase of roughly 21 percent. To improve rail service would require about 3,000 additional vehicles, an increase of 12 percent. Many of the buses purchased to expand services will also require funds for rehabilitation and replacement, and many rail vehicles will require investment for rehabilitation before 2024. Each of these capital investment needs is included in the overall vehicle needs estimates.
Nonvehicle Infrastructure
The annual amount estimated by TERM under the Maintain Conditions and Performance scenario for the Nation's nonvehicle transit infrastructure is $8.6 billion annually, 7 percent below the actual expenditures of $9.2 billion in 2004. The annual amount estimated by TERM under the Improve Conditions and Performance scenario for nonvehicle assets is $12.7 billion, 38 percent above actual expenditures in 2004. [Note that in the 2004 report, $8.7 billion was estimated to maintain the conditions and performance of nonvehicle assets, 6 percent above an actual capital investment of $8.2 billion.] As discussed in Chapter 3, 8 percent of all rail maintenance facilities, 35 percent of stations, 26 percent of train control systems, 1 percent of traction power systems, 3 percent of revenue collection equipment, 8 percent of track, 16 percent of elevated structures, and 13 percent of underground tunnels are estimated to be in poor or substandard condition. Non-vehicle infrastructure also needs to be expanded under the "Maintain Performance" scenario to meet projected passenger travel and, under the "Improve Performance" scenario, to reduce crowding and speed in systems operating at levels below the national average.
Historical Comparisons
Capital Investment and Rehabilitation and Replacement Needs
As shown in Exhibit 8-8, current capital spending in urban areas in 2004 reached its highest level relative to the rehabilitation and replacement amounts estimated by TERM ($12.6 billion in spending compared with $10.4 billion estimated for rehabilitation and replacement), or by 21 percent. Since 1993, capital investment in transit assets has been almost equal to or slightly higher than the estimated rehabilitation and replacement levels estimated by the "Maintain Conditions" scenario. Actual rehabilitation and replacement expenditures are always lower than total capital investment because part of total capital investment in each year is for new system capacity. Based on FTA's budgetary history, about half of FTA's capital assistance has been for rehabilitation and replacement and about half for asset expansion. Investment in asset expansion contributes to higher average condition levels through the purchase of new assets.
| (Billions of Current Dollars) | ||
|---|---|---|
| Analysis Year | Current Capital Spending | Estimated Rehabilitation and Replacement Investment |
| 1993 | $5.7 | $5.1 |
| 1995 | $7.0 | $7.0 |
| 1997 | $7.6 | $7.0 |
| 2000 | $9.1 | $9.2 |
| 2002 | $12.3 | $10.3 |
| 2004 | $12.6 | $10.4 |
Capital Spending and TERM Investment Estimates
Exhibit 8-9 compares the percentage difference between current capital spending levels and the level of transit investment estimated by TERM in 2004 with the percentage differences between capital spending levels and the projected investment estimates from TERM provided in the 1995, 1997, 1999, 2002, and 2004 C&P reports. As a result of methodological improvements, the TERM projections are not directly comparable from year to year. The annual amount of investment estimated by TERM to maintain conditions and performance between 2005 and 2024 is 25 percent higher than actual capital expenditures in 2004. In the 2004 report, the amount of annual investment estimated by TERM to maintain conditions and performance between 2003 and 2022 was 27 percent higher than actual capital expenditures in 2002. In earlier editions of the report, the annual investment estimates calculated by TERM ranged from 38 to 64 percent more than actual spending. A detailed account of the changes in investment estimates is provided in Chapter 7.
| Percent Above Current Spending | ||||
|---|---|---|---|---|
| Report Year | Spending Year | Investment Forecast Years | Cost to Maintain Conditions and Performance | Cost to Improve Conditions and Performance |
| 1995 | 1993 | 1994–2013 | 37.6% | 124.4% |
| 1997 | 1995 | 1996–2015 | 38.3% | 102.9% |
| 1999 | 1997 | 1998–2017 | 41.0% | 110.2% |
| 2002 | 2000 | 2001–2020 | 63.8% | 127.7% |
| 2004 | 2002 | 2003–2022 | 26.8% | 95.1% |
| 2006 | 2004 | 2005–2024 | 25.4% | 73.0% |