

- NHS Bridge Performance Projections
- Introduction
- Performance Measures
- Sufficiency Rating
- Health Index
- Condition Ratings
- Comparison Standards
- Age of NHS Bridges
- Management Strategy Definitions
- Funding Approach Definitions
- Sufficiency Rating 50 Management Strategy
- Maintain Current Funding (CF) Alternative
- Maximum Flat Funding Alternative
- Maximum Ramped Funding Alternative
- Health Index 75 Management Strategy
- Maximum Flat Funding Alternative
- Maximum Ramped Funding Alternative
- Health Index 80 Management Strategy
- Maximum Flat Funding Alternative
- Maximum Ramped Funding Alternative
- Health Index 85 Management Strategy
- Maximum Flat Funding Alternative
- Maximum Ramped Funding Alternative
- Age Equals 50 Management Strategy
- Maximum Flat Funding Alternative
- Maximum Ramped Funding Alternative
- Unconstrained Funding Alternative
- No Special Rules Management Strategy
- Unconstrained Funding Alternative
- Conclusion
NHS Bridge Performance Projections
Introduction
Chapter 2 of this report presented the characteristics of the bridge network on the National Highway System (NHS). The network consisted of 115,203 bridges, represented approximately 19.4 percent of the total bridges on the Nation's roadway system, comprised approximately 49.5 percent of the Nation's total bridge deck area, and carried 71.1 percent of the total travel on bridges in the Nation.
The second section of Chapter 3, "Bridge System Conditions," presents the performance of the NHS bridge network. The level of performance was reported based on the primary performance measure adopted by the Federal Highway Administration (FHWA)—the percent of deck area on structurally deficient and functionally obsolete bridges compared with the total deck area of bridges on the NHS network. For 2006, the percent of deck area on structurally deficient bridges on the NHS was 8.4 percent and the percent of deck area on functionally obsolete bridges on the NHS was 20.8 percent.
Additional performance measures for NHS bridges were provided in Chapter 3. The shares of average daily traffic (ADT) carried on structurally deficient and on functionally obsolete NHS bridges were 6.6 percent and 20.1 percent, respectively, in 2006. The shares of structurally deficient and functionally obsolete NHS bridges in 2006 were 5.5 percent and 16.8 percent, respectively.
All bridges are a vital link in the Nation's transportation system, and the NHS bridge network has an extremely important role in the system based on the volume of public and commercial traffic it carries. The continued ability of these bridges to carry the Nation's traffic is critical to maintaining the economic health of the Nation and to providing access to services by the public.
This chapter will evaluate the effect of several alternative potential management strategies in a study of the projected health of the Nation's bridge system over the next 50 years, based on select performance metrics and criteria. These strategies are intended to be illustrative. Other strategies based on different targets could be used and be equally valid from a technical perspective. All costs are provided in constant 2006 dollars. Estimated costs provided do not reflect the effects of inflation and any future increases in construction costs.
Performance Measures
In this study of NHS bridges, five metrics were used: the average sufficiency rating; the average health index; and the percentage of NHS bridges with condition ratings of 5 ("fair") or greater for deck, superstructure, and substructure. Metrics were used as part of the overall management strategy scenarios calculated using the National Bridge Investment Analysis System (NBIAS) model to project future performance of structures by measuring the health of bridges. A more detailed explanation of the capabilities of NBIAS is presented in Appendix B.
Sufficiency Rating
The sufficiency rating of an individual bridge on a scale of 0 to 100 is based on the structural adequacy and safety, essentiality for public use, and serviceability and functional obsolescence of the bridge. The sufficiency rating considers multiple aspects of a structure and its level of performance and is the basis for establishing eligibility and initial priority for replacement and rehabilitation of bridges under the Highway Bridge Replacement and Rehabilitation Program. In general, a low sufficiency rating for a structure will place that structure at a higher priority.
For this study, the sufficiency ratings of bridges on the NHS were combined and averaged to determine the overall status of all bridges on the NHS. The initial Average Sufficiency Rating of NHS bridges in 2006 was 82.8.
Health Index
The health index is a measure of the structural integrity of an element of the bridge. Each element is evaluated individually; these values are then compiled to arrive at a total bridge score. The health index ranges from a high of 100 to a low of 0; the lower the health index number, the higher the priority for rehabilitation or maintenance of the structure.
For this study, the average health index provides a composite for the structural integrity of bridges on the NHS. The Average Health Index of NHS bridges in 2006 was 91.1.
Condition Ratings
Condition ratings are used to describe the existing, in-place status of a component. Bridge inspectors assign condition ratings by evaluating the severity of the deterioration or disrepair and the extent to which it affects the component being rated. These ratings provide an overall characterization of the general condition of the entire component being rated and not an indication of localized conditions. Ratings of 5 or greater indicate a situation where maintenance work and minor rehabilitation of the general component can return a bridge to a high performance level. It is highly desirable to implement actions before the general component reaches a rating of 4 or lower. Exhibit 11-1 describes the bridge condition ratings in more detail.
| Rating | Condition Category | Description |
|---|---|---|
| 9 | Excellent | |
| 8 | Very Good | No problems noted. |
| 7 | Good | Some minor problems. |
| 6 | Satisfactory | Structural elements show some minor deterioration. |
| 5 | Fair | All primary structural elements are sound but may have minor section loss, cracking, spalling, or scour. |
| 4 | Poor | Advanced section loss, deterioration, spalling, or scour. |
| 3 | Serious | Loss of section, deterioration, spalling, or scour have seriously affected primary structural components. Local failures are possible. Fatigue cracks in steel or shear cracks in concrete may be present. |
| 2 | Critical | Advanced deterioration of primary structural elements. Fatigue cracks in steel or shear cracks in concrete may be present or scour may have removed substructure support. Unless closely monitored, it may be necessary to close the bridge until corrective action is taken. |
| 1 | Imminent Failure | Major deterioration or section loss present in critical structural components, or obvious loss present in critical structural components, or obvious vertical or horizontal movement affecting structural stability. Bridge is closed to traffic, but corrective action may put bridge back in light service. |
| 0 | Failed | Out of service; beyond corrective action. |
This chapter uses the percent of bridges in each area—deck, superstructure, and substructure—with ratings of 5 or greater as a measure of the aggregate condition of the components of that category. In 2006 the percentage of NHS bridges with Deck Ratings of 5 or greater was 95.0; with Superstructure Ratings of 5 or greater it was 97.9; and with Substructure Ratings of 5 or greater it was 98.1.
Comparison Standards
In general, when comparing the performance of management and funding alternatives, those alternatives with higher values for the chosen metrics at the end of the period of analysis are more desirable. However, the values of the metrics during the analysis period must also be considered. It is possible for an alternative to yield acceptable metrics at the conclusion of the analysis period but some or all of the metrics may fall below the level of acceptability at various points during the analysis period. Therefore not only should the final results of an alternative be evaluated but also the performance during the analysis period.
Funding schedules are also considered as part of the evaluation of alternatives. It is possible for a selected strategy to be highly desirable but the required funding levels are not realistic. Also, there are other practical items to be considered. If an alternative requires a large amount of work to be undertaken in a short period of time, are there sufficient qualified contractors available? Are sufficient amounts of needed construction materials available? What will be the impact on the ability of the NHS to support the transportation of goods and the public?
Age of NHS Bridges
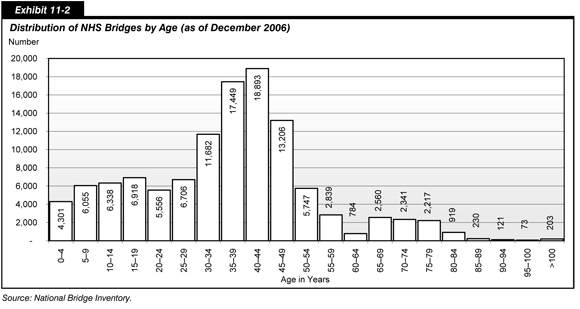
Exhibit 11-2 shows the distribution of NHS bridges by age. Approximately 61,230 NHS structures are 30 years but less than 50 years old. This constitutes 53.1 percent of the total NHS bridge network.
The pace of construction of new bridges has not been uniform over time. Many existing bridges were constructed in a relatively short time frame, around the time the Interstate System was constructed. Concern has been expressed that the bridges in that age range will reach their service life limit in the near future based on estimates of a 50-year design life of a bridge structure.
The assumption of a maximum design life of 50 years may not apply in situations where a structure has been kept in good repair through timely maintenance and rehabilitation, thus potentially extending the service life of that bridge. However, estimates of the total service life of a bridge and the remaining service life for that structure are a valid concern. Other factors can affect the service life of a bridge such as less than aggressive maintenance over its full lifetime or loading in excess of its anticipated, as-built limit. These factors will tend to make a structure deteriorate more quickly or need more extensive rehabilitation than a new bridge in similar condition.
Of the remaining NHS bridges, approximately 35,874 structures, 31.1 percent, are less than 30 years old and the remaining 18,034 structures, 15.7 percent, are 50 years of age or older. The year of construction was not available for 65 NHS bridges.
Management Strategy Definitions
The management strategies below each reflect a philosophy that provides theoretical bridge replacement time frames, relating to issues such as bridge age or other factors.
The No Special Rules strategy applies the default NBIAS criteria in which bridge actions are only implemented when their estimated benefit-cost ratio is 1.0 or higher, to the extent possible based on the funding alternative being considered.
An SR 50 strategy assumes structures that reach a sufficiency rating of 50 or less are selected for replacement in addition to any actions, in order of benefit-cost ratio, selected for work on bridges that have a minimum 1.0 benefit-cost ratio, to the extent possible based on the funding alternative being considered. The 20-year analyses of bridge needs presented in Chapter 7 applied this strategy.
An Age 50 strategy assumes any structure that becomes 50 years in age or older during the analysis period will be replaced in addition to any actions, in order of benefit-cost ratio, selected for work on bridges that have a minimum 1.0 benefit-cost ratio, to the extent possible based on the funding alternative being considered.
The 75 Health Index strategy assumes any structure with a health index equal to or less than 75 during the analysis period will be replaced in addition to any actions, in order of benefit-cost ratio, selected for work on bridges that have a minimum 1.0 benefit-cost ratio, to the extent possible based on the funding alternative being considered.
The 80 Health Index strategy assumes any structure with a health index equal to or less than 80 during the analysis period will be replaced in addition to any actions, in order of benefit-cost ratio, selected for work on bridges that have a minimum 1.0 benefit-cost ratio, to the extent possible based on the funding alternative being considered.
The 85 Health Index strategy assumes any structure with a health index equal to or less than 85 during the analysis period will be replaced in addition to any actions, in order of benefit-cost ratio, selected for work on bridges that have a minimum 1.0 benefit-cost ratio, to the extent possible based on the funding alternative being considered.
Funding Approach Definitions
The Current Funding (CF) Alternative assumes the expenditure of funds will be sustained in constant dollar terms at the 2006 level of $4.3 billion per year for the duration of the analysis period of 2006 through 2056.
The Maximum Ramped Funding (MRF) Alternative assumes an increase in spending at a fixed annual rate above the base year 2006 level for the 50-year period ending in 2056. For each management strategy to which this alternative is applied, the rate of increase is determined as the maximum rate for which NBIAS can identify a sufficient number of potential projects meeting the specified criteria for that strategy in each individual year to allow the funding available in each year to be fully expended. This funding approach is consistent with the 20-year analyses of bridge needs presented in Chapter 7 in this report.
The Maximum Flat Funding (MFF) Alternative assumes an immediate increase in spending to a higher level that would be maintained in constant dollar terms for the entire 50-year period from 2006 to 2056. For each management strategy to which this alternative is applied, this investment level is determined as the maximum level for which NBIAS can identify a sufficient number of potential projects meeting the specified criteria for that strategy in each individual year to allow the funding available in each year to be fully expended. This funding approach is consistent with the flat spending alternative for 20-year analyses of bridge needs described in the "Alternative Timing of Investment in NBIAS" section of Chapter 9 in this report.
The Unconstrained Funding (UF) Alternative assumes that spending in each year will be based solely on the criteria of the management strategy being analyzed. This funding approach is consistent with the BCR-driven alternative for 20-year analyses of bridge needs described in the "Alternative Timing of Investment in NBIAS" section of Chapter 9 in this report. As discussed in that section, such an approach would tend to front-load spending in the first year of the analysis to address the existing backlog of bridge deficiencies.
The current funding, ramped funding, flat funding, and unconstrained spending alternatives have been applied to various bridge management philosophies to show the budget implications for the various management strategies presented.
Sufficiency Rating 50 Management Strategy
In addition to any other actions to be taken as indicated by NBIAS for bridges on the NHS, any NHS bridge having or reaching a sufficiency rating of 50 or less will be replaced following this strategy.
Maintain Current Funding (CF) Alternative
This alternative to address the needs of the NHS bridge network maintains the current level of funding with the SR 50 management strategy. This results in spending $4.3 billion per year (2006 funding), expending $215.0 billion over a 50-year analysis period of 2006 to 2056. Applying the SR 50 management strategy, all metrics declined by the end of the 50-year analysis period, as shown in Exhibit 11-3. In particular, the share of bridges with substructure ratings of 5 or greater was projected to decline from 98.1 percent to 48.9 percent by 2056, a drop of more than 49 points. The average sufficiency rating would decrease from 82.8 to 67.1 and the average health index would drop from 92.0 to 66.8 over the same period. The funds expended totaled $215.0 billion.
| Metric | Year 2006 |
Year 2016 |
Year 2026 |
Year 2036 |
Year 2046 |
Year 2056 |
|---|---|---|---|---|---|---|
| Sufficiency Rating | 82.8 | 75.9 | 69.2 | 68.6 | 67.7 | 67.1 |
| Health Index | 92.0 | 81.6 | 75.2 | 70.7 | 68.2 | 66.8 |
| Percentage of Bridges With Deck Ratings of 5 or Greater | 95.4% | 95.8% | 93.2% | 88.5% | 85.3% | 84.5% |
| Percentage of Bridges With Superstructure Ratings of 5 or Greater | 97.9% | 95.3% | 87.6% | 88.5% | 78.3% | 84.5% |
| Percentage of Bridges With Substructure Ratings of 5 or Greater | 98.1% | 87.1% | 51.4% | 50.1% | 51.0% | 48.9% |
Maximum Flat Funding Alternative
The maximum annual level of funding based on the parameters of this approach was $7.5 billion per year, totaling $375.0 billion (2006 dollars) in 50 years.
Trends for the five metrics are shown in Exhibit 11-4. Four of the five metrics declined over the analysis period; however, all metrics remained at or above the acceptable criteria for the duration of the 50-year analysis period except the share of structures with substructure ratings of 5 or greater, which is projected to be 73.7 percent in 2026.
| Metric | Year 2006 |
Year 2016 |
Year 2026 |
Year 2036 |
Year 2046 |
Year 2056 |
|---|---|---|---|---|---|---|
| Sufficiency Rating | 82.8 | 80.0 | 76.5 | 77.3 | 77.6 | 76.8 |
| Health Index | 92.0 | 85.2 | 81.4 | 79.5 | 79.4 | 78.9 |
| Percentage of Bridges With Deck Ratings of 5 or Greater | 95.4% | 97.9% | 98.1% | 98.3% | 97.6% | 98.2% |
| Percentage of Bridges With Superstructure Ratings of 5 or Greater | 97.9% | 97.2% | 94.9% | 94.2% | 95.1% | 92.9% |
| Percentage of Bridges With Substructure Ratings of 5 or Greater | 98.1% | 95.0% | 73.7% | 77.1% | 77.8% | 75.7% |
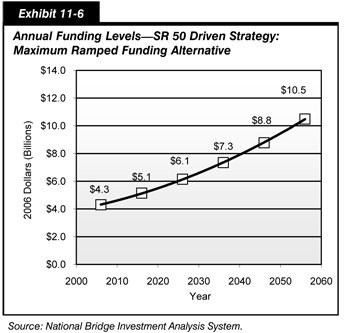
Maximum Ramped Funding Alternative
Exhibit 11-5 shows the trends for the five metrics using the SR 50 strategy with ramped spending for the 50-year analysis period. In 2026 and 2036, the shares of structures with substructure ratings of 5 or greater declined to 57.1 percent and 61.6 percent, respectively. The sufficiency rating is projected to be 71.4 in 2026 and 73.0 in 2036. The projected health index declines to 75.7 in 2036. The share of bridges with deck ratings of 5 or greater increased from 95.4 percent in 2006 to 98.4 percent in 2056.
| Metric | Year 2006 |
Year 2016 |
Year 2026 |
Year 2036 |
Year 2046 |
Year 2056 |
|---|---|---|---|---|---|---|
| Sufficiency Rating | 82.8 | 76.5 | 71.4 | 73.0 | 75.4 | 78.3 |
| Health Index | 92.0 | 82.2 | 77.3 | 75.7 | 77.3 | 80.3 |
| Percentage of Bridges With Deck Ratings of 5 or Greater | 95.4% | 96.1% | 94.8% | 92.3% | 94.3% | 98.4% |
| Percentage of Bridges With Superstructure Ratings of 5 or Greater | 97.9% | 95.7% | 89.6% | 86.4% | 88.9% | 94.2% |
| Percentage of Bridges With Substructure Ratings of 5 or Greater | 98.1% | 88.1% | 57.1% | 61.6% | 67.8% | 77.3% |
The maximum percent increase under this approach was 1.8 percent compounded per year. The funding level at which all available funds per year would be allocated was $350.2 billion (2006 dollars) over the 50-year period. Exhibit 11-6 shows that early funding ranged from approximately $4.4 billion in 2007 to approximately $10.5 billion by 2056.
Health Index 75 Management Strategy
In addition to any other actions to be taken as indicated by NBIAS for bridges on the NHS, any NHS bridge having or reaching a Health Index of 75 or less will be replaced following this strategy.
Maximum Flat Funding Alternative
The maximum flat funding level based on the parameters of the HI 75 management strategy was $11.0 billion per year, totaling $550.0 billion (2006 dollars) in 50 years.
Exhibit 11-7 shows that, at the end of the 50-year analysis period, the share of bridges with deck ratings of 5 or greater increased from 95.4 percent to 98.7 percent. The share of bridges with superstructure ratings of 5 or greater remained almost constant, declining only 0.2 percent. The average sufficiency rating decreased by 3.6 from 82.8 to 79.2. The share of bridges with substructure ratings of 5 or greater dropped from 98.1 percent to 89.1, and the average health index declined by 9.3 points to 82.7 from 92.0.
| Metric | Year 2006 |
Year 2016 |
Year 2026 |
Year 2036 |
Year 2046 |
Year 2056 |
|---|---|---|---|---|---|---|
| Sufficiency Rating | 82.8 | 82.2 | 81.6 | 80.8 | 80.3 | 79.2 |
| Health Index | 92.0 | 87.4 | 85.3 | 84.0 | 83.2 | 82.7 |
| Percentage of Bridges With Deck Ratings of 5 or Greater | 95.4% | 98.4% | 98.6% | 98.7% | 98.7% | 98.7% |
| Percentage of Bridges With Superstructure Ratings of 5 or Greater | 97.9% | 98.0% | 98.2% | 98.0% | 97.8% | 97.7% |
| Percentage of Bridges With Substructure Ratings of 5 or Greater | 98.1% | 97.7% | 92.4% | 92.9% | 92.3% | 89.1% |
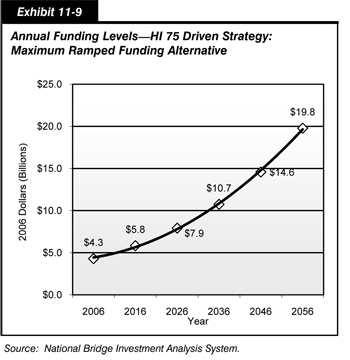
Maximum Ramped Funding Alternative
Exhibit 11-8 shows the trends for the five metrics using the HI 75 strategy and Maximum Ramped Funding alternative for the 50-year analysis period. The share of structures with deck ratings of 5 or greater and superstructure ratings of 5 or greater remained above 90 percent throughout the analysis period and showed increases to 98.7 percent and 98.4 percent, respectively, in 2056. The share of structures with substructure ratings of 5 or greater declined to 57.7 percent in 2026, increased to only 64.1 percent in 2036, continued to increase to 79.5 percent in 2046, and ended at 96.1 percent in 2056. The average sufficiency rating declined to 76.1 in 2026 and the health index declined to 77.7 in 2036. These values increased in 2056 to 83.8 and 87.5, respectively.
| Metric | Year 2006 |
Year 2016 |
Year 2026 |
Year 2036 |
Year 2046 |
Year 2056 |
|---|---|---|---|---|---|---|
| Sufficiency Rating | 82.8 | 76.1 | 76.1 | 73.9 | 78.1 | 83.8 |
| Health Index | 92.0 | 82.0 | 77.7 | 77.7 | 81.8 | 87.5 |
| Percentage of Bridges With Deck Ratings of 5 or Greater | 95.4% | 96.2% | 96.3% | 96.5% | 98.1% | 98.7% |
| Percentage of Bridges With Superstructure Ratings of 5 or Greater | 97.9% | 95.6% | 91.6% | 90.3% | 94.7% | 98.4% |
| Percentage of Bridges With Substructure Ratings of 5 or Greater | 98.1% | 87.4% | 57.7% | 64.1% | 79.5% | 96.1% |
To provide funding to replace bridges with a health index of 75 each year, for the duration of the 50-year analysis period, the maximum percent increase under this approach was 3.1 percent compounded per year. The funding level at which all available funds per year would be allocated was $515.1 billion (2006 dollars) over the 50-year period. Exhibit 11-9 shows that yearly funding ranged from approximately $4.4 billion in 2007 to a maximum of slightly less than $19.8 billion in 2056.
Health Index 80 Management Strategy
In addition to any other actions to be taken as indicated by NBIAS for bridges on the NHS, any NHS bridge having or reaching a Health Index of 80 or less will be replaced following this strategy.
Maximum Flat Funding Alternative
The maximum annual level of funding based on the parameters HI 80 management strategy was $14.4 billion per year, totaling $720.0 billion (2006 dollars) in 50 years.
Exhibit 11-10 shows that the average health index is projected to decline steadily from 92.0 in 2006 to 84.2 in 2056. The average sufficiency rating increased slightly during the first 10 years of the analysis period but decreased from 82.8 in 2006 to 80.4 in 2056. The shares of bridges with superstructure and substructure ratings of 5 or greater also showed slight increases during the first 10 years but declined from 97.9 percent and 98.1 percent, respectively, in 2006 to 96.6 percent and 88.0 percent, respectively, in 2056. The share of structures with deck ratings of 5 or greater increased from 95.4 percent in 2006 to 98.6 percent in 2056.
| Metric | Year 2006 |
Year 2016 |
Year 2026 |
Year 2036 |
Year 2046 |
Year 2056 |
|---|---|---|---|---|---|---|
| Sufficiency Rating | 82.8 | 84.4 | 82.5 | 82.0 | 81.2 | 80.4 |
| Health Index | 92.0 | 89.4 | 89.4 | 85.4 | 84.7 | 84.2 |
| Percentage of Bridges With Deck Ratings of 5 or Greater | 95.4% | 98.6% | 98.7% | 98.7% | 98.6% | 98.6% |
| Percentage of Bridges With Superstructure Ratings of 5 or Greater | 97.9% | 98.4% | 98.2% | 97.5% | 96.7% | 96.6% |
| Percentage of Bridges With Substructure Ratings of 5 or Greater | 98.1% | 99.1% | 93.2% | 93.0% | 89.1% | 88.0% |
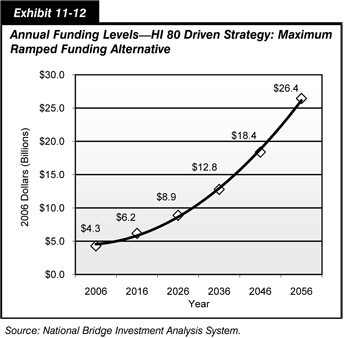
Maximum Ramped Funding Alternative
Exhibit 11-11 shows the trends for the five metrics using the HI 80 management strategy with ramped spending for the 50-year analysis period. The share of structures with deck and superstructure ratings of 5 or greater are projected to reach 98.7 percent and 98.3 percent, respectively, by 2056. The share of structures with substructure ratings of 5 or greater is shown to decline to 48.5 percent in 2026 and increase to only 58.8 percent in 2036. This share improves to 76.3 percent in 2046 and ends at 98.0 percent in 2056. The average sufficiency rating is predicted to be 75.9 in 2026 and 72.9 in 2036. The average health index is shown to decrease to a low of 76.7 in 2036. The values for the average sufficiency rating and the average health index in 2056 are 85.8 and 90.1, respectively.
| Metric | Year 2006 |
Year 2016 |
Year 2026 |
Year 2036 |
Year 2046 |
Year 2056 |
|---|---|---|---|---|---|---|
| Sufficiency Rating | 82.8 | 75.9 | 75.9 | 72.9 | 78.7 | 85.8 |
| Health Index | 92.0 | 81.8 | 76.9 | 76.7 | 82.8 | 90.1 |
| Percentage of Bridges With Deck Ratings of 5 or Greater | 95.4% | 96.1% | 95.4% | 93.8% | 98.1% | 98.7% |
| Percentage of Bridges With Superstructure Ratings of 5 or Greater | 97.9% | 95.4% | 88.9% | 87.7% | 93.7% | 98.3% |
| Percentage of Bridges With Substructure Ratings of 5 or Greater | 98.1% | 86.3% | 48.5% | 58.8% | 76.3% | 98.0% |
The maximum percent increase under this approach was 3.7 percent compounded per year. The funding level at which all available funds per year would be allocated was $620.8 billion (2006 dollars) over the 50-year period. Exhibit 11-12 shows that yearly funding ranged from approximately $4.4 billion in 2007 to a maximum of slightly more than $26.4 billion in 2056.
Health Index 85 Management Strategy
In addition to any other actions to be taken as indicated by NBIAS for bridges on the NHS, any NHS bridge having or reaching a Health Index of 85 or less will be replaced following this strategy.
Maximum Flat Funding Alternative
The maximum annual level of funding based on the parameters of the HI 85 management strategy was $18.5 billion per year, totaling $925.0 billion (2006 dollars) in 50 years.
Exhibit 11-13 shows that the average health index is projected to decline steadily from 92.0 in 2006 to 85.5 in 2056. The average sufficiency rating increased slightly during the first 10 years of the analysis period to 85.2 in 2016 and 2026 but decreased to 80.9 in 2056. The share of bridges with superstructure and substructure ratings of 5 or greater also showed slight increases during the first 10 years but declined from 97.9 percent and 98.1 percent, respectively, in 2006 to 95.0 percent and 83.8 percent, respectively, in 2056. The share of structures with deck ratings of 5 or greater increased from 95.4 percent in 2006 to 98.6 percent in 2056.
| Metric | Year 2006 |
Year 2016 |
Year 2026 |
Year 2036 |
Year 2046 |
Year 2056 |
|---|---|---|---|---|---|---|
| Sufficiency Rating | 82.8 | 85.2 | 85.2 | 81.5 | 81.3 | 80.9 |
| Health Index | 92.0 | 90.5 | 87.6 | 86.2 | 85.9 | 85.5 |
| Percentage of Bridges With Deck Ratings of 5 or Greater | 95.4% | 98.6% | 98.6% | 98.6% | 98.6% | 98.6% |
| Percentage of Bridges With Superstructure Ratings of 5 or Greater | 97.9% | 98.3% | 97.3% | 96.2% | 95.4% | 95.0% |
| Percentage of Bridges With Substructure Ratings of 5 or Greater | 98.1% | 99.0% | 93.4% | 86.8% | 85.1% | 83.8% |
Maximum Ramped Funding Alternative
Exhibit 11-14 shows the trends for the five metrics using the HI 85 management strategy combined with the MRF alternative over the 50-year analysis period. The share of structures with substructure ratings of 5 or greater varied greatly through the analysis period from 42.5 percent in 2026, to 51.0 percent in 2036, and to 72.2 percent in 2046. The average health index also exhibited variability, though not to the same extent, dropping from 92.0 in 2006 to 75.6 in 2026 and 2036 before increasing to 91.6 in 2036. The sufficiency rating declined from 82.8 in 2006 to 71.2 in 2036 and then rose to 86.6 in 2056. The deck and superstructure metrics remained at relatively high levels during the 50-year analysis period.
| Metric | Year 2006 |
Year 2016 |
Year 2026 |
Year 2036 |
Year 2046 |
Year 2056 |
|---|---|---|---|---|---|---|
| Sufficiency Rating | 82.8 | 74.6 | 74.6 | 71.2 | 78.3 | 86.6 |
| Health Index | 92.0 | 81.1 | 75.6 | 75.2 | 83.2 | 91.6 |
| Percent Bridges With Deck Ratings of 5 or Greater | 95.4% | 96.0% | 94.1% | 91.5% | 97.8% | 98.7% |
| Percent Bridges With Superstructure Ratings of 5 or Greater | 97.9% | 94.3% | 87.0% | 83.1% | 92.6% | 98.1% |
| Percent Bridges With Substructure Ratings of 5 or Greater | 98.1% | 81.6% | 42.5% | 51.0% | 72.2% | 97.8% |
The maximum percent increase under this approach was 4.1 percent compounded per year. The funding level at which all available funds per year would be allocated was $704.9 billion (2006 dollars) over the 50-year period. Exhibit 11-15 shows that yearly funding ranged from approximately $4.5 billion in 2007 to a maximum of slightly less than $32.1 billion in 2056.

Age Equals 50 Management Strategy
The effect of the age of structures on the Nation's highways has been an issue of concern. With the surge in construction starting in the late 1950s and continuing through the 1970s, approximately 68.8 percent of NHS bridges were 30 years old or older in 2006. Also in 2006 the average age of bridges on the NHS was approximately 44 years. The useful life of many of these bridges is perceived to be around 50 years. Because of this perception, concerns have been expressed by the public and by members of the engineering community that many of the Nation's bridges may be reaching the end of their useful service life.
This management strategy analyses the effect on budget needs and the performance of the NHS bridge network if structures are selected for replacement when they reach 50 years of age. In addition to any other actions to be taken as indicated by NBIAS for bridges on the NHS, any NHS bridge having or reaching an age of 50 years will be replaced following this strategy.
Maximum Flat Funding Alternative
The maximum annual level of funding based on the parameters of the Age 50 management strategy was $11.3 billion per year, totaling $565.0 billion (2006 dollars) in 50 years.
Exhibit 11-16 shows the projected health index declined steadily from 92.0 in 2006 to 73.7 in 2056. The sufficiency rating also decreased steadily from 85.8 in 2006 to 74.1 in 2036 and 70.2 in 2056. The shares of structures with deck and superstructure ratings of 5 or greater declined to 93.8 percent and 82.4 percent, respectively, in 2056. The share of bridges with substructure ratings of 5 or greater is projected to decline significantly to 46.9 percent in 2056.
| Metric | Year 2006 |
Year 2016 |
Year 2026 |
Year 2036 |
Year 2046 |
Year 2056 |
|---|---|---|---|---|---|---|
| Sufficiency Rating | 82.8 | 82.5 | 82.5 | 74.1 | 71.8 | 70.2 |
| Health Index | 92.0 | 87.3 | 82.5 | 79.1 | 76.1 | 73.7 |
| Percentage of Bridges With Deck Ratings of 5 or Greater | 95.4% | 98.5% | 98.5% | 97.6% | 95.8% | 93.8% |
| Percentage of Bridges With Superstructure Ratings of 5 or Greater | 97.9% | 98.2% | 94.6% | 90.3% | 86.9% | 82.4% |
| Percentage of Bridges With Substructure Ratings of 5 or Greater | 98.1% | 98.1% | 78.7% | 64.7% | 53.2% | 46.9% |
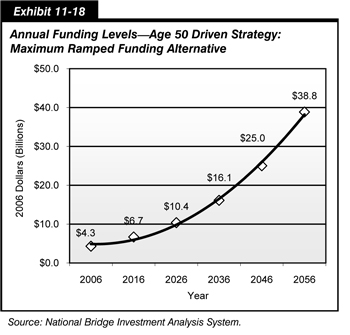
Maximum Ramped Funding Alternative
Exhibit 11-17 shows the trends for the five metrics using the Age 50 management strategy with MRF alternative spending. The share of structures with substructure ratings of 5 or greater is projected to drop to 59.7 percent in 2026 and 66.4 percent in 2036 before rising to 80.2 percent in 2046 and to 94.5 percent in 2056. The average sufficiency rating is projected to reach a low of 77.2 in 2016 and 2026 and then increase for the remainder of the analysis period and finish at 83.8 in 2056. The health index is projected to decline from 92.0 in 2006 to 78.7 by 2026 and then increase to 90.5 by 2056.
| Metric | Year 2006 |
Year 2016 |
Year 2026 |
Year 2036 |
Year 2046 |
Year 2056 |
|---|---|---|---|---|---|---|
| Sufficiency Rating | 82.8 | 77.2 | 77.2 | 74.8 | 79.1 | 83.8 |
| Health Index | 92.0 | 82.9 | 78.7 | 79.3 | 84.3 | 90.5 |
| Percent Bridges With Deck Ratings of 5 or Greater | 95.4% | 97.2% | 96.5% | 95.5% | 97.4% | 98.7% |
| Percent Bridges With Superstructure Ratings of 5 or Greater | 97.9% | 95.5% | 90.0% | 88.9% | 93.6% | 96.8% |
| Percent Bridges With Substructure Ratings of 5 or Greater | 98.1% | 90.5% | 59.7% | 66.4% | 80.2% | 94.5% |
The maximum percent increase in funding under the MRF alternative was 4.5 percent compounded per year. The funding level at which all available funds per year would be allocated was $802.1 billion (2006 dollars) over the 50-year period. Exhibit 11-18 shows that yearly funding ranged from approximately $4.5 billion in 2007 to a maximum slightly greater than $38.8 billion in 2056.
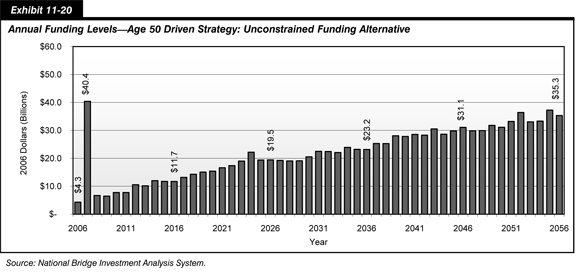
Unconstrained Funding Alternative
This alternative combines the unconstrained funding alternative and the Age 50 management strategy. No limits were placed on annual budgets; therefore, work was selected based on the most economically beneficial time to schedule it. This alternative results in very high expenditures during the initial years. The budget required for 2007, the first year, is approximately $40.4 billion (2006 dollars). The total funds projected for the analysis period is $1.13 trillion (2006 dollars).
Exhibits 11-19 and 11-20 show the metric and financial trends for this alternative. All metrics are projected to remain at high performance levels during the analysis period. The share of structures with substructure ratings of 5 or greater will fall from 98.1 percent in 2006 to 92.2 percent by 2056. The average sufficiency rating remains fairly stable, ending at 82.8 in 2056. The average health index decreases moderately from 92.0 in 2006 to 89.6 by 2056.
| Metric | Year 2006 |
Year 2016 |
Year 2026 |
Year 2036 |
Year 2046 |
Year 2056 |
|---|---|---|---|---|---|---|
| Sufficiency Rating | 82.8 | 82.4 | 82.4 | 80.6 | 82.0 | 82.8 |
| Health Index | 92.0 | 87.2 | 85.6 | 85.8 | 87.8 | 89.6 |
| Percentage of Bridges With Deck Ratings of 5 or Greater | 95.4% | 98.5% | 98.6% | 98.7% | 98.7% | 98.7% |
| Percentage of Bridges With Superstructure Ratings of 5 or Greater | 97.9% | 98.2% | 97.1% | 96.8% | 96.8% | 96.8% |
| Percentage of Bridges With Substructure Ratings of 5 or Greater | 98.1% | 98.0% | 88.2% | 88.8% | 91.0% | 92.2% |
Under this scenario, a large surge of work is projected in the initial years. The results should provide a high-performance bridge system on the NHS. However, it is highly unlikely that certain requirements necessary for this surge are available.
The initial funding required in 2007 of $40.4 billion is 9.4 times the amount now being allocated to the NHS bridge network for all work. Approximately 28.7 percent of the bridges on the NHS would be affected for an average of 2 to 5 years. Bridge use would be severely restricted during this time, thereby affecting the flow of freight transport and the traveling public at a national level. The average time that bridge use would be severely restricted, thereby affecting the flow of freight transport and the traveling public at a national level, would be between 2 and 5 years. The lack of qualified contractors, materials, and State support applies here as in the previous alternative. It would continue the spike effect discussed in the previous alternative.
It is also unlikely that a sufficient number of qualified contractors would be available to undertake such a large volume of work in the time frame suggested by this alternative. The vast qualities of materials needed to complete the required work also would not be available to allow completion in the suggested time frame. State agencies would be unable to support the projected work because of lack of available plans, matching funds, and staff. Such a surge in construction would continue to perpetuate project spikes at periodic intervals, creating the same problem at some future date—minimal amounts of work for a long time and then a large spike in demand for replacement
No Special Rules Management Strategy
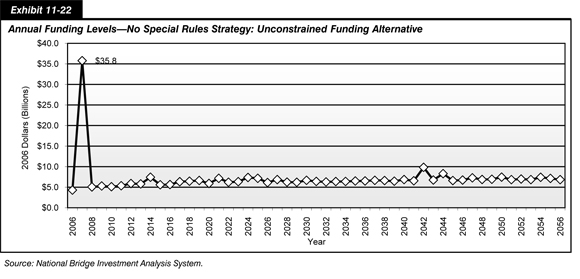
Unconstrained Funding Alternative
This approach assumes that annual capital expenditures will be determined by a user-defined benefit-cost ratio and that there is no limit on annual or total expenditures.
This approach results in very high expenditures during the initial years. The budget required for 2007, the first year, is approximately $35.8 billion (2006 dollars). The total funds projected for the analysis period is $359.5 billion (2006 dollars).
Exhibits 11-21 and 11-22 show the metric and financial trends for this approach. All metrics are projected to remain at high performance levels for the duration of the analysis period. The share of structures with substructure ratings of 5 or greater will fall from 98.1 percent in 2006 to 76.9 percent by 2056. The sufficiency rating and health index values will decrease from 82.8 and 92.0, respectively, in 2006 to 75.5 and 79.2, respectively, by 2056.
| Metric | Year 2006 |
Year 2016 |
Year 2026 |
Year 2036 |
Year 2046 |
Year 2056 |
|---|---|---|---|---|---|---|
| Sufficiency Rating | 82.8 | 81.3 | 81.3 | 76.7 | 76.6 | 75.5 |
| Health Index | 92.0 | 86.0 | 82.1 | 80.0 | 79.5 | 79.2 |
| Percentage of Bridges With Deck Ratings of 5 or Greater | 95.4% | 98.4% | 98.6% | 98.6% | 98.5% | 98.6% |
| Percentage of Bridges With Superstructure Ratings of 5 or Greater | 97.9% | 98.2% | 97.9% | 97.8% | 96.9% | 97.1% |
| Percentage of Bridges With Substructure Ratings of 5 or Greater | 98.1% | 97.4% | 85.5% | 81.9% | 80.7% | 76.9% |
Under this scenario, a large surge of work is projected in the initial years. The results should provide a high-performance bridge system on the NHS. However, it is highly unlikely that certain requirements necessary for this surge are available.
The caveats for this alternative are the same as those for the previous alternative. The funding required in 2007 of $35.8 billion is 8.3 times the amount now being allocated to the NHS bridge network for all work. Over 24 percent of the bridges on the NHS would be affected for an average of 2 to 5 years. Bridge use would be severely restricted during this time, thereby affecting the flow of freight transport and the traveling public at a national level.
Conclusion
Several philosophies for managing the NHS bridge network have been presented in this chapter. They do not, by any means, constitute all possible alternatives and are intended only to illustrate potential strategies. The analysis of this limited number of options has been intended to provide some insight into the numerous possibilities available to maintain the performance and health of the NHS bridge network.
Each presented alternative has positive and negative aspects. In general, when comparing the various alternatives, those yielding the higher values of the individual metrics both over the long and short term will provide a more desirable system. In addition to high metric values, the overall cost must be considered. Some alternatives may require committing extremely high levels of funding initially and allocating physical resources most likely beyond the capabilities of the Nation.
When considering different criteria for selecting bridge projects and the possible funding options to support managing the NHS bridge network, certain items should be considered. Pertinent metrics are needed to measure system performance. Acceptable performance levels for these metrics need to be determined.
Exhibit 11-23 compares the final metrics for each evaluated alternative at the conclusion of the 50-year analysis period. The SR 50: Maintain Current Funding alternative yields the lowest values for all the metrics except for the percentage of bridges with substructure ratings of 5 or greater. The Age 50: Maximum Flat Funding alternative has the lowest substructure value in 2056. The remaining alternatives provide much higher metric levels in 2056 and, depending on the minimum acceptable performance levels selected, yield a much higher performance level for the total NHS bridge network than the SR 50: Maintain Current Funding and the Age 50: Maximum Flat Funding alternatives, even though the levels of all metrics are below those in 2006.
| Management Strategy and Funding Approach | DECK 1 | SUPER 2 | SUB 3 | Sufficiency Rating | Health Index |
|---|---|---|---|---|---|
| SR 50: Maintain Current Funding | 84.5% | 72.4% | 48.9% | 67.1 | 66.8 |
| SR 50: Maximum Flat Funding | 98.2% | 92.9% | 75.7% | 76.8 | 78.9 |
| SR 50: Maximum Ramped Funding | 98.4% | 94.2% | 77.3% | 78.3 | 80.3 |
| HI 75: Maximum Flat Funding | 98.7% | 97.7% | 89.1% | 79.2 | 82.7 |
| HI 75 Maximum Ramped Funding | 98.7% | 98.4% | 96.1% | 83.8 | 87.5 |
| HI 80: Maximum Flat Funding | 98.6% | 96.6% | 88.0% | 85.8 | 90.1 |
| HI 80: Maximum Ramped Funding | 98.7% | 98.3% | 98.0% | 85.8 | 90.1 |
| HI 85: Maximum Flat Funding | 98.6% | 95.0% | 83.8% | 80.9 | 85.5 |
| HI 85: Maximum Ramped Funding | 98.7% | 98.1% | 97.8% | 86.6 | 91.6 |
| Age 50: Maximum Flat Spending | 93.8% | 82.4% | 46.9% | 70.2 | 73.7 |
| Age 50: Maximum Ramped Spending | 98.7% | 96.8% | 94.5% | 83.8 | 90.5 |
| Age 50: Unconstrained Funding | 98.7% | 96.8% | 92.2% | 82.8 | 89.6 |
| No Special Rules: Unconstrained Funding | 98.6% | 97.0% | 76.9% | 75.5 | 79.2 |
Some alternatives provide more consistent or higher performance levels than others. When evaluating an alternative, consideration should be given to the projected performance during the analysis period in addition to the final results predicted. A management alternative may yield acceptable final results; but, at certain points during the analysis period, performance may decline to unacceptable levels for certain metrics.
Exhibit 11-24 shows projected low points for each of the evaluated metrics and year of occurrence. Low performance metrics do not necessarily exclude the associated alternative; but, they should be considered when choosing the management alternative in order to understand all factors and possible results.
| Management Strategy and Funding Approach | DECK 1 Value |
DECK 1 Year |
SUPER 2 Value |
SUPER 2 Year |
SUB 3 Value |
SUB 3 Year |
Sufficiency Rating Value |
Sufficiency Rating Year |
Health Index Value |
Health Index Year |
|---|---|---|---|---|---|---|---|---|---|---|
| SR 50: Maintain Current Funding | 84.5% | 2056 | 72.4% | 2056 | 48.9% | 2056 | 67.1 | 2056 | 66.8 | 2056 |
| SR 50: Maximum Flat Funding | 95.4% | 2006 | 92.9% | 2056 | 73.7% | 2026 | 76.5 | 2026 | 78.9 | 2056 |
| SR 50: Maximum Ramped Funding | 92.3% | 2036 | 86.4% | 2036 | 57.1% | 2026 | 71.4 | 2026 | 75.7 | 2036 |
| HI 75: Maximum Flat Funding | 95.4% | 2006 | 97.7% | 2056 | 89.1% | 2056 | 79.2 | 2056 | 82.7 | 2056 |
| HI 75 Maximum Ramped Funding | 95.4% | 2006 | 90.3% | 2036 | 57.7% | 2026 | 71.3 | 2026 | 77.7 | 2026 |
| HI 80: Maximum Flat Funding | 95.4% | 2006 | 96.6% | 2056 | 88.0% | 2056 | 80.4 | 2056 | 84.2 | 2056 |
| HI 80: Maximum Ramped Funding | 93.8% | 2036 | 87.7% | 2036 | 48.5% | 2026 | 70.1 | 2026 | 76.7 | 2036 |
| HI 85: Maximum Flat Funding | 95.4% | 2006 | 95.0% | 2056 | 83.8% | 2056 | 80.9 | 2056 | 85.5 | 2056 |
| HI 85: Maximum Ramped Funding | 91.5% | 2036 | 83.1% | 2036 | 42.5% | 2026 | 68.6 | 2026 | 75.2 | 2036 |
| Age 50: Maximum Flat Spending | 93.8% | 2056 | 82.4% | 2056 | 46.9% | 2056 | 70.2 | 2056 | 73.7 | 2056 |
| Age 50: Maximum Ramped Spending | 95.4% | 2006 | 88.9% | 2036 | 59.7% | 2026 | 72.6 | 2026 | 78.7 | 2026 |
| Age 50: Unconstrained Funding | 95.4% | 2006 | 96.8% | 2036 | 88.2% | 2026 | 80.6 | 2026 | 85.6 | 2026 |
| No Special Rules: Unconstrained Funding | 95.4% | 2006 | 96.9% | 2046 | 76.9% | 2056 | 75.5 | 2056 | 79.2 | 2056 |
Understanding the funding stream required to implement any of the alternatives is just as important, and in some situations more important, as the total funds required for an alternative (Exhibit 11-25). Gradually increasing allocated funds, the ramped spending alternative, reduces the tendency to create "peak demand spikes" by addressing a few more bridge needs each year. This alternative reduces the backlog of needs in a gradually increasing manner.
| Approach | Annual Allocated Funds Initial 2007 Budget (Billions) |
Annual Allocated Funds Increase per Year (Percent) |
Annual Allocated Funds Final 2056 Budget (Billions) |
Total Funds Allocated 50 Years (Billions) |
|---|---|---|---|---|
| SR 50: Maintain Current Funding | $4.3 | - | $4.3 | $215.0 |
| SR 50: Maximum Flat Funding | $7.5 | - | $7.5 | $375.0 |
| SR 50: Maximum Ramped Funding | $4.4 | 1.8% | $10.5 | $349.7 |
| HI 75: Maximum Flat Funding | $11.0 | - | $11.0 | $550.0 |
| HI 75 Maximum Ramped Funding | $4.4 | 3.1% | $19.8 | $515.1 |
| HI 80: Maximum Flat Funding | $14.4 | - | $14.4 | $720.0 |
| HI 80: Maximum Ramped Funding | $4.5 | 3.7% | $26.4 | $620.8 |
| HI 85: Maximum Flat Funding | $18.5 | - | $18.5 | $925.0 |
| HI 85: Maximum Ramped Funding | $4.5 | 4.1% | $32.1 | $704.9 |
| Age 50: Maximum Flat Spending | $11.3 | - | $11.3 | $565.0 |
| Age 50: Maximum Ramped Spending | $4.5 | 4.5% | $38.8 | $802.1 |
| Age 50: Unconstrained Funding | $40.4 | - | $35.3 | $1,126.8 |
| No Special Rules: Unconstrained Funding | $35.8 | - | $6.8 | $359.5 |
Allocating a set amount of funding in the flat spending alternative may not provide sufficient funds to reduce the backlog, thereby potentially increasing the backlog. The No Special Rules: Unconstrained Funding alternative projects a large influx of funding in 2007, followed by relatively flat funding. This alternative has the third-lowest total cost but a high initial year cost. The Age 50: Unconstrained Funding alternative also has a very high cost in 2007 and requires increased yearly funding for the remainder of the analysis period, resulting in the highest total cost.
An alternative to manage the NHS bridge network, whether it is one of those presented in this chapter or another, should be evaluated on the final goals desired, the performance provided during the implementation period (10 years, 25 years, 50 years, etc.), the total cost and return on investment, and the necessary funding stream. All aspects, both positive and negative, of each proposed alternative should be evaluated and compared against those in other alternatives before a selection is made.