

- Condition and Performance of Transportation Serving Federal and Indian Lands
- Types of Federal Lands
- Resources Served Within Federal and Indian Lands
- Condition and Performance of Roads Serving Federal and Indian Lands
- U.S. Forest Service—Forest Highway Program
- National Park Service—Park Roads and Parkways Program
- Retaining Wall Inventory Program
- Bureau of Indian Affairs—Indian Reservation Roads and Bridges Programs
- U.S. Fish and Wildlife Service—Refuge Roads Program
- Non-FLH Core Partners
- Bureau of Land Management—Public Lands Development Roads
- Bureau of Reclamation
- Department of Defense—Military Installation Roads
- U.S. Army Corps of Engineers
- U.S. Forest Service—Public Forest System Roads
- Summary of Road and Bridge Conditions
- Transportation Funding for Federal and Indian Lands
- Role of Transportation in the Use of Federal and Indian Lands
- Alternative Transportation in Parks and Public Lands Program
Condition and Performance of Transportation
Serving Federal and Indian Lands
|
Acronyms
|
Types of Federal Lands
Federal and Indian lands are managed by various Federal Land Management Agencies (FLMAs) within the Departments of the Interior, Agriculture, and Defense. Exhibit 12-1 highlights resources managed by eight FLMAs.
| Federal Land Management Agency | Federal Lands Served |
|---|---|
| Department of Agriculture | |
| U.S. Forest Service | 155 National Forests and 22 National Grasslands |
| Department of the Interior | |
| National Park Service | 391 National Parks and Monuments |
| Bureau of Indian Affairs | 560 Federally recognized Tribes and Indian and Alaskan Native villages |
| Fish and Wildlife Service | 548 National Wildlife Refuges, 37 Wetland Management Districts, 70 National Fish Hatcheries, and 42 administrative sites |
| Bureau of Land Management | 258 million acres of public lands, 3,496 recreation sites |
| Bureau of Reclamation | 479 dams, 348 reservoirs, 308 recreation sites, and 59 power plants |
| Department of Defense | |
| Military Installations | 500 military installations |
| U.S. Army Corps of Engineers | 423 lakes |
Resources Served Within Federal and Indian Lands
Each site managed by FLMAs has a unique mission for preserving and protecting its resources while providing access to those resources in varying degrees for the enjoyment of the public. Most FLMAs are charged with managing the resources for present generations without impairing them for future generations. Resource management includes preserving and protecting natural, cultural, historical, and wildlife areas; many of these sites have multiple uses, while others have very limited, specific uses.
Approximately half of the Federal lands are managed under multiple use and sustained yield policy, which relies on transportation. The remaining lands are managed under protected use management policies; however, transportation systems are essential to their resource management, development, recreational use, and protection.
|
The growing mission of many of the individual sites includes providing access to resources for the enjoyment of the public. |
Federal and Indian lands have many uses, including recreation, range and grazing, timber, minerals, watersheds, fish and wildlife, and wilderness. Indian reservations and trust land are home to Indian tribal governments and thousands of residents, both tribal members and nontribal members. Roads on Indian lands provide access and mobility for residents and provide access to regional and national transportation systems. Tribal roads are essential for economic development and community development on reservations. These lands are also managed to protect natural, scenic, scientific, and cultural values. In recent years, resource extraction and cutting of timber have been significantly reduced, while recreational use has significantly increased.
Recreation on Federal lands is measured in recreation visitor days (RVDs), a measure of time spent on Federal lands. This standard, however, is defined differently by each agency. Exhibit 12-2 summarizes recreational use and other uses of Federal and Indian lands.
| Federal Agency | Other Land Uses Recreation |
Other Land Uses Timber |
Other Land Uses Minerals & Oil |
Other Land Uses Grazing & Farming |
Other Land Uses Water Resource |
Other Land Uses Wildlife |
Other Land Uses Energy |
Other Land Uses National Defense |
Other Land Uses Housing |
Other Land Uses Industry |
|---|---|---|---|---|---|---|---|---|---|---|
| Department of Agriculture | ||||||||||
| U.S. Forest Service | ||||||||||
| Department of Interior | ||||||||||
| National Park Service | ||||||||||
| Bureau of Indian Affairs | ||||||||||
| Fish and Wildlife Service | ||||||||||
| Bureau of Land Management | ||||||||||
| Bureau of Reclamation | ||||||||||
| Department of Defense | ||||||||||
| Military Installations | ||||||||||
| U.S. Army Corps of Engineers | ||||||||||
Condition and Performance of Roads Serving Federal and Indian Lands
Use of roads by private vehicles and tour buses continues to be the primary method of travel to and within Federal and Indian lands. Exhibit 12-3 summarizes the number of total roadway miles, paved roadway miles, and bridges on Federal and Indian lands.
| Federal Lands | Length Miles | Paved Miles | Number of Bridges |
|---|---|---|---|
| Department of Agriculture | |||
| USFS, State and Local | 99,100 | 31,400 | 4,526* |
| Department of the Interior | |||
| National Park Service | 9,550 | 5,450 | 1,414 |
| BIA, Tribe, State, & Local | 90,731 | 36,883 | 8,082 |
| Fish and Wildlife Service | 4,900 | 415 | 265 |
| Bureau of Land Management | 68,880 | N/A | 776 |
| Bureau of Reclamation | 1,863 | 1,082 | 900 |
| Department of Defense | |||
| Military Installations | 14,400 | 14,400 | TBD |
| U.S. Army Corps of Engineers | 12,164 | 6,996 | 252 |
The transportation systems serving various Federal and Indian lands are discussed below, including bridge and roadway deficiencies. Roadways are generally rated as "good," "fair," or "poor" according to the Pavement Condition Rating standard, although rating definitions may vary among the FLMAs.
The Office of Federal Lands Highway within the Federal Highway Administration (FHWA) works with a number of FLMAs. Twenty-five years ago, FLHP was created by the 1982 Surface Transportation Assistance Act, signed by the President on January 6, 1983; however, the work of the Office of Federal Lands Highway, i.e., Accessing America's Treasures on Federal lands, is not new to FHWA. For close to 100 years, FHWA and its predecessors like the Bureau of Public Roads have been doing this work.
| Are the road mileage and bridge numbers presented in this chapter fully consistent with those reported in the National Bridge Inventory (NBI) and the Highway Performance Monitoring System (HPMS)? | |
|
The numbers in this chapter are supplied by the individual FLMA. Due to differences in definitions, these figures may not match those from NBI and HPMS. FHWA is working with its Federal partners to reconcile the differences.
|
|
The four FLMAs that have Federal Lands Highway (FLH) programs and that are known as core partners are the U.S. Forest Service (USFS), National Park Service (NPS), Bureau of Indian Affairs (BIA), and U.S. Fish and Wildlife Service (FWS). Other FLMAs meet their roadway needs from outside the FLHP.
U.S. Forest Service—Forest Highway Program
The 155 National Forests and 22 National Grasslands offer a wide spectrum of recreation opportunities. For instance, the 191 million acres of National Forest System lands contain 128,000 miles of fishing streams and rivers; over 2.2 million acres of lakes, ponds, and reservoirs; and 12,500 miles of coast and shoreline.1
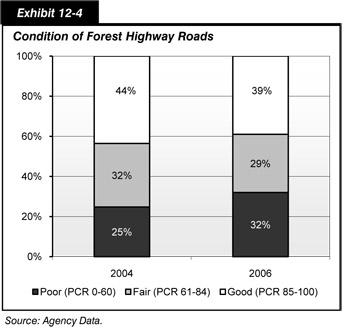
There are almost 99,100 miles of National Forest System Roads (NFSR) and 4,526 bridges used by the public. Approximately 29,500 miles of the roads are paved and the remainder is gravel surface. The condition ratings of paved roads for all 99,100 miles of NFSR are 39 percent good, 29 percent fair, and 32 percent poor.
Approximately 29,200 miles of NFSR are State and local roads designated as Forest Highways, of which only 2,000 are under USFS jurisdiction. The Forest Highway Program is funded under the FLHP. The other 69,900 miles of NFSR are considered "Public Forest Roads," and do not receive FLHP funding. The condition of Forest Highway roads is shown in Exhibit 12-4.
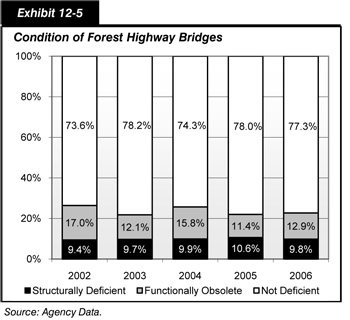
There are approximately 4,526 bridges on NFSR used by the public, combined between Forest Highways and Public Forest Roads. The condition of Forest Highway bridges from 2002 through 2006 is shown in Exhibit 12-5. In 2006, approximately 77 percent were not deficient, nearly 13 percent were functionally obsolete, and slightly less than 10 percent were structurally deficient.
The composition of NFSR is summarized in Exhibit 12-6.
| Road Type | Road Miles Unimproved Earth |
Road Miles Graded Earth Template |
Road Miles Gravel |
Road Miles Paved |
Road Miles Total |
Bridges |
|---|---|---|---|---|---|---|
| Forest Highway | N/A | 600 | 7,100 | 21,500 | 29,200 | - |
| Public Forest Roads (USFS jurisdiction) | N/A | 5,000 | 56,900 | 8,000 | 69,900 | - |
| Total | N/A | 5,600 | 64,000 | 29,500 | 99,100 | 4,526 1 |
National Park Service—Park Roads and Parkways Program
The NPS system includes 391 national park units containing more than 84 million acres. This system includes parks, parkways, monuments, historic sites, military parks, battlefields, memorials, recreational areas, and scenic waterways.
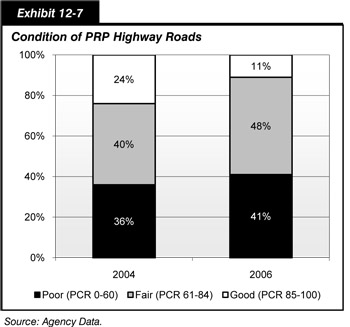
There are about 9,550 miles of Park Roads and Parkways (PRP), of which about 5,450 miles are paved. As shown in Exhibit 12-7, approximately 11 percent of pavement road mileage in 2006 was rated as good, while 48 percent was identified as fair and 41 percent was considered poor.
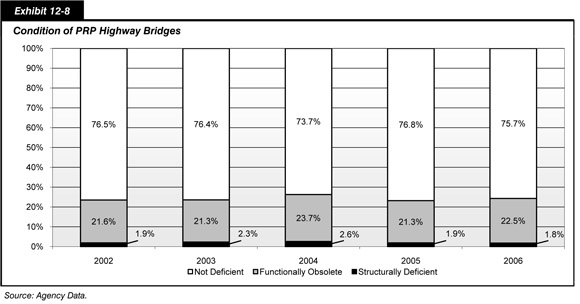
The annual vehicle miles traveled (VMT) on PRP roads is 2.4 billion, based upon a subset of 33 parks representing 63 percent of paved road miles for which VMT figures are available. PRP roads have a total of approximately 1,414 public bridges and 63 tunnels; less than 2 percent of the bridges are structurally deficient. Bridge conditions for 2002 through 2006 are shown in Exhibit 12-8.
The road system serving National Parks is summarized in Exhibit 12-9.
| Road Type | Road Miles Unimproved Earth |
Road Miles Graded Earth Template |
Road Miles Gravel |
Road Miles Paved |
Road Miles Total |
Bridges |
|---|---|---|---|---|---|---|
| Public Roads | N/A | N/A | 4,100 | 5,450 | 9,550 | 1,414 |
Retaining Wall Inventory Program
The NPS has also requested that the FHWA develop a strategy and procedure for a retaining wall inventory program that, in the same manner as the existing Road Inventory Program and the NBI Program, supports the NPS Facility Management Software System asset management program. As of February 2008, inventories have been conducted in all 26 parks selected for the Phase 1 field effort. Approximately 2,000 walls have been inventoried thus far, with nearly 2,500 walls anticipated to be investigated by the conclusion of the Phase 1 effort. Thus far in Phase 1, 23 different wall types have been inventoried, with the vast majority being culturally sensitive mortared/nonmortared stone masonry structures—wall assets common to the vast majority of National Parks. Of the approximately 2,000 walls, over 87 percent have received relatively high condition ratings and have been found to require little or no maintenance for continued serviceability.
Bureau of Indian Affairs—Indian Reservation Roads and Bridges Programs
The BIA manages 56 million acres and has stewardship and trust responsibility for programs that serve the more than 560 Federally recognized American Indian and Alaskan Native tribes, villages, groups, and communities. In many instances, American Indian and Alaskan Native villages are in isolated locations with little arable land and few known natural resources. Isolation is also a result of geologic features such as islands, lakes, rivers, and difficult terrain and can be perpetuated by lack of transportation facilities.
The IRR system provides access to and within American Indian and Alaskan Native reservations, lands, communities, and villages. There are two categories of IRR roads. The first consists of approximately 32,996 miles of public roads that are owned and maintained by the BIA and tribal governments. These are referred to as BIA system roads. The second category consists of about 57,735 miles of State and local public roads, and other Federal roads. These roads provide access to American Indian reservations and Alaska Native villages or, in some instances, are located within reservations or American Indian lands. Over 55 percent of the IRR system is unimproved, earth, and/or gravel. The annual VMT on these roads is 2 billion. The annual fatal accidents on IRR exceed four times the national average.
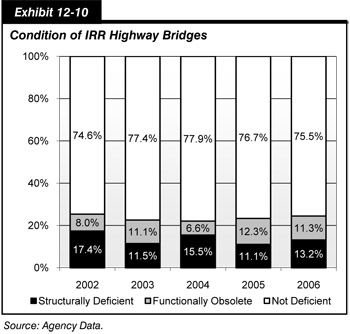
The condition ratings of IRR roads are 16 percent good, 39 percent fair, and 45 percent poor. Nearly 37,000 miles of the IRR roads are paved. About 25 percent of the BIA-owned unpaved roads are constructed to nationally recognizable standards. There are 8,045 bridges within the entire IRR system, of which 940 are tribally or BIA-owned. Exhibit 12-10 describes the condition of IRR Highway Bridges from 2002 through 2006. Currently, approximately 24.5 percent of all IRR bridges are either functionally obsolete and/or structurally deficient.
The IRR system is summarized in Exhibit 12-11.
| Unimproved Earth1 | Graded Earth Template1 | Gravel | Paved | Total | Bridges | |
|---|---|---|---|---|---|---|
| BIA | N/A | N/A | 21,278 | 6,817 | 28,095 | 940 |
| Tribes | N/A | N/A | 4,532 | 369 | 4,901 | N/A2 |
| State | N/A | N/A | 593 | 13,014 | 13,607 | 2,310 |
| Local | N/A | N/A | 27,567 | 16,561 | 44,128 | 4,795 |
| Total | N/A | N/A | 53,970 | 36,761 | 90,731 | 8,045 |
Average annual authorizations in the Safe, Accountable, Flexible, Efficient Transportation Equity Act – A Legacy for Users (SAFETEA-LU) of FLHP funding for IRR are $356 million per year. Two percent of this is reserved for transportation planning. In addition, $14 million of funding is received annually for the national IRR Bridge Program. This program replaces or rehabilitates functionally obsolete or structurally deficient IRR bridges identified in the FHWA NBI System.
U.S. Fish and Wildlife Service—Refuge Roads Program
The FWS manages the National Wildlife Refuge System. This system consists of 585 wildlife refuges and wetland management districts encompassing 96 million acres of land in the 50 States, Puerto Rico, the Virgin Islands, American Samoa, Guam, and the Caribbean and Pacific insular possessions of the United States. FWS receives about 40 million recreation visits per year and has a variety of roads, trails, boat ramps, access points, bicycle trails, and viewing areas. FWS also operates 70 National Fish Hatcheries that are open to the public for visits and tours.
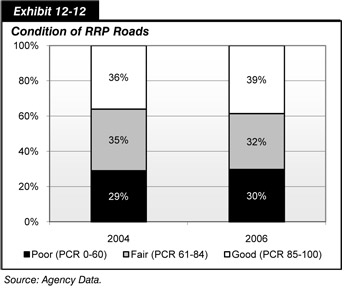
FWS administers 4,900 miles of public roads. Four hundred fifteen miles of public FWS roads are paved; the remaining miles consist of gravel and native surfaced roads. Exhibit 12-12 shows pavement condition ratings for Refuge Roads Program (RRP) roads between 2004 and 2006.
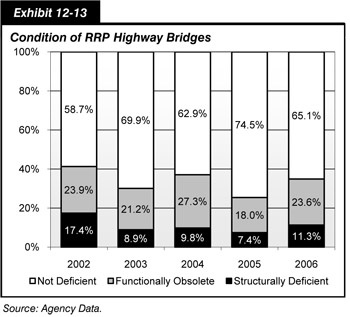
The National Wildlife Refuge System contains 265 public bridges and 5,153 public parking lots. About 24 percent of RRP bridges were functionally obsolete in 2006, while 11 percent were structurally deficient. Bridge conditions from 2002 through 2006 are shown in Exhibit 12-13.
The road system serving FWS lands is summarized in Exhibit 12-14.
| Road Type | Road Miles Unimproved Earth |
Road Miles Graded Earth Template |
Road Miles Gravel |
Road Miles Paved |
Road Miles Total |
Bridges |
|---|---|---|---|---|---|---|
| Public Roads | N/A | 1,800 | 2,685 | 415 | 4,900 | 265 |
Funds from RRP were authorized at $29 million beginning in FY 2005. The funds are used for improving the existing roads within the National Wildlife Refuge System and may not be used to fund new construction.
Non-FLH Core Partners
The following transportation systems do not have a dedicated funding program through SAFETEA-LU. However, many of these agencies' roads are open for public use. For the purposes of this report, FHWA elected to include transportation condition and performance data of all major FLMAs.
Many National Parks and National Forests have become more visited and an increasing number of people are using facilities on Bureau of Land Management (BLM)–managed lands, Corps of Engineers (USACE) facilities, and Department of Defense (DoD) installations. On BLM lands in 2006 alone, more than 69 million visitor days took place, an increase of 7 million since 2001. Annual visits to BLM lands increased nearly 5 million, or 9 percent, between 1999 and 2005.
Bureau of Land Management—Public Lands Development Roads
The BLM manages 258 million acres, about 13 percent of the surface area of the United States, and is the largest manager of Federal lands (42 percent overall). The BLM lands are concentrated primarily in 11 Western States and Alaska.
Public areas managed by BLM include 17 National Conservation Areas, 15 National Monuments, 375 National Recreation Areas, 12 National Scenic and Historic Trails, 45 National Landmarks, and 3,496 Recreation Sites. BLM is responsible for the balanced management of lands and resources. This includes resource protection, recreation, range and grazing, timber harvesting, mineral and oil extraction, watersheds, fish and wildlife, and wilderness. Management is based on the principles of multiple use and sustained yield. BLM is responsible for maintaining the land and minerals records and the U.S. Public Land Survey System.
The BLM manages a network of 68,880 miles of Public Lands Development Roads (PLDR). Many of the roads serve public-use and special purposes, such as those that serve recreational development areas. The BLM has constructed new roads over the last 25 years to meet recreation and other resource access needs. The system also has 776 bridges and major culverts. As of 2001, the most recent year for which data are available, the condition ratings of roads were 10 percent good, 46 percent fair, and 44 percent poor. Data for BLM roads and bridges are given in Exhibit 12-15.
| Road Type | Road Miles Unimproved Earth |
Road Miles Graded Earth Template |
Road Miles Gravel |
Road Miles Paved |
Road Miles Total |
Bridges |
|---|---|---|---|---|---|---|
| PLDR | N/A | N/A | N/A | N/A | 68,880 | 776 |
Bureau of Reclamation
The Bureau of Reclamation (BOR) administers 472 dams and 348 reservoirs in 17 Western States and manages 308 recreation sites. One of the most notable reservoirs is Lake Mead, created by Hoover Dam. BOR is the ninth-largest electric utility and second-largest producer of hydropower in the United States, with 58 powerplants producing an average of 44 billion kilowatt-hours annually. BOR is also the Nation's largest wholesale water supplier, delivering 10 trillion gallons of water to more than 31 million people each year and providing one out of five western farmers with irrigation water.
The BOR owns approximately 1,863 miles of public roads and an estimated 900 bridges that are open for use by the general public. The road system serving BOR lands is summarized in Exhibit 12-16.
| Road Type | Road Miles Unimproved Earth |
Road Miles Graded Earth Template |
Road Miles Gravel |
Road Miles Paved |
Road Miles Total |
Bridges |
|---|---|---|---|---|---|---|
| Public Roads | N/A | N/A | 781 | 1,082 | 1,863 | 900 |
Department of Defense—Military Installation Roads
There are approximately 500 major military reservations in the United States encompassing about 24 million acres of land. DoD roads are open to use by dependents, visitors, and other members of the public, even though they may be required to stop at a gate area. Roads on military installations serve housing, offices, commissaries, base exchanges, recreation facilities, unrestricted training facilities, hospitals, and through-traffic. This public street system is similar to street systems in urban areas; in many cases, military streets are an integral part of the local community's street system, and motorists may not even realize they are on a military street.
DoD regulations allow public access to recreational facilities such as lakes, beaches, and wooded areas for bases within the continental United States. The public may access these areas for fishing, swimming, hunting, and other natural resource enjoyment except where an overriding military mission specifically requires a temporary or permanent suspension of such use. Improved recreational facilities such as baseball, football, and soccer fields; gymnasiums; golf courses; swimming pools; and bowling alleys are also available. These facilities attract an estimated 15 million visitors annually. Also, there are 244 man-made lakes open to public recreational use on military installations.
About 14,400 miles of paved public roads, referred to as Military Installation Roads (MIR), are under the jurisdiction of the DoD. Of these, approximately 590 miles (4 percent) are classified as principal arterial roads, 2,550 miles (18 percent) as collector roads, and 11,260 miles (78 percent) as local roads. These roads accommodate approximately 5.8 billion vehicle miles traveled annually, with approximately 50 percent on the principal arterial and collector roads.
The conditions of public base roads are 17 percent good, 12 percent fair, and 71 percent poor. Roads serving military installations are summarized in Exhibit 12-17.
| Road Type | Road Miles Unimproved Earth |
Road Miles Graded Earth Template |
Road Miles Gravel |
Road Miles Paved |
Road Miles Total |
Bridges |
|---|---|---|---|---|---|---|
| Roads | N/A | N/A | N/A | 14,400 | 14,400 | TBD |
U.S. Army Corps of Engineers
The USACE is the largest provider of water-based recreation. The USACE currently administers approximately 12.7 million acres of land and water at 423 lakes and waterways reporting recreational use throughout the United States. USACE lakes and waterways have 4,479 recreation areas, including 970 campgrounds, 4,666 miles of trails, 3,430 launching ramps, and 829 swimming beaches available for public use. The USACE directly manages 2,615 recreation areas. The remainder is managed by other Federal agencies (53 areas), States (583 areas), local governments (556 areas), concessionaires (380 areas), and quasi public agencies (287 areas). USACE recreation facilities are located in all but seven States.
Most of the USACE lakes and waterways are in locations in reasonable proximity to the public. More than 80 percent are within 50 miles of a major metropolitan area, and 94 percent are within a 2-hour drive. The majority of USACE resources are located east of the Rocky Mountains, where the majority of the U.S. population resides.
There are 12,164 miles of roads on USACE lands, of which 6,996 miles are paved. Of total roads, 9,860 miles are public USACE operations and maintenance roads, and 2,304 miles of public roads are out-granted to partners for operations and maintenance. Fifty-three percent of USACE public roads are rated in good condition, 29 percent in fair condition, and 18 percent in poor condition. The USACE owns 252 bridges; bridge conditions have not been assessed. The road system serving USACE facilities is summarized in Exhibit 12-18.
| Road Type | Road Miles Unimproved Earth |
Road Miles Graded Earth Template |
Road Miles Gravel |
Road Miles Paved |
Road Miles Total |
Bridges |
|---|---|---|---|---|---|---|
| Public/USACE1 | N/A | N/A | 4,172 | 5,688 | 9,860 | 252 |
| Public/Leased | N/A | N/A | 996 | 1,308 | 2,304 | N/A |
| Total | N/A | N/A | 5,168 | 6,996 | 12,164 | 252 |
U.S. Forest Service-—Public Forest System Roads
As noted earlier, of the 99,100 miles of NFSR, 69,900 are considered Public Forest Roads, and do not receive FLHP funding. Only the 29,200 miles of Forest Highways receive FLHP funding.
Summary of Road and Bridge Conditions
Exhibit 12-19 presents a summary of the condition of all roads and bridges serving Federal lands.
| Federal Lands | Road Category | Owner | Length Miles | Paved Miles | Condition of Paved Roads % Good |
Condition of Paved Roads % Fair |
Condition of Paved Roads % Poor |
Bridges Number |
Bridges % Deficient |
|---|---|---|---|---|---|---|---|---|---|
| Department of Agriculture | |||||||||
| U.S. Forest Service | FH | State/Local | 27,200 | 21,400 | N/A | N/A | N/A | 4,526 1 | 13% |
| U.S. Forest Service | FH | USFS | 2,000 | N/A | N/A | N/A | N/A | N/A | TBD |
| U.S. Forest Service | NFSR - Public | USFS | 69,900 | 8,000 | 20% 2 | 61% | 19% | N/A | TBD |
| Department of the Interior | |||||||||
| National Park Service | PRP | NPS | 9,550 | 5,450 | 11% | 48% | 41% | 1,414 | 2 |
| Bureau of Indian Affairs | IRR | BIA/Tribal | 32,996 | 7,186 | 16% | 39% | 45% | 940 | 24% |
| Bureau of Indian Affairs | IRR | State/Local | 57,735 | 29,575 | N/A | N/A | N/A | 7,142 | 0 |
| U.S. Fish and Wildlife Service | Public Roads | FWS | 4,900 | 415 | 46% | 44% | 24% | 265 | 11% |
| Bureau of Land Management | LMHS | Local | 7,208 | 3,608 | N/A | N/A | N/A | N/A | TBD |
| Bureau of Land Management | PLDR | BLM | 76,383 | 10% | 46% | 44% | 776 | 6% | |
| Bureau of Reclamation | Public Roads | BOR | 1,863 | 1,082 | 65% | 25% | 10% | 900 | 12% 3 |
| Department of Defense | |||||||||
| Military Installations | MIR | DoD | 14,400 | 14,400 | 17% | 12% | 71% | N/A | TBD |
| U.S. Army Corps of Engineers | Public Roads | USACE | 7,808 | 5,152 | 53% | 29% | 18% | 252 | TBD |
| U.S. Army Corps of Engineers | Roads | USACE | 2,052 | 536 | 69% | 24% | 8% | N/A | TBD |
BIA: Bureau of Indian Affairs
BLM: Bureau of Land Management
BOR: Bureau of Reclamation
DoD: Department of Defense
FH: Forest Highways Program
FWS: Fish and Wildlife Service
IRR: Indian Reservation Roads
LMHS: Land Management Highway System
MIR: Military Installation Roads
NFSR: National Forest System Roads
NPS: National Park Service
PLDR: Public Lands Development Roads
PRP: Park Roads and Parkways
USACE: U.S. Army Corps of Engineers
USFS: U.S. Forest Service
Transportation Funding for Federal and Indian Lands
The FLHP SAFETEA-LU authorizations for 2005 through 2009 total over $4.5 billion for the Public Lands Highways (PLH) (Discretionary and Forest Highways), PRP, IRR, and RRP. FLHP funds can be used for transportation planning, research, engineering, and construction of highways, roads, parkways, and transit facilities within public lands, National Parks, and Indian reservations. In addition, FLHP funds can also be used as the State/local match for most types of Federal-aid highway funded projects.
|
During the past five fiscal years, the FLHP has improved, on average, about 1,000 miles of roads and 35 to 40 bridges per year. |
Exhibit 12-20 outlines FLHP funding under SAFETEA-LU for 2005 through 2009. These programs result in "core partners."
| Category | SAFETEA-LU 2005 |
SAFETEA-LU 2006 |
SAFETEA-LU 2007 |
SAFETEA-LU 2008 |
SAFETEA-LU 2009 |
SAFETEA-LU Total |
|---|---|---|---|---|---|---|
| PLH-FH | 173 | 187 | 187 | 193 | 200 | 940 |
| PLH-D | 87 | 93 | 93 | 97 | 100 | 470 |
| IRR | 300 | 330 | 370 | 410 | 450 | 1,860 |
| IRR - Bridges | 14 | 14 | 14 | 14 | 14 | 70 |
| PRP | 180 | 195 | 210 | 225 | 240 | 1,050 |
| RRP | 29 | 29 | 29 | 29 | 29 | 145 |
| Total | 783 | 848 | 903 | 968 | 1,033 | 4,535 |
Other FLMAs that work with FLH on a more limited basis are as follows:
- BLM—Public Lands Development Roads
- BOR
- DoD—Military Installation Roads
- USACE
- USFS—Public Forest System Roads.
These FLMAs each receive between $500,000 and $1 million from the PLH program for transportation planning activities only. The FLMAs rely on their own appropriations or other sources of funding for additional transportation planning, research, engineering, and construction of highways, roads, parkways, and transit facilities within their jurisdiction.
Often, FLMA lands are located either adjacent to or very near each other. This situation presents an opportunity to create seamless transportation systems and leverage Federal funds within and between these lands through integrated transportation planning.
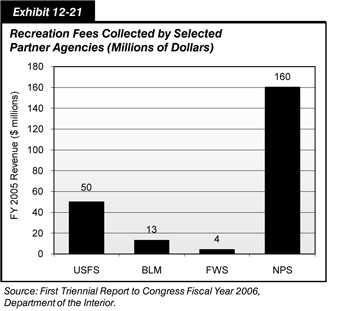
In addition to FLHP funds, certain National Parks, Forests, and Wildlife Refuges collect recreation fees that help maintain those areas. Recreation fees (collected under the Federal Lands Recreation Enhancement Act [FLREA, also known as REA]) supplement FLMAs' transportation programs, but the Highway Trust Fund and Title 23 appropriations continue to be the primary source of funds. Exhibit 12-21 shows the recreation fees collected by selected FLMAs, which generated a total of $228 million in FY 2005.2 A portion of the fees collected are distributed back to transportation either directly by the FLMAs or indirectly through the county and/or State.
Role of Transportation in the Use of Federal and Indian Lands
Transportation plays a key role in the way people access and enjoy Federal lands and provides access to resources. Federal lands possess approximately 329,000 miles of public roads of which about 93,000 miles are State and local roads that provide access to and within these lands. Transportation is also critical to the quality of life in Indian communities, providing access between American Indian and Alaskan Native housing and education, emergency centers, and places of employment. The transportation system is vital to encouraging economic development on Indian lands.
Many FLHP roads are also designated by State and Federal governments as Scenic Byways. Under the FHWA National Scenic Byways Program, FLMAs have had numerous designations; NPS units have over 73 National Scenic Byways and All American Road designations, the USFS has 69, the FWS has 24, BLM has 4, and BIA has 9 that share a geographic location crossing Federal partners' lands or, in some instances, that are the attraction itself, like the Blue Ridge Parkway or the Natchez Trace Parkway. The USFS began designating National Forest Scenic Byways in 1988, and today there are 136 routes over 9,126 miles in 34 states. Similarly, in 1989, the BLM began designating routes as Back Country Byways, and today these constitute more than 60 routes over 3,100 miles in 11 States. There are also over 3,000 miles of NPS roads and parkways that meet the criteria for Scenic Byways. Finally, the BIA has identified 1,000 miles of IRR with the potential for Scenic Byways designation.
Roads serving Federal and Indian lands are summarized in Exhibit 12-22.
| Federal Lands Served | Road Category | Owner | Length Miles |
|---|---|---|---|
| Department of Agriculture | |||
| National Forest | Forest Highways | State/Local/USFS | 29,200 |
| National Forest | Public Forest System Roads | U.S. Forest Service | 69,900 |
| Department of the Interior | |||
| National Parks | Park Roads and Parkways | National Park Service | 9,550 |
| Indian Lands | Indian Reservation Roads | Bureau of Indian Affairs/Tribal* | 32,996 |
| Indian Lands | Indian Reservation Roads | State/Local/Other | 57,735 |
| Wildlife Refuges | Wildlife Refuge Roads | Fish and Wildlife Service | 4,900 |
| Public Lands (BLM Lands) | Public Lands Development Roads | Bureau of Land Management | 76,000 |
| Reclamation Projects | Reclamation Roads (Intended for Public Use) | Bureau of Reclamation | 1,980 |
| Department of Defense | |||
| Military Installations | Military Installation Roads | DoD | 14,400 |
| U.S. Army Corps of Engineers | Corps Recreation Roads | USACE | 7,808 |
| U.S. Army Corps of Engineers | Leased Roads to States | USACE | 2,304 |
| Total | 306,773 | ||
Endnotes
1 http://www.fs.fed.us/biology/fish/fish.cfml, accessed February 2008.
2 Federal Lands Recreation Enhancement Act: First Triennial Report to Congress Fiscal Year 2006. Department of the Interior. NPS includes $128 million from REA fees, National Park Pass revenues, Transportation Revenue, etc.
Alternative Transportation in Parks and Public Lands Program
The Alternative Transportation in Parks and Public Lands (ATPPL) program was established in 2005 under Safe, Accountable, Flexible, Efficient Transportation Equity Act – A Legacy for Users (SAFETEA-LU). The ATPPL program provides a total $97 million of Federal funding to help develop transportation alternatives for enjoying our parks and public lands while protecting resources. The new program's goals are to conserve natural, historical and cultural resources; reduce congestion and pollution; improve visitor mobility and accessibility; enhance the visitors' experience; and ensure access to all, including persons with disabilities.
Federal agencies that manage parks, refuges, or recreational areas that are open to the general public are eligible to apply for funds. This includes the U.S. Fish and Wildlife Service, the National Park Service, the U.S. Forest Service, the Bureau of Land Management and the Bureau of Reclamation. Also eligible to apply are State, tribal, or local governmental authorities with jurisdiction over land in the vicinity of an eligible area, acting with the consent of the Federal land management agency. The program is administered by the Federal Transit Administration (FTA) in cooperation with the Department of the Interior and the Department of Agriculture.
An interagency working group was established to guide the program. Members include the FTA, the Department of the Interior, the National Park Service (NPS), the U.S. Fish and Wildlife Service (FWS), the Bureau of Land Management (BLM), and the U.S. Department of Agriculture's Forest Service. The working group jointly developed program structure, selection criteria, a solicitation and evaluation process for applications, and grant and reimbursable agreement funding mechanisms. In cooperation with inter-agency partners, FTA staff developed program requirements and an oversight program to ensure proper use of Federal funds. Finally, FTA staff, working with inter-agency partners, developed initial technical assistance, research, and planning activities to support the program.
In 2006, a total of 78 proposals were received totaling $40.5 million, approximately twice the amount available for projects, indicating high competition for funds. In 2007, proposals totaled $55.0 million, while in 2008 proposals totaled $55.2 million. Exhibit 12-23 shows funding that has been made available for the program.
| (Millions of Dollars) Funds Appropriated |
(Millions of Dollars) Funds Authorized |
(Millions of Dollars) Proposals Received |
|
|---|---|---|---|
| 2006 | 21.8 | 22.0 | 40.5 |
| 2007 | 23.0 | 23.0 | 55.0 |
| 2008 | 25.0 | 25.0 | 55.2 |
| 2009 | 27.0 | 27.0 | |
| Total | 96.8 | 97.0 |
As such, FTA's planning and policy staff worked closely with Federal land management agency representatives to develop a process that would select the most meritorious projects - those that were both strong transportation projects and best met the unique needs of Federal lands. An interagency technical review committee carefully evaluated the project proposals based on the considerations defined in the program's legislation. The main categories of evaluation criteria used were demonstration of need, visitor mobility and experience benefits, environmental benefits, and operational efficiency and financial sustainability. Then, as specified in the program's legislation, the Department of Interior determined the final selection of projects after consultation with and in cooperation with the Department of Transportation.
In 2006, the program funded 42 alternative transportation projects. In 2007, the program funded 46 projects. The alternative transportation projects selected for funding represent a diverse set of capital and planning projects across the country.
SAFETEA-LU allows a broad range of projects under this new program. The types of projects selected include purchase of buses for new transit service, replacement of old buses and trams, construction of a bicycle and pedestrian pathway, ferry dock replacement, intelligent transportation system components, and planning studies.
Fifty of the projects (totaling $32 million) funded in 2006 and 2007 are capital projects and 38 (totaling $7.5 million) are planning projects. As such, the bulk of the program dollars are used to fund capital investments with a smaller amount devoted to planning for future projects.
As predicted by the August 2001 Department of Transportation (DOT) – Department of Interior (DOI) study on alternative transportation needs in public lands, the National Park Service had the highest need for alternative transportation. In 2007, 70 percent of project funds were allocated towards projects serving National Parks, 15 percent are for projects serving National Forests, 11 percent are for projects serving Fish and Wildlife Refuges, and four percent are for projects serving Bureau of Land Management areas.
The awards include funding for both existing alternative transportation systems – through projects such as purchasing replacement buses – and funding for brand new systems. This enables the program to support the continued quality of existing alternative transportation systems such as those in Acadia National Park and Zion National Park, which were earlier pilot projects for DOT and DOI collaboration on alternative transportation. It also enables the program to fund brand new systems - such as a new trolley bus system to serve Gettysburg National Park to a new bicycle and pedestrian pathway that will allow visitors to access sites in the National Elk Refuge by bicycle and foot rather than by car.
The projects are located in 27 different States. There are projects in all major geographic regions - northeast, south, midwest, and west. The list includes projects in both rural and urban areas. Projects also vary by size from $50,000 planning studies to million dollar fleet purchases.
An example serves to illustrate the program's impact within just one of the Federal land management units receiving funding through the ATPPL program. The program is funding a new shuttle service from the San Joaquin Valley to the popular Sequoia National Park in California. The shuttle service will allow the thousands of visitors who pass through the valley on their way to the park to take public transportation rather than use private automobiles. Financial assistance through the program is also funding the lease of ten shuttle buses connecting key sites within Sequoia National Park – lodging, camping, food service facilities, popular day use trails, and features of the world-famous Giant Forest Sequoia grove. Shuttle ridership is estimated to reduce vehicular traffic by up to 925 cars daily, easing congestion in Level of Service D areas, and up to 47 percent within the popular Giant Forest/Generals Highway/Lodgepole area. An estimated 3,703 daily visitors (35% of the visitors) will use the Giant Forest shuttle, removing 50.3 tons of pollutants per day from the air in this air quality non-attainment area.
An additional 52 alternative transportation projects were awarded in 2008. A list of the projects funded is available on the program's website: www.fta.dot.gov/atppl.