


- Highway System Characteristics
- Roads by Ownership
- Roads by Ownership and Size of Area
- Highways by Purpose
- Review of Functional Classification Concepts
- Federal-Aid Highways
- System Characteristics for All Functional Classes
- Highway Travel
- National Highway System
- NHS System and Use Characteristics
- Interstate System
- Strategic Highway Network
- Deployment of Intelligent Transportation Systems
- Roads by Ownership
- Bridge System Characteristics
- Transit System Characteristics
- System History
- System Infrastructure
- Transit Agencies
- Transit Fleet
- Track, Stations, and Maintenance Facilities
- System Coverage: Urban Directional Route Miles
- System Capacity
- Ridership
- Rural Transit Systems (Section 5311 Providers)
- Transit System Characteristics for Americans With Disabilities and the Elderly
- Transit System Characteristics: Special Interests
- Comparison
Highway System Characteristics
The Nation's highway system is an extensive network of roadways that facilitates the movement of people and goods and supports the growth of the national economy by providing access to national and international markets. The system supports the defense of the Nation by providing the means for the rapid deployment of military forces and their support systems.
This section examines the characteristics of the Nation's roadways, addressing ownership, purpose, and usage. This information is presented for the National Highway System (NHS), including its Interstate highway system component, and for the overall highway system.
Subsequent sections within this chapter explore the characteristics of bridges and transit systems. These are followed by a section comparing key statistics from the highway, bridge, and transit sections with the information presented in the previous edition of this report.
Roads by Ownership
Ownership is largely split among the Federal, State, and local governments. Roads owned by these governments are considered "public." States own slightly over 20 percent of the Nation's public road mileage. The Federal government controls approximately 3.2 percent, primarily in National Parks and Forests, on Indian reservations, and on military bases. In 2006, approximately 76.5 percent of American roads were locally owned. In general, owners construct and maintain the roads with the aid of substantial financial assistance from other levels of government; some intergovernmental agreements authorize States to directly construct and maintain locally owned highways under certain conditions.
As Exhibit 2-1 demonstrates, the share of locally owned roads grew slightly over the past decade. The share of local public road mileage increased from 75.3 to 76.5 percent between 1997 and 2006. During that same period, the share of State-owned public road mileage remained mostly constant at 20.4 percent in 1997 and 20.3 percent in 2006.
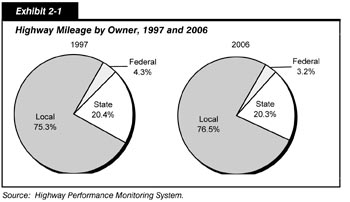
The share of Federally owned public road mileage declined from 4.3 percent in 1997 to 3.2 percent in 2006. This drop can be attributed to the decision not to count country forest development roads as public roads in 1998. As such, Federal, rural area road mileage decreased significantly between 1997 and 2000. Federal road mileage reached a peak in 1984, when 7 percent of all public roads were owned by the Federal government, and has steadily decreased since then. Much of the change occurred as the result of Federal land management agencies reclassifying some of their mileage from public to nonpublic status.
Roads by Ownership and Size of Area
All roads are designated as urban or rural. Urban areas have two subsets, the small urban areas that include populations of 5,000 to 49,999 and urbanized areas that include populations over 50,000. All other areas outside of a population's urban or small urban areas are designated rural.
In 2006, the highway system in the Nation was composed of over 4.03 million miles, compared with slightly less than 4 million miles in 2004. Highway mileage in urban areas has continued to increase in recent years, accompanied by a decrease in rural mileage. This trend is depicted in Exhibit 2-2, which shows that total mileage in small urban areas grew by an average annual rate of 0.9 percent between 1997 and 2006. In larger urbanized areas, 50,000 or more in population, the annual growth was 2.6 percent between 1997 and 2006. In rural areas, however, highway miles decreased at an average annual rate of 0.4 percent over the same time period.
| 1997 | 2000 | 2001 | 2002 | 2004 | 2006 | Annual Rate of Change 2006/1997 |
|
|---|---|---|---|---|---|---|---|
| Rural Areas (under 5,000 in population) | |||||||
| Federal | 167,368 | 116,707 | 119,291 | 117,775 | 118,866 | 123,393 | -3.3% |
| State | 661,473 | 663,763 | 665,095 | 664,814 | 683,789 | 669,678 | 0.1% |
| Local | 2,280,042 | 2,308,842 | 2,294,691 | 2,295,006 | 2,200,786 | 2,197,410 | -0.4% |
| Subtotal Rural Areas | 3,108,883 | 3,089,312 | 3,079,077 | 3,077,595 | 3,003,441 | 2,990,482 | -0.4% |
| Small Urban Areas (5,000–49,999 in population) | |||||||
| Federal | 482 | 458 | 662 | 980 | 723 | 831 | 4.6% |
| State | 27,455 | 27,596 | 27,347 | 27,639 | 30,719 | 36,893 | 1.3% |
| Local | 143,848 | 148,094 | 152,651 | 154,869 | 155,406 | 160,009 | 0.9% |
| Subtotal Small Urban Areas | 171,785 | 176,148 | 180,660 | 183,488 | 186,848 | 197,733 | 0.9% |
| Urbanized Areas (50,000 or more in population) | |||||||
| Federal | 980 | 1,026 | 1,573 | 1,840 | 2,847 | 4,157 | 17.4% |
| State | 83,428 | 83,944 | 83,134 | 84,135 | 101,881 | 113,160 | 3.4% |
| Local | 587,426 | 597,837 | 618,821 | 632,025 | 702,446 | 727,476 | 2.4% |
| Subtotal Urbanized Areas | 671,834 | 682,807 | 703,527 | 718,000 | 807,173 | 844,794 | 2.6% |
| Total Highway Miles | |||||||
| Federal | 168,830 | 118,191 | 121,525 | 120,595 | 122,436 | 128,381 | -3.0% |
| State | 772,356 | 775,303 | 775,576 | 776,588 | 816,388 | 819,731 | 0.7% |
| Local | 3,011,316 | 3,054,773 | 3,066,163 | 3,081,900 | 3,058,638 | 3,084,896 | 0.3% |
| Total | 3,952,502 | 3,948,267 | 3,963,264 | 3,979,083 | 3,997,462 | 4,033,008 | 0.2% |
| Percentage of Total Highway Miles | |||||||
| Federal | 4.3% | 3.0% | 3.0% | 3.0% | 3.1% | 3.2% | |
| State | 19.5% | 19.6% | 19.6% | 19.5% | 20.4% | 20.3% | |
| Local | 76.2% | 77.4% | 77.4% | 77.5% | 76.5% | 76.5% | |
| Total | 100.0% | 100.0% | 100.0% | 100.0% | 100.0% | 100.0% | |
Two factors contributed to the apparent increase in urban highway mileage, in addition to the construction of new roads. First, the ramifications of the redefinition of urban boundaries based on the 2000 decennial census continued to have an impact as States continue the work to establish new urban boundaries. This work resulted in an expansion of urban areas, and thus some mileage formerly classified as rural is now contained in urban areas. Second, greater focus has been placed on Federal agencies to provide a more complete reporting of Federally owned mileage. As a result, Federal mileage in urban areas increased significantly based on more accurate reporting of Department of Defense mileage on military bases within urban areas.
Highways by Purpose
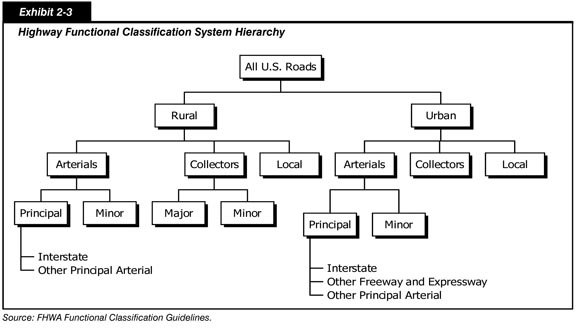
Another way to categorize roads is by purpose, which is commonly called functional classification. The Highway Functional Classification System (HFCS) is the basic organization used for most of this report. Exhibit 2-3 shows the hierarchy of the HFCS pictorially.
Review of Functional Classification Concepts
The functional classification system results from grouping highways by the type of service they provide and recognizing that each road or street doesn't stand alone, but is interconnected, as a network for travel between other roads. Each segment of road other than the lowest classification (local) should connect at both ends only to another segment functionally classified at an equal or higher level. Exceptions to this principle typically occur because of unusual geographic or traffic conditions (e.g., connections to international borders, coastal cities, waterports, and airports).
Roads serve two important functions: access and mobility. The better any individual segment is serving one of these functions, the worse it is at serving the other. Thus, routes on the Interstate Highway System allow a driver to travel long distances in a relatively short time, but do not allow the driver to enter each farm field or business along the way. Contrarily, a subdivision street allows a driver access to any address along its length, but does not allow the driver to travel at a high rate of speed and is frequently interrupted by intersections, often containing traffic control devices.
Arterials provide the highest level of mobility, at the highest speed, for long and uninterrupted travel. Arterials typically have higher design standards than other roads. They often include multiple lanes and have some degree of access control.
The rural arterial system provides interstate and intercounty service so that all developed areas are within a reasonable distance of an arterial highway. This system is broken down into principal and minor routes, of which principal roads are more significant. Virtually all urbanized areas with more than 50,000 people, and most urban areas with more than 25,000 people, are connected by rural principal arterial highways. The rural principal arterial system is divided into two subgroups: Interstate highways and other principal arterials.
Similarly, in urban areas the arterial system is divided into principal and minor arterials. The urban principal arterial system is the most important group; it includes (in descending order of importance) Interstate highways, other freeways and expressways, and other principal arterials. The urban principal arterial system serves major metropolitan centers, corridors with the highest traffic volume, and those with the longest trip lengths. It carries most trips entering and leaving metropolitan areas and provides continuity for rural arterials that cross urban boundaries. Urban minor arterial routes provide service for trips of moderate length at a lower level of mobility. They connect with the urban principal arterial system and other minor arterial routes.
Collectors provide a lower degree of mobility than arterials. They are designed for travel at lower speeds and for shorter distances. Generally, collectors are two-lane roads that collect travel from local roads and distribute it to the arterial system.
The rural collector system is stratified into two subsystems: major and minor collectors. Major collectors serve larger towns not accessed by higher-order roads, and important industrial or agricultural centers that generate significant traffic but are not served by arterials. Rural minor collectors are typically spaced at intervals consistent with population density to collect traffic from local roads and to ensure that a collector road serves all small urban areas.
In urban areas, the collector system provides traffic circulation within residential neighborhoods and commercial and industrial areas. Unlike arterials, collector roads may penetrate residential communities, distributing traffic from the arterials to the ultimate destination for many motorists. Urban collectors also channel traffic from local streets onto the arterial system. Unlike rural collectors, the urban collector system has no subclassification.
Local roads represent the largest element in the American public road system in terms of mileage. For rural and urban areas, all public road mileage below the collector system is considered local. Local roads provide basic access between residential and commercial properties, connecting with higher-order highways.
Federal-Aid Highways
The term "Federal-aid highways" is defined as highways on the Federal-aid highway systems and all other public roads not functionally classified as rural minor collector, rural local, or urban local. Federal-aid highway systems are defined as the Dwight D. Eisenhower National System of Interstate and Defense Highways (the "Interstate System") and the NHS, which includes the Interstate System as a subset.
| Are the 2006 HPMS data cited in this report fully consistent with those reported in the Highway Statistics 2006 publication? | |
|
No. As the HPMS data submitted by the States are reviewed for omissions or inconsistencies, revisions are submitted by the States. The statistics reflected in this report are based on the latest available 2006 HPMS data as of the date the chapters were written, and include revisions that were not reflected in the Highway Statistics 2006 publication.
The HPMS database is subject to further change on an ongoing basis if other States identify a need to revise their data. Such changes will be reflected in the next edition of the C&P report.
Additional information on HPMS is available at: https://www.fhwa.dot.gov/policyinformation/hpms.cfm.
|
|
While the system characteristics information presented in this chapter is available for all functional classes, some data pertaining to system conditions and performance presented in other chapters are not collected from States through the Highway Performance Monitoring System (HPMS) for roads classified as rural minor collector, rural local, or urban local. Consequently, some data presented in other chapters apply to Federal-aid highways only.
System Characteristics for All Functional Classes
Exhibit 2-4 summarizes the percentage of highway miles, lane miles, and vehicle miles traveled (VMT) for 2006 stratified by functional system and by population area. There are three categories for population areas: rural, small urban, and urbanized. Rural areas have populations of less than 5,000, small urban areas have populations between 5,000 and 49,999, and urbanized areas have populations of 50,000 or more. Urbanized areas are further divided into four segments, including small urbanized, 50,000 to 499,999 in population; medium urbanized, 500,000 to 999,999; large urbanized, 1 million to 3 million; and very large urbanized, over 3 million.
| Functional System | Miles | Lane Miles | VMT |
|---|---|---|---|
| Rural Areas (less than 5,000 in population) | |||
| Interstate | 0.8% | 1.5% | 8.4% |
| Other Principal Arterial | 2.4% | 2.9% | 7.5% |
| Minor Arterial | 3.4% | 3.3% | 5.3% |
| Major Collector | 10.4% | 10.0% | 6.3% |
| Minor Collector | 6.5% | 6.2% | 1.9% |
| Local | 50.8% | 48.4% | 4.3% |
| Subtotal Rural Areas | 74.2% | 72.3% | 33.7% |
| Small Urban Areas (5,000-49,999 in population) | |||
| Interstate | 0.1% | 0.1% | 1.5% |
| Other Freeway and Expressway | 0.0% | 0.1% | 0.7% |
| Other Principal Arterial | 0.3% | 0.5% | 2.2% |
| Minor Arterial | 0.5% | 0.6% | 1.7% |
| Collector | 0.6% | 0.6% | 0.9% |
| Local | 3.3% | 3.2% | 1.2% |
| Subtotal Small Urban Areas | 4.9% | 5.0% | 8.2% |
| Small Urbanized Areas (50,000–499,999 in population) | |||
| Interstate | 0.1% | 0.3% | 3.3% |
| Other Freeway and Expressway | 0.1% | 0.2% | 1.5% |
| Other Principal Arterial | 0.5% | 0.8% | 4.1% |
| Minor Arterial | 0.8% | 0.9% | 3.3% |
| Collector | 0.8% | 0.8% | 1.6% |
| Local | 5.5% | 5.2% | 2.5% |
| Subtotal Small Urbanized Areas | 7.7% | 8.2% | 16.2% |
| Medium Urbanized Areas (500,000-999,999 in population) | |||
| Interstate | 0.1% | 0.2% | 2.3% |
| Other Freeway and Expressway | 0.0% | 0.1% | 0.7% |
| Other Principal Arterial | 0.1% | 0.3% | 1.6% |
| Minor Arterial | 0.3% | 0.3% | 1.5% |
| Collector | 0.3% | 0.3% | 0.7% |
| Local | 2.0% | 1.9% | 1.2% |
| Subtotal Medium Urbanized Areas | 2.8% | 3.0% | 7.9% |
| Large Urbanized Areas (1 million–3 million in population) | |||
| Interstate | 0.1% | 0.2% | 3.9% |
| Other Freeway and Expressway | 0.1% | 0.1% | 1.7% |
| Other Principal Arterial | 0.2% | 0.4% | 2.6% |
| Minor Arterial | 0.4% | 0.6% | 2.4% |
| Collector | 0.4% | 0.5% | 1.1% |
| Local | 3.2% | 3.1% | 1.5% |
| Subtotal Large Urbanized Areas | 4.4% | 4.8% | 13.2% |
| Very Large Urbanized Areas (more than 3 million in population) | |||
| Interstate | 0.1% | 0.3% | 5.3% |
| Other Freeway and Expressway | 0.1% | 0.2% | 2.9% |
| Other Principal Arterial | 0.4% | 0.7% | 4.9% |
| Minor Arterial | 0.6% | 0.8% | 3.7% |
| Collector | 0.6% | 0.6% | 1.6% |
| Local | 4.3% | 4.1% | 2.4% |
| Subtotal Very Large Urbanized Areas | 6.0% | 6.6% | 20.8% |
| Total | 100.0% | 100.0% | 100.0% |
In 2006, 74.2 percent of the Nation's highway mileage and 72.3 percent of lane miles were located in rural areas. In contrast, only 33.7 percent of the VMT occurred in rural areas.
Small urban and small urbanized functional system areas made up only 4.9 percent and 7.7 percent of the highway mileage in the Nation, but carry 8.2 and 16.2 percent of the VMT. In 2006, medium urbanized areas consisted of 2.8 percent of the highway mileage, 3.0 percent of the lane miles, and 7.9 percent of the VMT.
In the Nation's most populated areas, the large urbanized and very large urbanized areas, highway mileage accounted for only 4.4 percent and 6.0 percent of the Nation's total highway mileage, but carried an overwhelming 13.2 and 20.8 percent of the Nation's VMT, respectively.
Exhibit 2-5 shows the total public road route mileage in the United States. In 2006, there were slightly more than 4.03 million route miles in the United States. Route miles are the length of a roadway. Approximately 74.2 percent of this mileage, or just over 2.99 million route miles, was in rural areas. The remaining 25.8 percent of route mileage, or approximately 1.04 million miles, was in small urban and urbanized communities.
| Functional System | 1997 | 2000 | 2002 | 2004 | 2006 | Annual Rate of Change 2006/1997 |
|---|---|---|---|---|---|---|
| Rural Areas (less than 5,000 in population) | ||||||
| Interstate | 32,919 | 33,152 | 33,107 | 31,477 | 30,615 | -0.8% |
| Other Principal Arterial | 98,358 | 99,023 | 98,945 | 95,998 | 95,009 | -0.4% |
| Minor Arterial | 137,791 | 137,863 | 137,855 | 135,683 | 135,589 | -0.2% |
| Major Collector | 433,500 | 433,926 | 431,754 | 420,293 | 419,289 | -0.4% |
| Minor Collector | 273,043 | 272,477 | 271,371 | 268,088 | 262,966 | -0.4% |
| Local | 2,141,111 | 2,115,293 | 2,106,725 | 2,051,902 | 2,046,796 | -0.5% |
| Subtotal Rural Areas | 3,116,722 | 3,091,733 | 3,079,757 | 3,003,441 | 2,990,264 | -0.5% |
| Small Urban Areas (5,000–49,999 in population) | ||||||
| Interstate | 1,744 | 1,794 | 1,808 | 2,088 | 2,211 | 2.7% |
| Other Freeway and Expressway | 1,253 | 1,219 | 1,227 | 1,218 | 1,207 | -0.4% |
| Other Principal Arterial | 12,477 | 12,474 | 12,590 | 13,532 | 14,048 | 1.3% |
| Minor Arterial | 19,635 | 19,800 | 19,926 | 19,956 | 21,245 | 0.9% |
| Collector | 21,338 | 21,535 | 21,813 | 23,706 | 25,209 | 1.9% |
| Local | 115,420 | 119,342 | 126,140 | 126,348 | 133,716 | 1.6% |
| Subtotal Small Urban Areas | 171,867 | 176,163 | 183,503 | 186,848 | 197,636 | 1.6% |
| Urbanized Areas (50,000 or more in population) | ||||||
| Interstate | 11,651 | 11,729 | 11,832 | 13,270 | 14,066 | 2.1% |
| Other Freeway and Expressway | 7,864 | 7,977 | 8,150 | 9,087 | 9,610 | 2.3% |
| Other Principal Arterial | 40,993 | 41,084 | 41,090 | 46,556 | 49,132 | 2.0% |
| Minor Arterial | 70,050 | 70,502 | 70,996 | 78,491 | 82,433 | 1.8% |
| Collector | 67,312 | 67,263 | 68,033 | 79,680 | 84,430 | 2.5% |
| Local | 474,044 | 484,650 | 518,309 | 580,088 | 604,440 | 2.7% |
| Subtotal Urbanized Areas | 671,914 | 683,205 | 718,409 | 807,173 | 844,111 | 2.6% |
| Total Highway Route Miles | 3,960,503 | 3,951,101 | 3,981,670 | 3,997,462 | 4,032,011 | 0.2% |
Overall route mileage increased by an average annual rate of about 0.2 percent between 1997 and 2006. On an average annual basis, mileage decreased by 0.5 percent in rural America and increased by 1.6 percent in small urban communities and by 2.6 percent in urbanized areas from 1997 to 2006.
Between 2004 and 2006, route mileage decreased in rural areas by 13,177 miles. Route mileage in small urban and urbanized areas during the same period increased by 10,788 miles and 36,938 miles, respectively. It must be noted that the results of the 2000 census are still impacting the reporting of the distribution of mileage, lane miles, and VMT in all population areas (rural, small urban, and urbanized). The adjustment of the boundaries for these areas, rather than the construction of new roads, is the primary reason for the changes in the reported data.
Exhibit 2-6 shows the number of highway lane miles by functional system and by population area. Highway lane miles are the length of the roadway multiplied by the number of lanes on that roadway section. In 2006, there were 8.46 million lane miles in the United States. Lane miles have grown at an average annual rate of about 0.2 percent since 1997, mostly in urban areas (lane miles in rural areas decreased overall by 0.5 percent per year during the same time period). Between 1997 and 2006, lane miles grew annually by 1.6 percent in small urban areas and by 2.6 percent in urbanized areas.
| Functional System | 1997 | 2000 | 2002 | 2004 | 2006 | Annual Rate of Change 2006/1997 |
|---|---|---|---|---|---|---|
| Rural Areas (less than 5,000 in population) | ||||||
| Interstate | 133,573 | 135,000 | 135,032 | 128,012 | 124,506 | -0.8% |
| Other Principal Arterial | 248,921 | 253,586 | 256,458 | 249,480 | 248,334 | 0.0% |
| Minor Arterial | 288,872 | 287,750 | 288,391 | 283,173 | 282,397 | -0.3% |
| Major Collector | 875,393 | 872,672 | 868,977 | 845,513 | 843,262 | -0.4% |
| Minor Collector | 546,085 | 544,954 | 542,739 | 536,177 | 525,932 | -0.4% |
| Local | 4,282,222 | 4,230,588 | 4,213,448 | 4,103,804 | 4,093,592 | -0.5% |
| Subtotal Rural Areas | 6,375,066 | 6,324,550 | 6,305,044 | 6,146,159 | 6,118,023 | -0.5% |
| Small Urban Areas (5,000–49,999 in population) | ||||||
| Interstate | 7,365 | 7,626 | 7,776 | 8,890 | 9,309 | 2.6% |
| Other Freeway and Expressway | 4,747 | 4,627 | 4,685 | 4,754 | 4,714 | -0.1% |
| Other Principal Arterial | 37,618 | 37,806 | 38,275 | 41,015 | 42,896 | 1.5% |
| Minor Arterial | 44,982 | 45,212 | 45,682 | 45,335 | 48,380 | 0.8% |
| Collector | 44,216 | 44,525 | 45,095 | 48,977 | 51,985 | 1.8% |
| Local | 230,839 | 238,684 | 252,279 | 252,697 | 267,433 | 1.6% |
| Subtotal Small Urban Areas | 369,767 | 378,482 | 393,793 | 401,667 | 424,717 | 1.6% |
| Urbanized Areas (50,000 or more in population) | ||||||
| Interstate | 65,603 | 67,020 | 68,088 | 75,127 | 79,727 | 2.2% |
| Other Freeway and Expressway | 36,655 | 37,428 | 38,782 | 43,016 | 45,491 | 2.4% |
| Other Principal Arterial | 146,585 | 149,224 | 150,250 | 169,491 | 178,726 | 2.2% |
| Minor Arterial | 185,273 | 184,199 | 187,512 | 205,434 | 221,532 | 2.0% |
| Collector | 145,927 | 145,313 | 147,020 | 171,201 | 183,255 | 2.6% |
| Local | 948,087 | 969,300 | 1,036,619 | 1,160,175 | 1,208,881 | 2.7% |
| Subtotal Urbanized Areas | 1,528,130 | 1,552,484 | 1,628,271 | 1,824,444 | 1,917,612 | 2.6% |
| Total Highway Lane Miles | 8,272,963 | 8,255,516 | 8,327,108 | 8,372,270 | 8,460,352 | 0.2% |
Highway Travel
This section describes highway infrastructure use, which is typically defined by VMT. During the last decade, Americans traveled at record levels, a phenomenon prompted by the booming economy, population growth, and other socioeconomic factors. As Exhibit 2-7 shows, VMT grew at an average annual rate of 1.9 percent between 1997 and 2006. By the end of that period, Americans were traveling just over 3 trillion vehicle miles annually. Slightly over 1 trillion vehicle miles were on rural highways, and almost 2.0 trillion vehicle miles were in small urban and urbanized areas.
| Functional System | (Millions of Miles) 1997 |
(Millions of Miles) 2000 |
(Millions of Miles) 2002 |
(Millions of Miles) 2004 |
(Millions of Miles) 2006 |
Annual Rate of Change 2006/1997 |
|---|---|---|---|---|---|---|
| Rural Areas (less than 5,000 in population) | ||||||
| Interstate | 241,451 | 269,533 | 281,461 | 267,397 | 258,324 | 0.8% |
| Other Principal Arterial | 229,133 | 249,177 | 258,009 | 241,282 | 232,224 | 0.1% |
| Minor Arterial | 164,129 | 172,772 | 177,139 | 169,168 | 162,889 | -0.1% |
| Major Collector | 202,588 | 210,595 | 214,463 | 200,926 | 193,423 | -0.5% |
| Minor Collector | 52,809 | 58,183 | 62,144 | 60,278 | 58,229 | 1.1% |
| Local | 113,248 | 127,560 | 139,892 | 132,474 | 133,378 | 1.8% |
| Subtotal Rural Areas | 1,003,358 | 1,087,820 | 1,133,107 | 1,071,524 | 1,038,467 | 0.4% |
| Small Urban Areas (5,000–49,999 in population) | ||||||
| Interstate | 18,393 | 21,059 | 22,578 | 25,784 | 26,448 | 4.1% |
| Other Freeway and Expressway | 9,251 | 9,892 | 10,442 | 10,245 | 9,753 | 0.6% |
| Other Principal Arterial | 55,359 | 58,170 | 59,490 | 61,426 | 63,172 | 1.5% |
| Minor Arterial | 40,845 | 43,035 | 44,566 | 41,961 | 44,643 | 1.0% |
| Collector | 19,749 | 20,412 | 21,492 | 21,761 | 23,915 | 2.1% |
| Local | 30,368 | 33,277 | 34,241 | 33,439 | 34,759 | 1.5% |
| Subtotal Small Urban Areas | 173,965 | 185,845 | 192,808 | 194,616 | 202,691 | 1.7% |
| Urbanized Areas (50,000 or more in population) | ||||||
| Interstate | 346,376 | 376,116 | 389,903 | 433,982 | 456,229 | 3.1% |
| Other Freeway and Expressway | 151,231 | 168,293 | 180,199 | 198,840 | 208,658 | 3.6% |
| Other Principal Arterial | 332,448 | 343,186 | 351,436 | 392,442 | 407,250 | 2.3% |
| Minor Arterial | 263,296 | 283,854 | 297,393 | 323,846 | 335,426 | 2.7% |
| Collector | 111,874 | 116,596 | 122,129 | 142,569 | 151,600 | 3.4% |
| Local | 176,268 | 202,774 | 207,480 | 224,178 | 233,635 | 3.2% |
| Subtotal Urbanized Areas | 1,381,495 | 1,490,819 | 1,548,540 | 1,715,857 | 1,792,799 | 2.9% |
| Total VMT | 2,558,818 | 2,764,484 | 2,874,455 | 2,981,998 | 3,033,957 | 1.9% |
| Total PMT | 4,089,366 | 4,390,076 | 4,667,038 | 4,832,394 | 4,933,689 | 2.1% |
various years.
While highway mileage is mostly rural, a majority of highway travel (approximately 65.7 percent) occurred in urban areas in 2006. The average annual rate of change for rural travel was 0.4 percent between 1997 and 2006. For the same period, the average annual rate of change in small urban areas was 1.7 percent and in urbanized areas was 2.9 percent. Again, it must be noted, that portions of these increases are the result of the expansion of the boundaries of these areas due to the results of the 2000 census and the inclusion of travel that was previously recorded in the rural category.
Exhibit 2-7 shows from 2004 to 2006, in rural areas, travel grew slightly on local roadways but the highest VMT in rural areas was still on the Interstate System. During the same period, the highest growth in travel in small urban areas was on collectors with an increase of 9.9 percent between 2004 and 2006. The greatest amount of travel was on other principal arterials in small urban areas. For urbanized areas, the greatest percentage of growth was on collectors with an increase of 6.3 percent from 2004 to 2006, followed by Interstates, 5.1 percent, and other freeways and expressways, 4.9 percent. The most travel in urbanized areas was on the Interstate System.
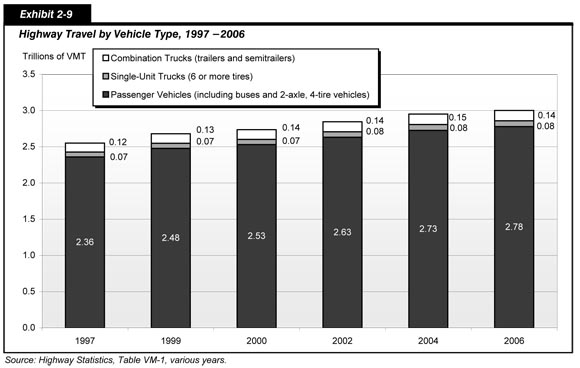
Exhibits 2-9 and 2-10 expand on the information in Exhibit 2-7. They depict highway travel by functional classification and vehicle type. Three types of vehicles are identified: passenger vehicles which include buses and light trucks (2-axle, 4-tire models); single-unit trucks having 6 or more tires; and combination trucks, including trailers and semitrailers. The totals in Exhibit 2-9 include all vehicles, whereas those in Exhibit 2-10 exclude motorcycles.
| What has happened to highway travel since 2006? | |||||||||||||||||||||||||||||||||||||||
|
The December 2007 Traffic Volume Trends (TVT) report showed a decline of 0.4 percent in highway travel between 2006 and 2008. Travel dropped from 3,014.0 billion vehicle miles of travel (VMT) in 2006 to 3,003.2 billion VMT in 2007.
The decline in VMT has continued in 2008. The June 2008 TVT report describes the percentage change in cumulative monthly travel for all highway systems for the first half of 2007 compared with the first half of 2008. This report shows a 2.8 percent decline.
Exhibit 2-8 , which is shown below, compares the traffic volume for different elements of the road network at comparable points in 2006 and 2008. The greatest decline occurred on lower-level rural roads
For additional information on ongoing traffic trends, visit https://www.fhwa.dot.gov/ohim/tvtw/tvtpage.cfm.
* Preliminary data.
Source: Travel Monitoring Analysis System (TMAS).
|
|||||||||||||||||||||||||||||||||||||||
| (Millions of Miles) | Annual Rate of Change | ||||||
|---|---|---|---|---|---|---|---|
| Functional System Vehicle Type |
1997 | 2000 | 2002 | 2004 | 2006 | 2006/2004 | 2006/1997 |
| Rural Interstate | |||||||
| PV | 189,869 | 214,532 | 224,375 | 211,369 | 205,103 | -1.5% | 0.9% |
| SU | 7,671 | 8,236 | 8,745 | 8,548 | 7,674 | -5.3% | 0.0% |
| Combo | 41,665 | 44,248 | 45,633 | 45,754 | 43,711 | -2.3% | 0.5% |
| Other Arterial | |||||||
| PV | 351,313 | 377,270 | 389,758 | 365,951 | 353,245 | -1.8% | 0.1% |
| SU | 13,688 | 13,644 | 14,606 | 14,771 | 13,835 | -3.2% | 0.1% |
| Combo | 25,505 | 28,005 | 27,818 | 27,817 | 25,791 | -3.7% | 0.1% |
| Other Rural | |||||||
| PV | 341,323 | 366,433 | 383,724 | 361,080 | 353,886 | -1.0% | 0.4% |
| SU | 13,698 | 13,722 | 14,963 | 15,611 | 15,084 | -1.7% | 1.1% |
| Combo | 12,471 | 12,555 | 14,090 | 15,035 | 13,990 | -3.5% | 1.3% |
| Total Rural | |||||||
| PV | 882,505 | 958,235 | 997,857 | 938,400 | 912,234 | -1.4% | 0.4% |
| SU | 35,057 | 35,602 | 38,314 | 38,930 | 36,593 | -3.0% | 0.5% |
| Combo | 79,641 | 84,808 | 87,541 | 88,606 | 83,492 | -2.9% | 0.5% |
| Urban Interstate | |||||||
| PV | 331,343 | 359,592 | 373,957 | 415,254 | 435,043 | 2.4% | 3.1% |
| SU | 7,906 | 8,716 | 9,106 | 10,512 | 10,301 | -1.0% | 3.0% |
| Combo | 20,643 | 23,465 | 23,887 | 26,481 | 29,430 | 5.4% | 4.0% |
| Other Urban | |||||||
| PV | 1,146,289 | 1,213,109 | 1,259,859 | 1,372,307 | 1,431,401 | 2.1% | 2.5% |
| SU | 23,930 | 26,182 | 28,467 | 31,665 | 33,436 | 2.8% | 3.8% |
| Combo | 24,300 | 26,747 | 27,215 | 30,310 | 29,784 | -0.9% | 2.3% |
| Total Urban | |||||||
| PV | 1,477,632 | 1,572,701 | 1,633,816 | 1,787,561 | 1,866,444 | 2.2% | 2.6% |
| SU | 31,836 | 34,898 | 37,573 | 42,177 | 43,737 | 1.8% | 3.6% |
| Combo | 44,943 | 50,212 | 51,102 | 56,791 | 59,214 | 2.1% | 3.1% |
| Total | |||||||
| PV | 2,360,137 | 2,530,936 | 2,631,673 | 2,725,961 | 2,778,678 | 1.0% | 1.8% |
| SU | 66,893 | 70,500 | 75,887 | 81,107 | 80,330 | -0.5% | 2.1% |
| Combo | 124,584 | 135,020 | 138,643 | 145,397 | 142,706 | -0.9% | 1.5% |
From 1997 to 2006, travel among all vehicle types and on all functional classifications grew fastest among single-unit trucks, at an average annual rate of 2.1 percent. Passenger vehicle travel grew by 1.8 percent per year, and combination truck traffic grew by 1.5 percent per year over the same period. While vehicle travel by single-unit and combination trucks is small compared with passenger vehicle travel across all highways, trucks account for 12.5 percent of vehicle travel on the Interstate System and 20 percent on rural Interstates.
National Highway System
The NHS is an important portion of the total highway system. It includes the Interstate System as well as other routes most critical to national defense, mobility, and commerce. The NHS consisted of 163,462 route miles and approximately 566,000 lane miles in 2006.
With the Interstate System essentially complete, the Intermodal Surface Transportation Efficiency Act of 1991 (ISTEA) revised the Federal-aid highway program for the post-Interstate era. The legislation authorized designation of an NHS that would focus Federal resources on roads that are the most important to interstate travel, economic expansion, and national defense; that connect with other modes of transportation; and that are essential to the country's role in the international marketplace.
The legislation required the U.S. Department of Transportation (DOT) to submit a list and description of proposed NHS routes. This list was submitted in December 1993. Based on the Department's proposals, the National Highway System Designation Act of 1995 identified a 160,955-mile network. The Transportation Equity Act for the 21st Century (TEA-21) authorized a maximum mileage on the NHS of 178,250.
The NHS was designed to be a dynamic system able to change in response to future travel and trade demands. The DOT may approve modifications to the NHS without congressional approval. States must cooperate with local and regional officials in proposing modifications. In metropolitan areas, local and regional officials must act through metropolitan planning organizations and the State transportation department when proposing modifications. A number of such modifications are proposed and approved each year.
The NHS has five components. The first, the Interstate System, is the core of the NHS and includes the most traveled routes. The second component includes selected other principal arterials deemed most important for commerce and trade. The third is the Strategic Highway Network (STRAHNET), which consists of highways important to military mobilization. The fourth is the system of STRAHNET connectors that provide access between major military installations and routes that are part of STRAHNET. The final component consists of intermodal connectors, which were not included in the 1995 Act but are eligible for NHS funds. These roads provide access between major intermodal passenger and freight facilities and the other four subsystems making up the NHS.
While not one of the components of the NHS, the National Network is a system with significant overlap with the NHS. The National Network is 210,000 miles of highways that provides geographic access for interstate commerce and include highways that are not included on the NHS. The National Network primarily serves trucks, while the 163,462-mile NHS primarily serves passenger vehicles and may even exclude trucks in some sections. Additional information on the National Network can be found in Chapter 13, Freight Transportation.
The NHS was not envisioned as a new Interstate construction program. The non-Interstate portions of the NHS will be upgraded to the standards appropriate for improved safety and operational efficiency. In ISTEA and subsequent legislation, Congress authorized funds for this and other purposes aimed at preserving and improving the NHS.
NHS System and Use Characteristics
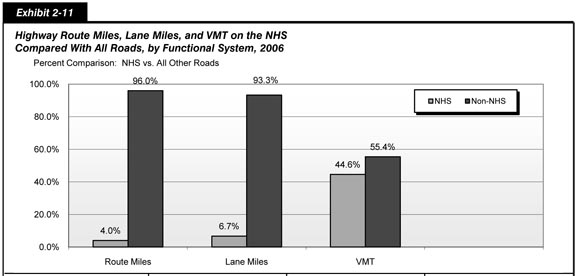
Exhibit 2-11 summarizes NHS route miles, lane miles, and VMT for the NHS components. The NHS is overwhelmingly concentrated on higher functional systems. All Interstates are part of the NHS, as are 83.5 percent of rural other principal arterials, 87.2 percent of urban other freeways and expressways, and 36.3 percent of urban other principal arterials. The share of minor arterials, collectors, and local roads on the NHS is relatively small. There are currently 163,462 route miles on the NHS, excluding some sections not yet open to traffic.
| Route Miles | Lane Miles | VMT (Millions) | ||||
|---|---|---|---|---|---|---|
| Total on NHS | Percent of Functional System | Total on NHS | Percent of Functional System | Total on NHS | Percent of Functional System | |
| Rural NHS | ||||||
| Interstate | 30,617 | 100.0% | 124,503 | 100.0% | 258,326 | 100.0% |
| Other Principal Arterial | 79,349 | 83.5% | 212,753 | 85.7% | 203,235 | 87.5% |
| Minor Arterial | 2,233 | 1.6% | 5,269 | 1.9% | 4,583 | 2.8% |
| Major Collector | 734 | 0.2% | 1,621 | 0.2% | 1,319 | 0.7% |
| Minor Collector | 21 | 0.0% | 45 | 0.0% | 10 | 0.0% |
| Local | 37 | 0.0% | 76 | 0.0% | 37 | 0.0% |
| Subtotal Rural NHS | 112,991 | 3.8% | 344,146 | 5.6% | 467,463 | 45.0% |
| Urban NHS | ||||||
| Interstate | 16,276 | 100.0% | 89,035 | 100.0% | 482,611 | 100.0% |
| Other Freeway and Expressway | 9,426 | 87.2% | 44,516 | 88.7% | 201,663 | 92.4% |
| Other Principal Arterial | 22,928 | 36.3% | 84,840 | 38.3% | 193,583 | 41.1% |
| Minor Arterial | 1,342 | 1.3% | 4,161 | 1.6% | 6,748 | 1.8% |
| Collector | 378 | 0.3% | 1,014 | 0.4% | 1,452 | 0.8% |
| Local | 121 | 0.0% | 241 | 0.0% | 238 | 0.0% |
| Subtotal Urban NHS | 50,471 | 4.8% | 223,566 | 9.5% | 886,295 | 44.4% |
| Total NHS | 163,462 | 4.0% | 567,712 | 6.7% | 1,353,758 | 44.6% |
In 2006, while only 4.0 percent of the Nation's total route mileage and 6.7 percent of the total lane miles are on the NHS, these roads carried 44.6 percent of VMT. This represents a slight increase since 1997, when 43.5 percent of total VMT were on the NHS.
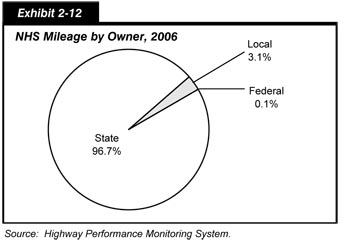
Exhibit 2-12 describes the ownership of NHS mileage. Approximately 96.7 percent of route miles were State-owned in 2006. Only 3.1 percent were locally owned, and the Federal government owned the remaining 0.1 percent. By comparison, 20.3 percent of all route miles in the United States were State-owned, 76.5 percent were locally owned, and the Federal government owned 3.2 percent. Since the NHS is concentrated on higher functional systems, the percentage of locally owned NHS routes is relatively small.
Interstate System
The Interstate System dates to the late 1930s when the United States was completing its first "Interstate System," a two-lane paved network of highways generally designated by U.S. highway numbers (such as U.S. 1 and U.S. 66). Its safety and operational deficiencies for the growing traffic volumes of the day prompted consideration of the next stage of highway development.
In a 1939 report to Congress titled Toll Roads and Free Roads, the U.S. Bureau of Public Roads (BPR) described the need for a toll-free network of express highways. A 1944 report to Congress, Interregional Highways, prompted Congress to incorporate the concept into the Federal-Aid Highway Act of 1944. The legislation authorized designation of a 40,000-mile "National System of Interstate Highways" that would connect principal metropolitan areas, cities, and industrial centers; serve the national defense; and provide suitable connections with Canada and Mexico.
On August 2, 1947, the Public Roads Administration designated the first 37,681 miles of principal highways, including 2,882 miles carrying the routes through urban areas. The agency reserved the remaining 2,319 miles for urban circumferential and distributing routes that would be designated at a later date (1955 as it turned out). As the announcement of the designation pointed out:
Although the new interstate system follows, in general, the principal routes in the present Federal-aid system, it may be necessary in many instances to relocate existing highways or build alternate routes for express traffic in order to meet essential standards of width, grade, alignment, and control of access.
Although the 1944 Act was a major step forward, it did not authorize special funds for the Interstate System. The assumption was that the State highway agencies would use their annual apportionment of Federal-aid highway funds on Interstate projects. Although some progress was made, the pace was slow and the lack of progress frustrating.
President Eisenhower took office on January 20, 1953, with a keen understanding of the value of roads. As a young officer in 1919, he had been an observer on the U.S. Army's first transcontinental convoy—a 2-month trek from Washington, D.C., to San Francisco over roads that often challenged the sturdiest military vehicles. During and after World War II, he had seen the autobahn express highway network Germany had built in the 1930s and understood the network's military and civilian value. As he would say in his memoirs, "The old convoy had started me thinking about good, two-lane highways, but Germany had made me see the wisdom of broader ribbons across the land."
With the President's strong support, the Federal-Aid Highway Act of 1956 declared that the completion of the "National System of Interstate and Defense Highways" was essential to the national interest. It made a national commitment to Interstate completion within the Federal-State partnership of the Federal-aid highway program, with the State responsible for construction to approved standards. In addition, the legislation authorized Interstate Construction funds for what was expected to be the entire construction period (through FY 1969, with completion in 1971). Most importantly, the 1956 Act resolved the challenging issue of how to pay for construction by establishing the Highway Trust Fund to ensure that revenue from highway user taxes, such as the gas tax, would be dedicated to the Interstate System and other Federal-aid highway and bridge projects.
President Eisenhower wrote in his memoirs that "more than any single action by the government since the end of the war, this one would change the face of America. Its impact on the American economy . . . was beyond calculation." A look back on the 50th anniversary of the 1956 Act reveals that his prediction proved true. Although the Interstate System accounts for slightly more than 1 percent of the Nation's total public road mileage, it carries over 24 percent of all highway travel. The Dwight D. Eisenhower National System of Interstate and Defense Highways, as it is now called, accelerated interstate and regional commerce, enhanced the country's competitiveness in international markets, increased personal mobility, facilitated military transportation, and accelerated metropolitan development throughout the United States.
Interstate System Characteristics
The route miles of the Interstate System in the United States increased from 46,314 in 1997 to 46,835 in 2004 and to 46,892 in 2006. About 65.3 percent (30,615 route miles) were in rural areas, 4.7 percent (2,211 route miles) were in small urban areas, and 30.0 percent (14,066 route miles) were in urbanized areas. A breakdown of Interstate route miles is available in Exhibit 2-5.
The number of Interstate route miles in rural areas declined from 31,477 in 2004 to 30,615 in 2006. During the same period, the number of Interstate System miles increased from 2,088 to 2,211 in small urban areas and from 13,270 to 14,066 in urbanized areas. Rural Interstate route miles declined due to the expansion of small urban and urbanized boundaries resulting from the 2000 decennial census, causing some formerly rural areas to be reclassified as urban. Note that some States are typically faster than others in modifying their data reporting to correspond to new decennial census information; therefore, while many of the States have submitted modified information to HPMS, some changes may still be forthcoming. The next edition of the C&P report may still show some minor additional rural Interstate mileage having been reclassified as urban.
Between 1997 and 2006, rural Interstate route miles decreased by approximately 0.8 percent annually, small urban Interstate route miles increased 2.7 percent annually, and Interstate route miles in urbanized areas increased 2.1 percent annually. The annual growth rate of Interstate route miles from 1997 to 2006 is approximately 0.14 percent, which is slightly less than the overall annual growth rate for all roads during that time period.
The total number of Interstate lane miles is shown in Exhibit 2-6. In 2006, there were 213,542 lane miles of Interstates in the United States. Approximately 58.3 percent were in rural communities, 4.4 percent were in small urban areas, and slightly less than 37.3 percent were in urbanized areas.
Interstate Use Characteristics
VMT on Interstate highways for 1997 to 2006 are shown in Exhibit 2-7. In 2006, Americans traveled more than 258 billion vehicle miles on rural Interstates, 26.4 billion vehicle miles on small urban Interstates, and in excess of 456 billion vehicle miles on urban Interstates. Interstate travel continued to represent the fastest-growing portion of VMT between 1997 and 2006. Interstate VMT grew at an average annual rate of approximately 2.3 percent during this period, while VMT on all roads grew by about 1.9 percent annually.
In Exhibit 2-13, Interstate highway travel by vehicle type is shown for 1997 to 2006. In 2006, 80.0 percent of travel on rural Interstates was by passenger vehicle; 3.0 percent was by single-unit truck; and 17.0 percent was by combination truck. About 91.6 percent of urban Interstate travel was by passenger vehicle; 2.2 percent was by single-unit truck; and 6.2 percent was by combination truck. By contrast, passenger vehicle travel represented approximately 92.6 percent of travel on all roads in 2006. Single-unit truck travel was just above 2.7 percent of travel, and combination truck travel represented slightly less than 4.8 percent.
| (Millions of VMT) | Annual Rate of Change 2006/2004 | Annual Rate of Change 2006/1997 | ||||||||||||
|---|---|---|---|---|---|---|---|---|---|---|---|---|---|---|
| 1997 | 1999 | 2000 | 2002 | 2004 | 2006 | |||||||||
| Rural | VMT | % | VMT | % | VMT | % | VMT | % | VMT | % | VMT | % | % | % |
| Interstate | ||||||||||||||
| PV | 189,869 | 79.4% | 208,017 | 80.3% | 214,532 | 80.3% | 224,375 | 80.5% | 211,369 | 79.6% | 205,103 | 80.0% | -1.5% | 0.9% |
| SU | 7,671 | 3.2% | 8,073 | 3.1% | 8,236 | 3.1% | 8,745 | 3.1% | 8,548 | 3.2% | 7,674 | 3.0% | -5.3% | 0.0% |
| Combo | 41,665 | 17.4% | 42,976 | 16.6% | 44,248 | 16.6% | 45,633 | 16.4% | 45,754 | 17.2% | 43,711 | 17.0% | -2.3% | 0.5% |
| Urban | ||||||||||||||
| Interstate | ||||||||||||||
| PV | 331,343 | 92.1% | 349,283 | 91.5% | 359,592 | 91.8% | 373,957 | 91.9% | 415,254 | 91.8% | 435,043 | 91.6% | 2.4% | 3.1% |
| SU | 7,906 | 2.2% | 8,494 | 2.2% | 8,716 | 2.2% | 9,106 | 2.2% | 10,512 | 2.3% | 10,301 | 2.2% | -1.0% | 3.0% |
| Combo | 20,643 | 5.7% | 23,792 | 6.2% | 23,465 | 6.0% | 23,887 | 5.9% | 26,481 | 5.9% | 29,430 | 6.2% | 5.4% | 4.0% |
| All Roads | ||||||||||||||
| PV | 2,360,137 | 92.5% | 2,477,784 | 92.4% | 2,530,936 | 92.5% | 2,631,673 | 92.5% | 2,725,961 | 92.3% | 2,778,678 | 92.6% | 1.0% | 1.8% |
| SU | 66,893 | 2.6% | 70,304 | 2.6% | 70,500 | 2.6% | 75,887 | 2.7% | 81,107 | 2.7% | 80,330 | 2.7% | -0.5% | 2.1% |
| Combo | 124,584 | 4.9% | 132,384 | 4.9% | 135,020 | 4.9% | 138,643 | 4.9% | 145,398 | 4.9% | 142,706 | 4.8% | -0.9% | 1.5% |
From 1997 to 2006, combination truck travel grew by 4.0 percent annually on urban Interstates, single-unit truck travel grew by 3 percent, and passenger vehicle travel grew by 3.1 percent. However, from 2004 to 2006 on rural Interstates, combination truck travel decreased by an average annual rate of 2.3 percent, single-unit truck travel decreased by an average annual rate of 5.3 percent, and passenger vehicle travel decreased by an average annual rate of 1.5 percent.
Strategic Highway Network
Strategic Highway Network (STRAHNET) is a network of highways critical to the Department of Defense's (DoD) domestic operations providing access, continuity, and emergency transportation for defense purposes. STRAHNET Connectors are roads and highways that provide links or connections between major military installations and the STRAHNET highways. All STRAHNET highways and STRAHNET Connectors are part of the NHS.
The STRAHNET is a 61,976-mile system of roads deemed necessary for moving personnel and equipment during a mobilization or deployment and the peacetime movement of heavy armor, fuel, ammunition, repair parts, food, and other commodities to support U.S. military operations. Exhibit 2-14 identifies STRAHNET mileage by functional class. Even though DoD primarily deploys heavy equipment by rail, highways play a critical role. Links to over 200 important military installations and ports are provided by approximately 1,700 miles of roadways designated as STRAHNET Connectors.
| Miles | |
|---|---|
| Rural | |
| Interstate | 30,620 |
| Other Principal Arterial | 10,165 |
| Minor Arterial | 707 |
| Major Collector | 197 |
| Minor Collector | 1 |
| Local | 18 |
| Subtotal Rural | 41,708 |
| Urban | |
| Interstate | 16,278 |
| Other Freeway and Expressway | 1,571 |
| Other Principal Arterial | 2,161 |
| Minor Arterial | 198 |
| Collector | 48 |
| Local | 12 |
| Subtotal Urban | 20,268 |
| Total | 61,976 |
The Surface Deployment and Distribution Command Transportation Engineering Agency (SDDCTEA) is the DoD-designated agent for public highway matters, including STRAHNET and STRAHNET Connectors. The SDDCTEA identified STRAHNET and the Connector routes in coordination with the FHWA, the State transportation departments, the military Services and installations, and the ports. Together, STRAHNET and the Connectors define the total minimum defense public highway network needed to support a defense emergency.
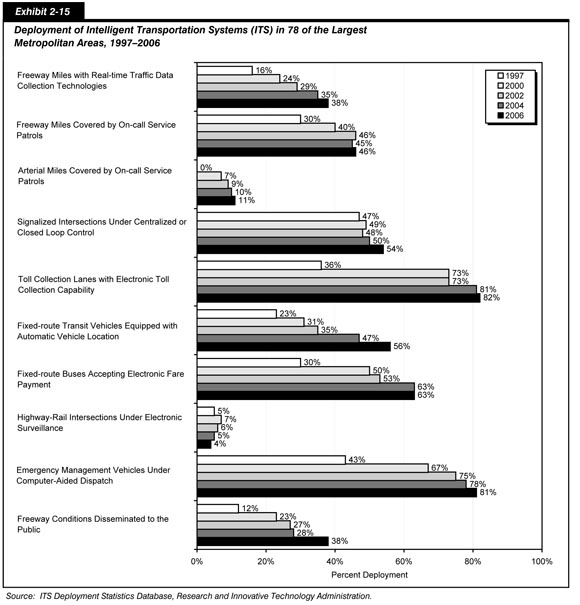
Deployment of Intelligent Transportation Systems
All of the previous exhibits in this chapter represent a traditional look at the highway system. This section looks at the extent of Intelligent Transportation Systems (ITS) deployment and integration in metropolitan areas. The Intelligent Transportation Systems Joint Program Office of the U.S. DOT conducts an annual survey on the deployment of ITS devices in 78 of the largest metropolitan areas in the United States. As shown in Exhibit 2-15, results from this survey indicate that freeway deployment has advanced steadily, with real-time data collection sensors deployed on nearly 38 percent of the total freeway mileage and on-call service patrols covering almost 46 percent of the freeway mileage. Arterial deployment of service patrols lags behind that seen on freeways, but is advancing steadily. Traffic control systems have also improved, with over half of them now controlled centrally or through closed loop systems. Transit agencies have advanced rapidly in deployment of ITS, with more than half of all the buses equipped with automatic vehicle location capability by 2006. The dissemination of freeway information to the public showed a particularly large increase between 2004 and 2006. Other well-established ITS technologies include electronic fare payment for transit vehicles, computer-aided dispatch on emergency vehicles, and electronic toll collection.
Bridge System Characteristics
The National Bridge Inventory (NBI) contains nearly 700,000 records, which describe either the features carried by a bridge, termed as "on" records, or the features crossed by the structure, termed as "under" records. Separating the on records from the under records reveals that there were 597,562 bridges over 6.1 meters (20 feet) in total length located on public roads in the United States in 2006. As discussed in Chapter 3, the National Bridge Inspection Standards establishes the frequency of inspection of bridges meeting the definition; as part of these inspections, information is collected concerning both the characteristics and physical conditions of the structures.
| What were the recommendations of the Blue Ribbon Panel on Bridge and Tunnel Security? | |
|
In 2003, a Blue Ribbon Panel on Bridge and Tunnel Security—set up by the Federal Highway Administration (FHWA) and the American Association of State Highway and Transportation Officials (AASHTO)—developed seven overarching recommendations to improve bridge and tunnel security. These recommendations fall into three areas: institutional, fiscal, and technical.
Institutional Recommendations. The panel recommended greater collaboration between the FHWA, AASHTO, Transportation Security Administration (TSA), and other highway stakeholders. The panel also endorsed better outreach and communication strategies and recommended that FHWA clarify how local transportation agencies act on indications of risk studies for their facilities. Since the publication of the report, collaboration between these groups has become a reality. FHWA, TSA, and AASHTO have conducted Infrastructure Protection Workshops, for instance, and FHWA Division offices share expertise with security officials in the States.
Fiscal Recommendations. The panel endorsed new funding sources for bridge and tunnel security beyond and outside of current Federal-aid sources. The panel also recommended amending Title 23, Sections 144 and 133, to allow for expenditures that could enhance bridge security, as was done for seismic retrofitting. Since these recommendations were made, however, there has been no separate funding for bridge and tunnel security.
Technical Recommendations. The panel endorsed "engineering" security solutions, with the FHWA collaborating with the TSA to prioritize critical bridges and tunnels and administer funding for high security needs. Panelists also endorsed research and development initiatives to better understand bridge and tunnel security. Since the publication of the report, FHWA has worked with TSA on prioritization strategies and other technical efforts.
|
|
Bridges by Owner
Exhibit 2-16 shows the number of highway bridges by owner from 1998 to 2006. State and local ownership includes highway agencies; park, forest, and reservation agencies; toll authorities; and other State or local agencies, respectively. The majority of State and local bridges are owned by highway agencies. Federal ownership includes a number of agencies, mostly the Department of Interior and the Department of Defense. A small number (less than 1 percent) of bridges carrying public roadways are owned by other agencies, such as private entities and railroads. Bridges carrying railroads are not included in the database unless they also carry a public road or cross a public road where information of certain features, such as vertical or horizontal clearances, is required for management of the highway system.
| How vulnerable are the Nation's bridges and tunnels to terrorist attacks? | |
|
In 2002, it was estimated that about 1,000 of the Nation's almost 600,000 bridges were significant enough that there would be substantial casualties, economic disruption, and other ramifications if these bridges were damaged or destroyed. That was the conclusion of the National Needs Assessment for Ensuring Transportation, Infrastructure Security: Preliminary Estimate, NCHRP Project 20-59(5). Many of the Nation's 337 highway tunnels and 211 transit tunnels are located beneath bodies of water, and many have limited alternative routes due to geographic constraints.
|
|
| How can bridge and tunnel operators improve the security of their facilities? | |
|
Federal Emergency Management Agency (FEMA) guidelines require the development of an emergency operations plan that addresses how to respond to a threat involving a bridge. The plan should include, among other items, a sequence of events that should occur for an effective response; a list of potential areas of vulnerability; establishment of a mobile command center; evacuation and shutdown procedures; and identification of emergency evacuation routes.
FEMA and the FHWA have identified numerous countermeasures to reduce the vulnerability of bridges and tunnels. Overgrown vegetation, for example, can be cleared to improve lines of sight to critical areas. Access can be limited to critical areas. Parking spaces below bridges can be restricted, and trash cans and other storage areas that might conceal an explosive device can be removed. Police patrols, guards, and "no fly zones" can create deterrents to suspicious activities.
There are many ways bridges and tunnels can be retrofitted to improve their strength and stability. These measures include reinforcing welds and bolted connections, using energy-absorbing bolts to strengthen connections, and adding stiffeners and strengthening lateral bracing on steel elements.
|
|
| Owner | 1998 | 2000 | 2002 | 2004 | 2006 |
|---|---|---|---|---|---|
| Federal | 7,748 | 8,221 | 9,371 | 8,425 | 8,355 |
| State | 273,897 | 277,106 | 280,266 | 282,552 | 284,668 |
| Local | 298,222 | 298,889 | 299,354 | 300,444 | 301,912 |
| Private/Railroad | 2,278 | 2,299 | 1,502 | 1,497 | 1,490 |
| Unknown/ Unclassified | 1,131 | 415 | 1,214 | 1,183 | 1,137 |
| Total | 583,276 | 586,930 | 591,707 | 594,101 | 597,562 |
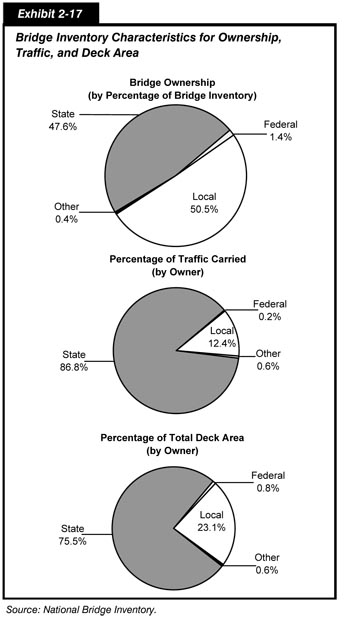
Local agencies own 301,912 bridges on the Nation's roadways, or slightly more than 50.5 percent of all bridges. These agencies include cities, counties, townships, and other non-State or non-Federal governmental agencies. State agencies own 47.6 percent, or 284,668 of the Nation's bridges on all functional roadway classifications. State and local agencies, when combined, own 586,580 of the total 597,562 of the Nation's bridges, or approximately 98.2 percent of all bridges on the Nation's roadway system.
| How do the bridge ownership percentages compare with the road ownership percentages? | |
|
Bridge ownership is nearly equally divided between State (slightly more than 47.6 percent) and local agencies (slightly more than 50.5 percent). The majority of roadways, however, are owned by local agencies (76.5 percent). States tend to own larger, higher-volume structures, such as those on Interstates and expressways. Localities own smaller structures on lower-volume roadways, such as local roads and collectors.
|
|
Deeper insight into the condition or composition of bridges can be obtained by considering the size of the structure and/or the traffic carried. Consideration of the structure size can be incorporated using the bridge deck area data. Consideration of the volume of traffic served by the structure can be incorporated using average daily traffic (ADT) data. Exhibit 2-17 compares the ownership percentages based on the actual number of bridges with percentages based on ADT on bridges and bridge deck area, respectively. Bridges owned by State agencies carry significantly higher cumulative traffic volumes, on average, than bridges owned by local agencies. State-owned bridges also tend to have greater deck area than locally owned bridges.
If an agency owns a bridge, it is responsible for the maintenance and operation of the structure. Interagency agreements may be formed, such as those between State highway agencies and localities. In these cases, a secondary agency (such as the State) performs maintenance and operation work under agreement. This, however, does not transfer ownership and therefore does not negate the responsibilities of the bridge owners for maintenance and operation in compliance with Federal and State requirements.
Bridges by Functional Classification
Highway functional classifications are maintained by the NBI according to the hierarchy used for highway systems previously described. The number of bridges by functional classification is summarized and compared with previous years in Exhibit 2-18. It should be noted the total number of bridges in the Nation in 2006 was 597,562, but the number of bridges listed in Exhibit 2-18 totals 597,340. The reason for the discrepancy is that functional classifications for 222 bridges were not provided and therefore are not entered into the database.
| Functional System | 1998 | 2000 | 2002 | 2004 | 2006 |
|---|---|---|---|---|---|
| Rural | |||||
| Interstate | 27,530 | 27,797 | 27,316 | 27,648 | 26,633 |
| Other Arterial | 73,324 | 74,796 | 74,814 | 76,456 | 75,288 |
| Collector | 143,140 | 143,357 | 144,101 | 143,470 | 142,248 |
| Local | 210,670 | 209,415 | 209,722 | 208,641 | 207,130 |
| Subtotal Rural | 454,664 | 455,365 | 455,953 | 456,215 | 451,299 |
| Urban | |||||
| Interstate | 27,480 | 27,882 | 27,929 | 27,929 | 28,637 |
| Other Arterial | 60,901 | 63,177 | 65,667 | 66,443 | 70,278 |
| Collector | 14,962 | 15,038 | 15,171 | 15,548 | 17,618 |
| Local | 24,962 | 25,684 | 26,609 | 27,940 | 29,508 |
| Subtotal Urban | 128,305 | 131,781 | 135,376 | 137,860 | 146,041 |
| Total | 582,969 | 587,146 | 591,329 | 594,075 | 597,340 |
Overall percentages of each functional classification tend to remain relatively constant over time, although bridges are functionally reclassified as urban boundaries change. It must be noted that the results of the 2000 census are still impacting the reporting of the distribution of bridges between rural and urban. The adjustments of the boundaries for these areas, in addition to construction of new bridges, are some reasons for the changes in the reported data. The number of bridges with known functional classifications increased between 2004 and 2006 by 3,265 from 594,075 in 2004 to 597,340 in 2006.
In 2006, a total of 4,916 fewer bridges were classified as rural bridges than in 2004. This reduction was in all functional classes, with 1,015 fewer Interstate bridges, 1,168 fewer bridges on other arterials, 1,222 fewer bridges on the roads classified as collectors, and 1,511 fewer bridges on local roads. In contrast, the number of bridges classified as urban increased by 8,181 in the same time period. The number of urban Interstate bridges increased by 708, bridges on other arterials increased by 3,835, on collectors by 2,070, and on local roads by 1,568.
Exhibit 2-19 shows the relationship between the number of bridges, functional system, ADT carried, and deck area. The deck area for rural bridges is 46.2 percent versus 53.8 percent for urban bridges. The major difference is in the amount of ADT carried by rural bridges versus urban bridges.
| Functional System | Number of Bridges | Percent by Total Number | Percent of Total ADT | Percent of Total Deck Area |
|---|---|---|---|---|
| Rural | ||||
| Interstate | 26,633 | 4.5% | 9.7% | 7.6% |
| Other Principal Arterial | 35,767 | 6.0% | 6.3% | 9.1% |
| Minor Arterial | 39,521 | 6.6% | 3.5% | 6.4% |
| Major Collector | 93,609 | 15.7% | 3.5% | 9.7% |
| Minor Collector | 48,639 | 8.1% | 0.8% | 3.4% |
| Local | 207,130 | 34.7% | 1.5% | 9.9% |
| Subtotal Rural | 451,299 | 75.5% | 25.2% | 46.2% |
| Urban | ||||
| Interstate | 28,637 | 4.8% | 35.4% | 18.9% |
| Other Freeways & Expressways | 17,988 | 3.0% | 15.3% | 9.6% |
| Other Principal Arterial | 26,051 | 4.4% | 12.1% | 11.1% |
| Minor Arterial | 26,239 | 4.4% | 7.1% | 7.2% |
| Collector | 17,618 | 2.9% | 2.5% | 3.2% |
| Local | 29,508 | 4.9% | 2.3% | 3.8% |
| Subtotal Urban | 146,041 | 24.4% | 74.7% | 53.8% |
| Unclassified | 222 | 0.0% | 0.0% | 0.0% |
| Total | 597,562 | 100.0% | 100.0% | 100.0% |
On the Nation's roadway systems, 75.5 percent of all bridges are located in rural areas and these rural bridges only carry about 25.2 percent of the Nation's daily traffic. This compares with urban bridges which comprise 24.4 percent of the inventory but carry 74.7 percent of all daily traffic. Not surprisingly, urban structures are generally larger in terms of deck area as additional lanes are required to carry larger volumes of traffic. Urban structures constitute 53.8 percent of all total deck area on bridges in the inventory.
Urban Interstate bridges comprise 18.9 percent of the total bridge deck area of bridges on the Nation's roadway system but carry 35.4 percent of the ADT. Bridges on urban other freeways and expressways account for 9.6 percent of the total deck area and carry 15.3 percent of the ADT. Bridges on urban other principal arterials carry 12.1 percent of the ADT and have only 11.1 percent of the total deck area.
While the higher-order functional classifications (including rural and urban Interstate, other freeways and expressways, and other principal arterials) account for only 135,076 bridges, 22.6 percent of the total bridges by number, they carry close to 78.8 percent of all daily traffic and account for approximately 56.3 percent of the deck area for all bridges in the Nation.
Bridges by Traffic Carried
Many bridges carry relatively low volumes of traffic on a typical day. Approximately 318,837 bridges, 53.3 percent of the total bridges in the Nation, have an ADT of 1,000 or less. An additional 177,431 bridges, 29.7 percent of all bridges, have an ADT between 1,000 and 10,000. Only 16,180 of the Nation's bridges, or 2.7 percent, have an ADT higher than 50,000. These structures are predominantly in urban environments (approximately 90 percent in terms of numbers, nearly 95 percent in terms of deck area). Over 95 percent of such bridges are located on Interstates or other principal arterials. The remaining 85,114 bridges, 14.3 percent, have an ADT between 10,000 and 50,000. In terms of numbers of bridges, low-volume roadways are predominant. However, the high-volume structures have a significant impact on the user population.
Bridges by Age
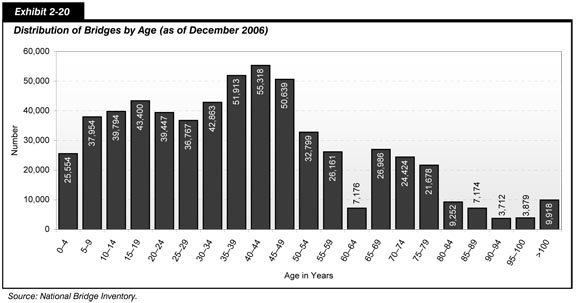
Major construction of bridges began after the end of the Second World War and continued through the construction of the Interstate System. The latter saw an intense period of construction of bridges across the Nation. Approximately 46.8 percent of all bridges were built before 1966; 24.6 percent of all bridges are less than 20 years in age, and 31.2 percent are less than 25 years old.
When broken into 25-year age ranges, 31.2 percent of the bridges are 25 years old or less, 39.8 percent are 26 years to 50 years old, 19.7 percent are 51 to 75 years old, 7.7 percent are 76 years to 100 years old, and 1.7 percent are more than 100 years old. The share of bridges 50 years old or older is 29.0 percent, while the portion of bridges less than 50 years is 71.0 percent. Exhibit 2-20 shows the distribution of bridges by age.
The age of a bridge structure is only one potential indicator of its physical condition. Several additional factors can affect the physical condition of a structure. These include, but are not limited to: the original type of design; the frequency, timeliness, effectiveness, and appropriateness of the maintenance activities implemented over the life of the structure; the loading the structure has been subject to during its life; the climate of the area where the structure is located; and any additional stresses from events such as flooding to which the structure has been subjected.
NHS Bridges
The NBI shows 115,104 bridges on the NHS. This number represented approximately 19.4 percent of the total bridges on the Nation's roadway system. These bridges had approximately 49.5 percent of the total deck area and carried 71.1 percent of the total travel on bridges in the Nation in 2006. State agencies own over 96 percent of the bridges on the NHS. Local agencies own slightly more than 3 percent of the NHS bridges, with the remaining less than 1 percent being owned by Federal agencies and other groups.
The STRAHNET system is a subset of the NHS. In 2006, approximately 73,528 bridges were on the STRAHNET system. This number represented approximately 12.1 percent of all bridges on the Nation's roadway system.
The Interstate System is a subset of the STRAHNET. The number of bridges on the Interstate System totaled 55,270 structures. The Interstate bridges carried 45.1 percent of ADT and accounted for 26.5 percent of the deck areas for all bridges in the Nation.
Transit System Characteristics
System History
The first transit systems in the United States date to the middle of the 19th century. Initially, the Federal government had little involvement in the public transit sector. Over time, however, leaders at all levels of government began to realize that developing and sustaining transit services was an important national, as well as local, concern. In 1964, Congress passed the Urban Mass Transportation Act, which generated an influx of Federal funding for transit systems. The Act also changed the character of the industry by specifying that Federal funds for transit were to be given to local or metropolitan-level public agencies, and not to private firms. This reinforced the already existing trend of transferring the ownership and operation of most transit systems in the United States from private to public hands. The Act also required local governments to contribute matching funds in order to receive Federal aid for transit services, setting the stage for the multi-level governmental partnerships that characterize the transit sector today.
State governments are also involved in the provision of transit services, generally through financial support and performance oversight. Thirty States have taxes dedicated to transit. In some cases, States have undertaken outright ownership and operation of transit services; five States—Connecticut, Delaware, Maryland, New Jersey, and Rhode Island—own and operate transit systems directly.
Several Federal initiatives from 1962 to 1965, in effect, mandated the creation of metropolitan planning organizations (MPOs) for each of the Nation's urbanized areas, although some of the Nation's largest urbanized areas already had similar organizations. MPOs are composed of local and State officials and address the transportation planning needs of an urbanized area at a regional level. MPO coordination is now an essential prerequisite for Federal funding of many transit projects.
Given the wide array of combinations of governmental involvement in transit, transit agencies may take on a number of different forms. A transit provider may be a unit of a regional transportation agency; be run directly by the State, county, or city government; or be an independent agency with an elected or appointed Board of Governors. Transit operators may provide service directly with their own equipment or they may purchase transit services through an agreement with a contractor. All public transit services must be open to the general public without discrimination and meet the accessibility requirements of the Americans with Disabilities Act of 1990 (ADA).
System Infrastructure
Transit Agencies
In 2006, there were 657 agencies in urbanized areas reporting to the National Transit Database (NTD), of which 588 were public agencies, including seven State departments of transportation. The remaining 69 agencies were either private operators or independent agencies (e.g., non-profit organizations). Of the 657 agencies, 82 received either a reporting exemption for operating nine or fewer vehicles or a temporary reporting waiver. The remaining 575 reporting agencies provided service on 1,398 separate modal networks; 162 agencies operated a single mode and 495 transit agencies operated more than one mode. In 2006, there were an additional 1,327 transit operators serving rural areas.
| What is demand response service, when is a demand response service considered to be transit, and who provides demand response service? | |
|
The term "demand response" refers to transit service dispatched directly in response to customer requests. Demand response services operate passenger cars, vans, or small buses without fixed routes or fixed schedules. Typically, a vehicle is dispatched to pick up multiple passengers at different locations before taking them to their respective destinations. A demand response system is considered to be part of the Nation's urban transit system (and hence neither a "taxi" system nor a "shared-ride shuttle" system) if the system is run by or under contract to a transit agency. Demand response vehicles are included as "regular vehicles" in Exhibit 2-21, both as rural service vehicles and as vehicles in urbanized areas.
Demand response systems are commonly used to meet transit agencies' obligations under the ADA. Another less common form of demand response service, often called "Kiddie Cabs," provides service to schoolchildren. Demand response services for the general public may be provided in small towns, rural areas, and some urban neighborhoods with limited transit demand.
The FTA grants funding to certain private entities to provide demand response–type service to the elderly and those with disabilities. These "special services" are not included in the "demand response mode" and are discussed in the section at the end of this chapter.
|
|
The Nation's motor bus and demand response systems are much more extensive than the Nation's rail transit system. In 2006, there were 622 motor bus systems and 609 demand response systems in urban areas, compared with 16 heavy rail systems, 28 commuter rail systems, and 32 light rail systems. While motor bus and demand response systems were found in every major urbanized area in the United States, only 40 urbanized areas had service on at least one of the three primary rail modes, including 16 urbanized areas with service on the heavy rail mode. In addition to these modes, there were 57 transit vanpool systems, 17 ferryboat systems, 5 trolleybus systems, 4 automated guideway systems, 4 inclined plane systems, and 1 jitney system operating in urbanized areas of the United States and its territories. The transit statistics presented in this report also include the San Francisco Cable Car, the Seattle Monorail, the Roosevelt Island Aerial Tramway in New York, and the Alaska Railroad (which is a combination of long-distance passenger rail transportation, sightseeing services, and freight transportation services.)
| What are the differences between heavy rail, light rail, and commuter rail? | |
|
There are three primary rail modes in the United States' transit system: heavy rail, light rail, and commuter rail.
Despite their names, the terms "heavy rail" and "light rail" do not refer to the weight of the rail equipment. Although the precise origins of the terms are not known, the most plausible explanation is that they refer to the level of passenger traffic that can be accommodated on the respective systems, with "heavy rail" systems carrying "heavy" passenger loads, and "light rail" systems carrying "light" passenger loads. Modern technologies, however, have somewhat blurred this distinction.
Heavy rail systems are electric railways that always operate on exclusive guideways. These systems usually have high platform loading and are typically powered by a third rail. Heavy rail trains are often six or more cars long to accommodate high passenger loads and are commonly called "metros," "rapids," or "subways" (although light rail trains may also operate occasionally in underground tunnels).
Light rail systems are electric railways that operate at least part of the time in a mixed guideway with foot and automobile traffic or have at least some at-grade crossings with foot and automobile traffic. These systems usually have low platform loading and are typically powered by overhead wires. Light rail trains are usually only one or two cars long and are often called "streetcars" or "trolleys."
Commuter rail systems typically operate on existing or retired freight rail tracks. These systems usually have low platform loading and are often powered by diesel engines (but may also be electric powered). Commuter rail systems provide service from outlying suburbs and small cities to a central downtown area, with only one or two stops in the central downtown area. A commuter rail system must get at least 50 percent of its traffic from persons using the system to commute between home and work at least three days a week to be considered a transit system (as opposed to an intercity rail system).
|
|
| What are jitney, 'aiga bus, and público services? | |
|
Jitney systems use personal vehicles, typically passenger cars, modified light trucks, or vans, to provide frequent service on fixed or semi-fixed routes, but with few or no set stops, and typically without a fixed schedule. The vehicles may be owned or leased by the operator, and capacities vary from eight passengers to modified light trucks holding 30 or more passengers. There is only one jitney service in the incorporated areas of the United States, which has been operating in Laguna Beach, California, since 1914. A newspaper reporter coined the name "jitney" because the service charged a "jitney," or five cents, for a ride. "Público" is simply the name of the jitney service in San Juan, Puerto Rico, while " 'aiga bus" is the name of the jitney service that operates on Tutuila Island (the main island) in American Samoa ('aiga' is the Samoan word for "family"). 'Aiga bus data are not reported to the NTD.
|
|
Transit Fleet
Exhibit 2-21 provides an overview of the Nation's transit fleet in 2006 by type of vehicle and size of urbanized area. Although there is a strong correlation between some types of vehicles and certain modes, many vehicles, particularly small buses and vans, are used by different modes of transit. For example, vans may be used to provide vanpool, demand response, público, or motor bus services.
| Areas Over 1 Million in Population | Areas Under 1 Million in Population | Total | ||||
|---|---|---|---|---|---|---|
| Urbanized Area Regular Vehicles | ||||||
| Heavy Rail Vehicles | 11,126 | 11.5% | 0 | 0.0% | 11,126 | 8.7% |
| Self-Propelled Commuter Rail | 2,582 | 2.7% | 0 | 0.0% | 2,582 | 2.0% |
| Commuter Rail Passenger Cars | 3,415 | 3.5% | 105 | 0.3% | 3,520 | 2.7% |
| Commuter Rail Locomotives | 718 | 0.7% | 79 | 0.3% | 797 | 0.6% |
| Light Rail Vehicles | 1,812 | 1.9% | 108 | 0.3% | 1,920 | 1.5% |
| Motor Buses | 51,451 | 53.2% | 21,611 | 68.7% | 73,063 | 57.0% |
| Vans | 14,315 | 14.8% | 7,667 | 24.4% | 21,982 | 17.2% |
| Other Regular Vehicles1 | 11,260 | 11.6% | 1,883 | 6.0% | 13,143 | 10.3% |
| Total Urbanized Area Regular Vehicles | 96,679 | 100.0% | 31,453 | 100.0% | 128,133 | 100.0% |
| Rural Service Regular Vehicles | 0 | 20,459 | 20,459 | |||
| Total Regular Vehicles | 96,679 | 51,912 | 148,592 | |||
| Special Service Vehicles 2 | 10,107 | 27,613 | 37,720 | |||
| Total Active Vehicles | 106,786 | 79,525 | 186,312 | |||
2Source: FTA, Fiscal Year Trends Report on the Use of Section 5310 Elderly and Persons with Disabilities Program Funds, 2002.
The Nation's transit system continues to grow. In 2006, urban transit systems, excluding special service providers, operated 128,133 vehicles compared with 120,659 vehicles in 2004, an increase of 6.2 percent.
Exhibit 2-22 shows the composition of the Nation's urban transit road vehicle fleet in 2006. The most common type of vehicle is the full-size bus, comprising 47.6 percent of the fleet, followed by vans and small buses, comprising 23.1 percent and 18.4 percent of the fleet, respectively. Articulated buses increased from 3.3 percent in 2004 to 3.6 percent of the total fleet in 2006. Overall, the Nation's urban transit road vehicle fleet has grown by 26.9 percent, which is more than 20,000 vehicles, since 1997. The largest component of growth in the Nation's urban transit road vehicle fleet between 1997 and 2006 has come from small-size buses, which have more than doubled in number since 1997. This is largely driven by an increase in paratransit and demand response vehicles coupled with ADA compliance requirements that would have still been in the early stages of maturity in 1997. The number of full-size buses, by contrast, has remained nearly constant during that same time, and even realized a slight decline over the last reporting period (1.8 percent). For more information on the composition of the Nation's urban transit road vehicle fleet, please see Chapter 3.
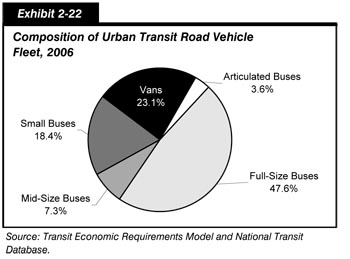
| What are the characteristics of the rural service vehicles and the special service vehicles listed in Exhibit 2-21? | |
|
Rural service vehicles are vehicles used for regular service that are owned by operators receiving funding from FTA as directed by Title 49—United States Code, Section 5311. These funds are for the provision of transit services in areas with populations of less than 50,000, and these transit operators do not currently report to the NTD.
Special service vehicles are vehicles that are used to provide service to the elderly and disabled, and receive funding from FTA as directed by Title 49—United States Code, Section 5310. Special service vehicle funding is directed toward private nonprofit organizations, although in certain cases specified by law, a public agency may be approved as a grantee. Special service vehicles are not included in the demand response mode (as defined in the fourth Q&A box in this section); recipients of funding for special service vehicles do not report to the NTD. In 2002 (the most recent year available), there were 16,219 special service vehicles in service purchased with FTA funds in both urban and rural areas.
There may be a few rare cases where a single agency receives both rural service vehicle funding and special service vehicle funding, resulting in a few cases of double-counting of vehicles. Additionally, both rural service and special service vehicles include vehicles in American Samoa, Guam, the Northern Marianas, and the Virgin Islands, which do not have urbanized area transit agencies that report to the NTD.
|
|
Track, Stations, and Maintenance Facilities
In 2006, there were 813 maintenance facilities for all transit modes in urban areas, compared with 793 in 2004. The number of light rail maintenance facilities increased from 38 in 2004 to 43 in 2006 and the number of heavy rail increased from 55 to 57. Over this same period, the number of bus maintenance facilities increased from 516 to 526, while the number of demand response vehicle maintenance facilities increased only slightly from 103 to 104 [Exhibit 2-23].
| Areas Over 1 Million in Population |
Areas Under 1 Million in Population |
Total | ||
|---|---|---|---|---|
| Maintenance Facilities1 | ||||
| Heavy Rail | 57 | 0 | 57 | |
| Commuter Rail | 62 | 0 | 62 | |
| Light Rail | 36 | 7 | 43 | |
| Other Rail 2 | 3 | 4 | 7 | |
| Motor Bus | 285 | 241 | 526 | |
| Demand Response | 34 | 70 | 104 | |
| Ferryboat | 6 | 0 | 6 | |
| Other Nonrail 3 | 5 | 3 | 8 | |
| Total Urban Maintenance Facilities | 488 | 325 | 813 | |
| Rural Transit4 | 510 | 510 | ||
| Total Maintenance Facilities | 488 | 835 | 1,323 | |
2Alaska railroad, automated guideway, cable car, inclined plane, and monorail.
3Aerial tramway, jitney, and Público.
4Vehicles owned by operators receiving funding from FTA as directed by 49 USC Section 5311. These funds are for transit services in areas with populations of less than 50,000. (Section 5311 Status of Rural Public Transportation 2000, Community Transportation Association of America, April 2001.)
In 2006, transit providers operated 11,796 miles of track and served 3,053 stations, compared with 10,892 miles of track and 2,961 stations in 2004. For 2006, similar to 2004, a significant portion of the increase in these transit track and station assets was for light rail service. Light rail track increased from 1,321 miles in 2004 to 1,464 miles in 2006, and the light rail stations increased from 723 to 764. The Nation's urban transit rail system infrastructure, however, continues to be dominated by commuter rail. In 2006, commuter rail systems accounted for 62.8 percent of transit track miles (7,406 miles) and 38.3 percent of transit rail stations (1,169). This reflects the longer distances generally covered by commuter rail. In 2006, heavy rail accounted for 19.3 percent (2,277 miles) of track miles and 34.1 percent of stations (1,042). Heavy rail typically operates in more densely developed areas than commuter rail, and thus has a higher ratio of stations to track miles [Exhibit 2-24].
| Urbanized Areas Over 1 Million in Population |
Urbanized Areas Under 1 Million in Population |
Total | |
|---|---|---|---|
| Track Mileage | |||
| Heavy Rail | 2,277 | 0 | 2,277 |
| Commuter Rail | 7,139 | 267 | 7,406 |
| Light Rail | 1,389 | 75 | 1,464 |
| Other Rail and Tramway * | 32 | 617 | 649 |
| Total Urbanized Area Track Mileage | 10,837 | 959 | 11,796 |
| Stations | |||
| Heavy Rail | 1,042 | 0 | 1,042 |
| Commuter Rail | 1,141 | 28 | 1,169 |
| Light Rail | 702 | 62 | 764 |
| Other Rail and Tramway * | 46 | 32 | 78 |
| Total Urbanized Area Transit Rail Stations | 2,931 | 122 | 3,053 |
System Coverage: Urban Directional Route Miles
The extent of the coverage of the Nation's transit system is measured in directional route miles, or simply "route miles." Route miles measure the distance covered by a transit route; transit routes that use the same road or track are counted twice. Route miles are not collected for demand response and vanpool modes, since these transit modes do not travel along specific predetermined routes. Route miles are also not collected for jitney services, since these transit modes often have highly variable route structures.
In the United States in 2006, 223,489 urban route miles were provided by nonrail, which is consistent with 2004 data (at 216,619 urban route miles). Rail modes provided 10,865 urban route miles, an increase from 9,782 in 2004 [Exhibit 2-25]. Bus modes, which cover a wider area than rail modes, accounted for 94.9 percent of urban route miles in 2006. Rail modes cover smaller areas, typically providing higher-frequency service on the same route and producing fewer directional route miles.
| Average Annual Rate of Change | ||||||||
|---|---|---|---|---|---|---|---|---|
| 1997 | 1999 | 2000 | 2002 | 2004 | 2006 | 2006/ 1997 |
2006/ 2004 |
|
| Rail | 8,602 | 9,170 | 9,222 | 9,484 | 9,782 | 10,865 | 2.6% | 5.4% |
| Commuter Rail 1 | 6,393 | 6,802 | 6,802 | 6,923 | 6,875 | 6,972 | 1.0% | 0.7% |
| Heavy Rail | 1,527 | 1,540 | 1,558 | 1,572 | 1,597 | 1,623 | 0.7% | 0.8% |
| Light Rail | 659 | 802 | 834 | 960 | 1,187 | 1,280 | 7.7% | 3.8% |
| Other Rail 2 | 24 | 27 | 29 | 30 | 123 | 989 | 51.4% | 183.9% |
| Nonrail 3 | 185,164 | 195,984 | 196,858 | 225,820 | 216,619 | 223,489 | 2.1% | 1.6% |
| Bus | 184,248 | 195,022 | 195,884 | 224,838 | 215,571 | 222,445 | 2.1% | 1.6% |
| Ferryboat | 496 | 533 | 505 | 513 | 623 | 620 | 2.5% | -0.2% |
| Trolleybus | 420 | 430 | 469 | 468 | 425 | 424 | 0.1% | -0.1% |
| Total | 193,766 | 205,154 | 206,080 | 235,304 | 226,401 | 234,354 | 2.1% | 1.7% |
| Percent Nonrail | 95.6% | 95.5% | 95.5% | 96.0% | 95.7% | 95.4% | ||
2Automated guideway, inclined plane, cable car, and monorail.
3Excludes jitney, Público, and vanpool.
Total route miles increased at an average annual rate of 2.1 percent between 1997 and 2006 and 1.7 percent between 2004 and 2006. Reported motor bus miles increased to 222,445 after reported miles in 2004 were 215,571. Rail route miles increased at an average annual rate of 2.6 percent between 1997 and 2006, and at a 5.4 percent average annual rate from 2004 to 2006. Light rail route miles have grown the most rapidly, reflecting new systems and extensions to existing systems that have become operational. Light rail route miles increased at an average annual rate of 7.7 percent between 1997 and 2006, increasing at a slower pace from 2004 to 2006 of 3.8 percent.
System Capacity
Transit system capacity, particularly in cross-modal comparisons, is typically measured by capacity-equivalent vehicle revenue miles (capacity-equivalent VRMs). Capacity-equivalent VRMs measure the distance traveled by transit vehicles in revenue service, adjusted by the passenger-carrying capacity of each transit vehicle type, with the average carrying capacity of motor bus vehicles representing the baseline.
Exhibit 2-26 provides VRMs, unadjusted by passenger-carrying capacity. These numbers are of interest because they show the actual number of miles traveled by each mode in revenue service. The shares of unadjusted VRMs provided by bus services and rail services are relatively consistent between 1997 and 2006. In 2006, nonrail modes accounted for 72.8 percent and rail modes accounted for 27.2 percent of unadjusted VRMs. As subsequent paragraphs will show, however, the share of VRMs on rail modes, adjusted for capacity, is considerably higher than the share before adjustment.
| Mode | Millions | Average Annual Rate of Change | ||||||
|---|---|---|---|---|---|---|---|---|
| 1997 | 1999 | 2000 | 2002 | 2004 | 2006 | 2006/ 1997 |
2006/ 2004 |
|
| Rail | 811 | 854 | 880 | 925 | 962 | 997 | 2.3% | 1.8% |
| Heavy Rail | 540 | 561 | 578 | 603 | 625 | 634 | 1.8% | 0.7% |
| Commuter Rail | 230 | 243 | 248 | 259 | 269 | 287 | 2.5% | 3.3% |
| Light Rail | 40 | 47 | 51 | 60 | 67 | 73 | 6.9% | 4.4% |
| Other Rail | 2 | 2 | 2 | 3 | 2 | 3 | 4.2% | 20.1% |
| Nonrail | 2,042 | 2,257 | 2,322 | 2,502 | 2,586 | 2,674 | 3.0% | 0.3% |
| Motor Bus | 1,606 | 1,719 | 1,764 | 1,864 | 1,885 | 1,910 | 1.9% | 0.7% |
| Demand Response | 350 | 418 | 452 | 525 | 561 | 607 | 6.3% | 4.0% |
| Vanpool | 40 | 60 | 62 | 71 | 78 | 110 | 11.9% | 19.0% |
| Ferryboat | 2 | 2 | 2 | 3 | 3 | 3 | 3.6% | -4.2% |
| Trolleybus | 13 | 14 | 14 | 13 | 13 | 12 | -1.1% | -4.8% |
| Other Nonrail | 31 | 44 | 28 | 26 | 46 | 32 | 0.3% | -16.6% |
| Total | 2,853 | 3,111 | 3,202 | 3,427 | 3,548 | 3,671 | 2.8% | 1.7% |
| Percent Rail | 28.4% | 27.4% | 27.5% | 27.0% | 27.1% | 27.2% | ||
The 2006 capacity-equivalent factors for each mode are shown in Exhibit 2-27. Unadjusted VRMs for each mode are multiplied by a capacity-equivalent factor in order to calculate capacity-equivalent VRMs. These factors are equal to the average full-seating and full-standing capacities of vehicles in active service for each transit mode divided by the full-seating and full-standing capacities of all motor bus vehicles in active service. For vehicles that prohibit standing, as is the case of some commuter rail systems, standing capacity is assumed to be zero. The capacity-equivalent factors used in the 2006 and this report differ slightly from those in the 2004 C&P Report. Capacity-equivalent VRMs are now calculated by using a unique capacity-equivalent factor for each year based on the full-seating and full-standing capacities reported for that year to the NTD. The 2004 C&P Report used capacity-equivalent factors based on full-seating and full-standing capacities for an average of the last 3 years of the data used in that report.
| Base = Average Motorbus Vehicle Capacity | |||
|---|---|---|---|
| Automated Guideway | 1.4 | Jitney | NA |
| Alaska Railroad | 1.0 | Light Rail | 2.7 |
| Cable Car | 0.8 | Motor Bus | 1.0 |
| Commuter Rail | 2.9 | Monorail | 1.9 |
| Demand Response | 0.2 | Público | 0.3 |
| Ferryboat | 13.3 | Trolleybus | 1.6 |
| Heavy Rail | 2.6 | Aerial Tramway | NA |
| Inclined Plane | 0.9 | Vanpool | 0.2 |
Since 1997, the capacity-equivalent factors of the major rail modes have increased significantly, largely as a result of increased standing capacity. Exhibit 2-28 shows the percentage change in seating, standing, and total capacity for the four largest transit modes since 1997. The average seating capacity for motor bus has declined in part through the addition of many more small buses to the motor bus fleet. At the same time, the capacity of rail mode vehicles has increased through the purchase of larger vehicles, and the removal of seats from existing vehicles for the expansion of standing capacity.
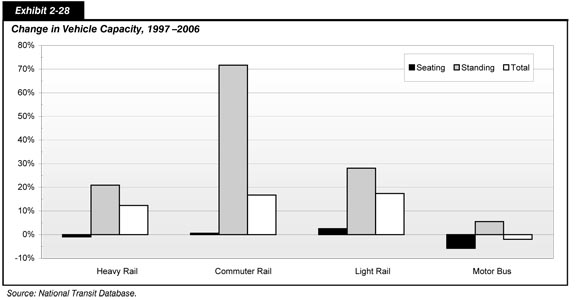
Total capacity-equivalent VRMs are shown in Exhibit 2-29. In 2006, nonrail modes accounted for only 44.1 percent of capacity-equivalent VRMs, while rail modes accounted for 54.9 percent of capacity-equivalent VRMs. For all modes, capacity-equivalent VRMs increased at an average annual rate of 3.5 percent between 1997 and 2006 and 3.5 percent between 2004 and 2006. Rail capacity-equivalent VRMs increased at an average annual rate of 4.5 percent between 1997 and 2006 and 5.4 percent between 2004 and 2006. Among the rail modes, light rail capacity-equivalent VRMs have grown the most rapidly, increasing from 92 million capacity-equivalent VRMs in 1997 to 197 million capacity-equivalent VRMs in 2006, an average annual increase of 8.9 percent, and 4.9 percent between 2004 and 2006.
| Mode | Millions | Average Annual Rate of Change | ||||||
|---|---|---|---|---|---|---|---|---|
| 1997 | 1999 | 2000 | 2002 | 2004 | 2006 | 2006/ 1997 |
2006/ 2004 |
|
| Rail | 1,801 | 1,936 | 2,046 | 2,274 | 2,413 | 2,681 | 4.5% | 5.4% |
| Heavy Rail | 1,183 | 1,247 | 1,321 | 1,469 | 1,546 | 1,648 | 3.8% | 3.2% |
| Commuter Rail | 522 | 572 | 595 | 652 | 685 | 832 | 5.3% | 10.2% |
| Light Rail | 92 | 114 | 127 | 150 | 179 | 197 | 8.9% | 4.9% |
| Other Rail | 4 | 4 | 3 | 3 | 3 | 4 | -0.5% | 18.7% |
| Nonrail | 1,720 | 1,862 | 1,908 | 2,037 | 2,064 | 2,118 | 2.3% | 1.3% |
| Motor Bus | 1,606 | 1,719 | 1,764 | 1,864 | 1,885 | 1,910 | 1.9% | 0.7% |
| Demand Response | 56 | 72 | 76 | 100 | 101 | 121 | 8.9% | 9.5% |
| Vanpool | 8 | 11 | 11 | 15 | 15 | 22 | 12.6% | 21.5% |
| Ferryboat | 24 | 30 | 30 | 32 | 32 | 37 | 4.7% | 6.7% |
| Trolleybus | 19 | 19 | 20 | 20 | 20 | 19 | 0.0% | -2.3% |
| Other Nonrail | 8 | 11 | 7 | 7 | 12 | 10 | 2.3% | -9.5% |
| Total | 3,521 | 3,799 | 3,954 | 4,311 | 4,478 | 4,800 | 3.5% | 3.5% |
Capacity-equivalent VRMs for nonrail modes increased at an average annual rate of 2.3 percent between 1997 and 2006 and 1.3 percent between 2004 and 2006. The most rapid expansion in capacity-equivalent VRMs has been for vanpools, growing from 8 million in 1997 to 22 million in 2006, at an average annual rate of 12.6 percent, and 21.5 percent between 2004 and 2006.
The ADA spurred a rapid expansion of demand response capacity-equivalent VRMs, which increased at an average annual rate of 8.9 percent from 1997 to 2006 and continued to increase from 2004 to 2006 by 9.5 percent.
Ridership
There are two primary measures of transit ridership-unlinked passenger trips and passenger miles traveled (PMT). An unlinked passenger trip is defined as a journey on one transit vehicle. Passenger miles traveled are calculated on the basis of unlinked passenger trips and estimates of average trip length based on surveys. Either measure provides an appropriate time series since average trip lengths, according to mode, have not changed substantially over time. Cross-modal comparisons, however, may differ substantially depending on which measure is used.
Exhibits 2-30 and 2-31 show the distribution of unlinked passenger trips and PMT by mode. In 2006, there were 9.4 billion unlinked trips and 49.5 billion PMT. Fifty-six and two tenths percent of unlinked trips were on motor buses, 31.2 percent were on heavy rail, 4.7 percent were on commuter rail, 4.3 percent were on light rail, and 3.5 percent were on other. By comparison, 41.2 percent of PMT in 2006 were on motor bus; 29.7 percent were on heavy rail; 20.9 percent were on commuter rail; and 3.8 and 4.4 percent, respectively, were on light rail and other modes. While unlinked passenger trips and PMT both increased by approximately 6 percent, the allocation across the modes remained relatively unchanged.
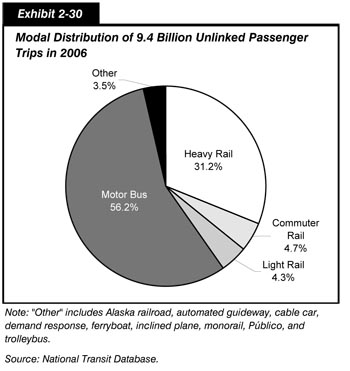
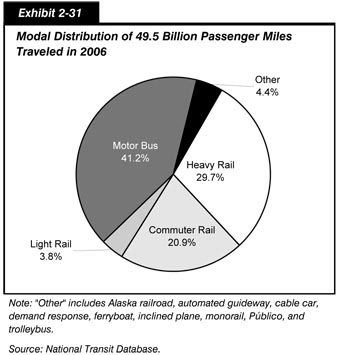
| What factors affect transit ridership? | |
|
Transit ridership is composed of two segments, "transit-dependent riders" and "choice riders."
"Transit-dependent riders" are those riders without ready access to a personal vehicle. Many of these riders live in low-income households and cannot afford the expense of private vehicle ownership. Others chose to forego the costs of private vehicle ownership, as the local transit system provides sufficient mobility to workplaces, shopping centers, places of worship, and other activity centers. Transit-oriented development is a key factor in boosting transit-dependent ridership.
"Choice riders" are those who have access to a private vehicle, but choose to use transit based on the quality of transit service and the cost savings of using transit for the trip instead of a private vehicle. The quality of transit service depends upon numerous factors, including the frequency, reliability, and overall speed of service. Also important is whether the vehicles and transit stops are comfortable, clean, safe, and secure. Additionally, the ease of access to the route network and the clarity of the route network and schedule are important quality factors.
Transit ridership increases when transit, compared with a private vehicle, provides a savings in money, time, or both. Transit ridership will typically decrease after a fare increase, while transit ridership will often increase after an increase in gasoline prices or parking costs. Likewise, increasing congestion on roads and highways can boost transit ridership, particularly on modes with exclusive guideways, while adding stops in the middle of transit routes can cause ridership to decrease at outlying route points as the overall speed of service decreases.
A statistical analysis by FTA found a positive relationship between changes in employment in an area and transit use in the area. As approximately 50 percent of all transit trips are used to get to and from work, reduced unemployment in an area may boost transit ridership as more people in the area make daily trips to work. Additionally, total employment in an area typically rises concomitant with population growth, and increasing population in an area increases the overall market size available to transit. Research on the factors that affect transit ridership is ongoing; additional linkages are under examination, such as the connection between household income and transit ridership.
|
|
Exhibit 2-32 provides total PMT for selected years between 1997 and 2006. PMT increased at an average annual rate of 2.3 percent between 1997 and 2006, growing from 40.2 billion miles in 1997 to 49.5 billion miles in 2006. This rate of growth has increased in recent years, averaging 3.1 percent between 2004 and 2006. PMT on all rail modes combined has an average annual rate of change of 2.7 percent between 1997 and 2006, yet this continues to be significantly higher than the 1.9 percent average annual growth rate on all nonrail modes. As a result of this divergence, the share of PMT served by rail modes increased from 52.6 percent in 1997 to 54.5 percent in 2006.
| Mode | Millions | Average Annual Rate of Change | ||||||
|---|---|---|---|---|---|---|---|---|
| 1997 | 1999 | 2000 | 2002 | 2004 | 2006 | 2006/ 1997 |
2006/ 2004 |
|
| Rail | 21,138 | 22,875 | 24,603 | 24,616 | 25,668 | 26,972 | 2.7% | 2.5% |
| Heavy Rail | 12,056 | 12,902 | 13,844 | 13,663 | 14,354 | 14,721 | 2.2% | 1.3% |
| Commuter Rail | 8,037 | 8,764 | 9,400 | 9,500 | 9,715 | 10,359 | 2.9% | 3.3% |
| Light Rail | 1,024 | 1,190 | 1,340 | 1,432 | 1,576 | 1,866 | 6.9% | 8.8% |
| Other Rail1 | 21 | 19 | 20 | 22 | 22 | 25 | 2.2% | 7.5% |
| Nonrail | 19,042 | 20,404 | 20,498 | 21,328 | 20,878 | 22,533 | 1.9% | 3.9% |
| Motor Bus | 17,509 | 18,684 | 18,807 | 19,527 | 18,921 | 20,390 | 1.7% | 3.8% |
| Demand Response | 531 | 559 | 588 | 651 | 704 | 753 | 4.0% | 3.4% |
| Vanpool | 310 | 413 | 407 | 455 | 459 | 689 | 9.3% | 22.5% |
| Ferryboat | 254 | 295 | 298 | 301 | 357 | 360 | 3.9% | 0.4% |
| Trolleybus | 189 | 186 | 192 | 188 | 173 | 164 | -1.6% | -2.7% |
| Other Nonrail2 | 249 | 267 | 205 | 206 | 265 | 176 | -3.8% | -18.4% |
| Total | 40,180 | 43,279 | 45,101 | 45,944 | 46,546 | 49,504 | 2.3% | 3.1% |
| Percent Rail | 52.6% | 52.9% | 54.6% | 53.6% | 55.1% | 54.5% | ||
2Aerial tramway and Público.
The fastest growth in PMT has been on modes with low levels of ridership in 1997 and which have experienced rapid growth in capacity since then. PMT on vanpools grew the most rapidly between 1997 and 2006, at an average annual rate of 9.3 percent, and 22.5 percent between 2004 and 2006, as transit agencies expanded their offerings of this service to commuters. PMT on light rail also grew significantly, at an average annual rate of 6.9 percent between 1997 and 2006, and 8.8 percent between 2004 and 2006, as new light rail systems and extensions were opened. PMT on demand response systems has also grown rapidly, increasing at an average annual rate of 4.0 percent between 1997 and 2006, and 3.4 percent between 2004 and 2006.
Rural Transit Systems (Section 5311 Providers)
Rural operators are defined as those providing service outside urbanized areas or to areas with populations of less than 50,000. The information on rural systems presented here is taken from Status of Rural Public Transportation 2000, prepared for FTA and released in April 2001, which is the most recent data available on rural transit. This section has not been updated since the last edition of this report.
| How are transit route miles and ridership in rural areas classified when they are associated with an agency that also operates in an urbanized area? | |
|
Transit agencies that operate in both urbanized and rural areas report data to the NTD for both areas combined. These combined data are included in NTD statistics for urbanized areas.
|
|
The Status of Rural Public Transportation 2000 report was based on a 1997 comprehensive listing of U.S. rural transit operators, compiled by the Institute for Economic and Social Measurement from State Departments of Transportation, and on surveys conducted by the Community Transportation Association of America (CTAA) for FTA in 1999 and 2000. A total of 108 rural transit operators responded to the 1999 survey, and a total of 50 operators responded to the 2000 survey. Although survey respondents provided information covering different 12 month periods, with commencement dates ranging from June 1997 to June 1999, the data sets were combined for purposes of analysis.
FTA instituted rural reporting to the NTD in 2006. In 2006, there were 1,327 rural transit operators, an increase of 112 since 2000. The average fleet size of active vehicles for 2006 was reported to be 15, compared with the 2000 sample (150 responses) of 17.5. Total rural fleet size was estimated to have increased from 12,223 vehicles in 1994 to 20,459 in 2006, of which 14,177 are ADA-accessible vehicles (almost 70 percent). For rural transit operators in 2006, operators incurred on average 345,931 vehicle miles.
Rural systems provide both traditional fixed-route and demand response services, with 1,146 demand response services, 180 motor bus services, and one vanpool service operator. Approximately 8.7 percent of rural systems also coordinate van or carpooling programs.
Transit System Characteristics for Americans With Disabilities and the Elderly
The ADA is intended to ensure that persons with disabilities have access to the same facilities and services as other Americans, including transit vehicles and facilities. This equality of access is brought about through the upgrading of transit vehicles and facilities on regular routes, through the provision of demand response transit service for those individuals who are still unable to use regular transit service, and through special service vehicles operated by private entities and some public organizations, often with the assistance of FTA funding.
Since the passage of the ADA in 1990, transit operators have been working to upgrade their regular vehicle fleets and improve their demand response services in order to meet the ADA's requirement to provide persons with disabilities a level of service comparable to the level provided to nondisabled persons using fixed-route systems. U.S. Department of Transportation (DOT) regulations provide minimum guidelines and accessibility standards for buses; vans; and heavy, light, and commuter rail vehicles. For example, commuter rail transportation systems are required to have at least one accessible car per train and all new cars must be accessible. The ADA deems it discriminatory for a public entity providing a fixed-route transit service to provide disabled individuals with services that are inferior to those provided to nondisabled individuals.
The percentage of transit vehicles that are ADA-compliant is increasing as old vehicles are retired and new vehicles are purchased with ADA compliance in mind. In 2006, 80.2 percent of all transit vehicles reported to the NTD were ADA-compliant. This percentage has slightly increased, from 78.9 percent in 2004, and is significantly greater than the 73.3 percent reported for 2000. The percentage of vehicles compliant with the ADA for each mode is shown in Exhibit 2-33.
| Mode | Active Vehicles | ADA-Compliant Vehicles | Percent of Active Vehicles ADA-Compliant |
|---|---|---|---|
| Rail | |||
| Heavy Rail | 11,083 | 10,511 | 94.8% |
| Commuter Rail | 5,956 | 3,642 | 61.1% |
| Light Rail | 1,830 | 1,486 | 81.2% |
| Alaska Railroad | 43 | 18 | 41.9% |
| Automated Guideway | 87 | 51 | 58.6% |
| Cable Car | 40 | 0 | 0.0% |
| Inclined Plane | 8 | 6 | 75.0% |
| Monorail | 8 | 8 | 100.0% |
| Total Rail | 19,055 | 15,722 | 82.5% |
| Nonrail | |||
| Motor Bus | 63,176 | 62,315 | 98.6% |
| Demand Response | 27,954 | 19,820 | 70.9% |
| Vanpool | 8,068 | 180 | 2.2% |
| Ferryboat | 111 | 92 | 82.9% |
| Trolleybus | 615 | 575 | 93.5% |
| Publico | 4,118 | 0 | 0.0% |
| Total Nonrail | 104,042 | 82,982 | 79.8% |
| Total All Modes | 123,097 | 98,704 | 80.2% |
In addition to the services provided by urban transit operators, about 4,836 private and nonprofit agencies received FTA Section 5310 funding for the provision of "special" transit services (i.e., demand response) to persons with disabilities and the elderly. A recent survey by the University of Montana found that in 2002 there were 4,836 private and nonprofit agencies that received FTA Section 5310 funding, compared with 3,673 agencies reported by a CTAA survey in 1993. These providers include religious organizations, senior citizen centers, rehabilitation centers, the American Red Cross, nursing homes, community action centers, sheltered workshops, and coordinated human services transportation providers.
In 2002, the most recent year for which data are available, these providers were estimated to be using 37,720 special service vehicles. Approximately 62 percent of these special service providers were in rural areas, and 38 percent were in urbanized areas. Data collected by FTA show that approximately 76 percent of the vehicles purchased in FY 2002 were wheelchair accessible, about the same as in the previous few years.
In 2006, 71.9 percent of total transit stations were ADA-compliant. The NTD began collecting data on the ADA compliance of transit stations in 2002, and it has taken some time to ensure that this information is correctly reported. Therefore, data on total station compliance provided in previous reports may not be directly comparable to data provided in this report, due to improvements in reporting quality. The ADA requires that new transit facilities and alterations to existing facilities be accessible to the disabled [Exhibit 2-34].
| Mode | Total Stations | ADA Compliant Stations | Percent of Stations ADA Compliant |
|---|---|---|---|
| Rail | |||
| Heavy Rail | 1,042 | 479 | 46.0% |
| Commuter Rail | 1,169 | 712 | 60.9% |
| Light Rail | 764 | 635 | 83.1% |
| Alaska Railroad | 10 | 10 | 100.0% |
| Automated Guideway | 48 | 47 | 97.9% |
| Inclined Plane | 8 | 7 | 87.5% |
| Monorail | 2 | 2 | 100.0% |
| Total Rail | 3,043 | 1,892 | 62.2% |
| Nonrail | |||
| Motor Bus | 1,308 | 1,221 | 93.3% |
| Ferryboat | 68 | 63 | 92.6% |
| Trolleybus | 5 | 5 | 100.0% |
| Total Nonrail | 1,381 | 1,289 | 93.3% |
| Total All Modes | 4,424 | 3,181 | 71.9% |
Under the ADA, FTA was given responsibility for identifying "key rail stations" and facilitating the accessibility of these stations to disabled persons by July 26, 1993. Key rail stations are identified on the basis of the following criteria:
- The number of passengers boarding at the key station exceeds the average number of passengers boarding on the rail system as a whole by at least 15 percent.
- The station is a major point where passengers shift to other transit modes.
- The station is at the end of a rail line, unless it is close to another accessible station.
- The station serves a "major" center of activities, including employment or government centers, institutions of higher education, and major health facilities.
Although ADA legislation required all key stations to be accessible by July 26, 1993, the DOT ADA regulation in Title 49—Code of Federal Regulations (CFR), Part 37.47(c)(2), permitted the FTA Administrator to grant extensions up to July 26, 2020, for stations requiring extraordinarily expensive structural modifications to bring them into compliance. In 2006, there were 687 key rail stations, of which 27 stations (3.9 percent) were under FTA-approved time extensions. The total number of key rail stations has changed slightly over the years as certain stations have merged or closed and as other key rail stations have opened. Out of the 660 key rail stations that are not under an FTA-approved time extension, 632 stations (95.8 percent) have been determined to be ADA-accessible. A total of 321 stations (48.6 percent) are both ADA-accessible and have been found by FTA to be fully ADA-compliant. Another 311 stations (47.1 percent) are ADA-accessible, but are either not fully ADA-compliant or have not been reviewed by FTA for a determination that they are not fully compliant. Only 28 out of the 660 stations not under an FTA-approved time extension (4.2 percent) are not yet ADA-accessible. FTA continues to focus its attention on the 28 stations that are not under a waiver and not fully accessible, as well as on the 27 stations whose waivers will be expiring in the coming years.
Transit System Characteristics: Special Interests
Exhibit 2-35 presents an increase in the share of alternative fuel buses from 7.8 percent in 2000 to 16.3 percent in 2006. In 2006, 12.2 percent of buses used compressed natural gas, 2.0 percent used bio-diesel, 1.6 percent used liquefied natural gas, and 0.5 percent used other alternative fuels (e.g., electricity, ethanol, etc.). Conventional fuel buses, which comprise the majority of the U.S. bus fleet, utilized diesel fuel and gasoline.
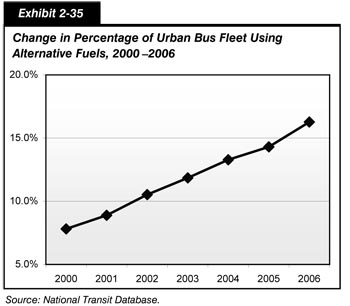
Comparison
Exhibit 2-36 summarizes the key findings in this chapter, comparing system and use characteristics data in this report with the 2004 values shown in the 2006 C&P Report. Some of the 2004 values have subsequently been revised, which is reflected in the second column as appropriate. The third column contains comparable values based on 2006 data.
| Statistic | 2004 Data | 2006 Data | |
|---|---|---|---|
| 2006 C&P Report |
Revised | ||
| Percentage of Total Highway Miles Owned by Local Governments | 76.5% | 76.5% | |
| Percentage of Total Highway Miles Owned by State Governments | 20.4% | 20.3% | |
| Percentage of Total Highway Miles Owned by the Federal Government | 3.1% | 3.2% | |
| Local Transit Operators in Urbanized Areas | 640 | 657 | |
| Rural and Specialized Transit Service Providers | 6,051 | 6,163 | |
| Total Rural Highway Miles (Under 5,000 in Population) | 3.00 million | 2.99 million | |
| Total Urban Highway Miles (5,000 or more in Population) | 0.99 million | 1.04 million | |
| Total Highway Miles | 3.99 million | 4.033 million | |
| Transit Route Miles (Rail) | 9,782 | 10,865 | |
| Transit Route Miles (Nonrail) | 216,620 | 216,619 | 223,489 |
| Total Transit Route Miles | 226,402 | 226,401 | 234,354 |
| Total Rural Highway Lane Miles (Under 5,000 in Population) | 6.15 million | 6.12 million | |
| Total Urban Highway Lane Miles (5,000 or more in Population) | 2.23 million | 2.34 million | |
| Total Highway Lane Miles | 8.37 million | 8.45 million | |
| Urban Transit Capacity-Equivalent Vehicle Miles (Rail) | 2.41 billion | 2.68 billion | |
| Urban Transit Capacity-Equivalent Vehicle Miles (Nonrail) | 2.06 billion | 2.11 billion | |
| Urban Transit Capacity-Equivalent Vehicle Miles (Total) | 4.48 billion | 4.80 billion | |
| Vehicle Miles Traveled on Rural Highways (Under 5,000 in Population) | 1.07 trillion | 1.04 trsillion | |
| Vehicle Miles Traveled on Urban Highways (5,000 or more in Population) | 1.91 trillion | 1.99 trillion | |
| Vehicle Miles Traveled on All Highways | 2.98 trillion | 3.03 trillion | |
| Transit Urban Passenger Miles (Rail) | 25.7 billion | 27.0 billion | |
| Transit Urban Passenger Miles (Nonrail) | 20.9 billion | 22.5 billion | |
| Transit Urban Passenger Miles (Total) | 46.5 billion | 49.5 billion | |
Highway
There were 4.03 million miles of public roads in the United States in 2006, of which 2.99 million miles were in rural areas (rural areas are defined as locations with populations of less than 5,000 people and urban communities are defined as those areas with populations of 5,000 or more). Local governments controlled 76.5 percent of total highway miles in 2006; States controlled 20.3 percent; and the Federal government owned 3.2 percent. Consequently, the Nation's highway system is overwhelmingly rural and local.
Total highway lane mileage went from 8.37 million in 2004 to 8.45 million in 2006. Total lane miles have increased at an average annual rate of about 0.3 percent since 1997, mostly in urban areas. Urban lane mileage grew from 2.2 million in 2004 to more than 2.3 million in 2006. Rural lane mileage decreased slightly from 6.15 million in 2004 to 6.12 million in 2006. Some of this change can be attributed to the 2000 census and the resulting functional classification shifts from rural to urban areas.
The total number of vehicle miles traveled (VMT) between 1997 and 2006 has increased at a 2.1-percent average annual rate versus 2.5 percent for the period of 1995 to 2004 as presented in the previous C&P report. Rural highways remained at approximately 1 trillion VMT while urban roads increased to almost 2 trillion VMT. The most significant change occurred in the small urban areas, which experienced an average annual increase of 4.2 percent. The total VMT in rural areas decreased by 0.03 trillion VMT from 2004 to 2006. Total traffic increased in urban areas by nearly 0.08 trillion VMT between 2004 and 2006.
Bridge
In 2006, there were 597,562 bridges that were over 6.1 meters (20 feet) in total length on public roads in the United States, an increase from 594,101 bridges in 2004. While 75.5 percent of bridges are located in rural areas, 74.7 percent of the daily traffic on bridges is carried by the urban structures.
In comparison, 2006 figures show a decrease in the share of bridges located in rural areas from the 2004 level of 76.8 percent to the 2006 level of 74.7 percent. Daily traffic on bridges in urban areas increased from 72.6 percent in 2004 to 74.7 percent in 2006. This change can be explained in part by the 2000 census boundary changes, reclassifying some areas from rural to urban.
Responsibility for and ownership of bridges is split primarily between State agencies (47.6 percent) and local governments (50.5 percent). Federal agencies own 8,355 bridges nationwide (1.4 percent), and there are a small number of privately owned or railroad-owned bridges carrying public roadways. State agencies tend to own bridges located on roadways with higher functional classifications, such as principal arterials; the majority of local government bridges are located on local and collector roadways.
Transit
Transit system coverage, capacity, and use in the United States continued to increase between 2004 and 2006. In 2006, there were 657 transit operators serving urbanized areas compared with 640 operators in 2004. In 2002, the most recent year for which information is available, there were an estimated 4,836 providers of special transit services to the elderly and disabled in both urban and rural areas. In 2006, there were 1,327 transit operators serving rural areas. A transit provider may be an independent agency; a unit of a regional transportation agency; or a unit of a State, county, or city government.
In 2006, transit agencies in urban areas operated 128,133 vehicles, of which 96,697 were in areas of more than 1 million people. Also in 2006, rail systems had 11,796 miles of rail track and 3,053 rail stations, compared with 10,892 miles of track and 2,961 stations in 2004. The number of bus and rail maintenance facilities in urban areas increased from 793 in 2004 to 813 in 2006.
In 2006, the Federal Transit Administration (FTA) instituted rural reporting to the NTD. Rural operators, last surveyed about their vehicles in 2000, reported utilizing 20,459 transit vehicles in rural areas in 2006. Nearly 70 percent of these vehicles, or 14,177, are accessible as defined by the Americans with Disabilities Act (ADA). Additionally, the FTA has estimated that in 2002 there were 37,720 special service vehicles operated for the elderly and disabled, of which 16,219 had been funded by the FTA. In 2006, transit systems operated 234,354 urban directional route miles, of which 223,489 were nonrail and 10,865 were rail route miles. Total route miles increased by 3.5 percent between 2004 and 2006. Nonrail route miles increased by 3.2 percent and rail route miles increased by 11.1 percent.
Transit system capacity as measured by capacity-equivalent vehicle revenue miles (VRM) increased by 7.2 percent in total between 2004 and 2006. Capacity-equivalent VRM measure the distance traveled by a transit vehicle in revenue service, adjusted by the passenger-carrying capacity of each transit vehicle type, with the passenger-carrying capacity of a motorbus representing the baseline. The capacity of rail modes increased by 11.1 percent between 2004 and 2006, and the capacity of nonrail modes by 2.6 percent. In 2006, as in earlier years, slightly more than half of capacity-equivalent VRM were provided by rail modes, and slightly less than half were provided by nonrail modes. Capacity-equivalent VRM provided by light rail systems grew rapidly between 2004 and 2006, increasing in total by 10.1 percent. This largely reflects New Starts openings and extensions.
Transit passenger miles increased by 6.4 percent in total between 2004 and 2006, growing from 46.5 billion to 49.5 billion over that time period. Passenger miles traveled on nonrail modes increased from 20.9 billion in 2004 to 22.5 billion in 2006, or by a total of 7.9 percent. Passenger miles on rail transit modes increased in total by 5.1 percent from 2004 to 2006, increasing from 25.7 billion in 2004 to 27.0 billion in 2006.