

- Road Conditions
- Pavement Terminology and Measurements
- Pavement Ride Quality on the National Highway System
- Interstate Pavement Ride Quality
- STRAHNET Pavement Ride Quality
- Pavement Ride Quality on Federal-Aid Highways
- Rural and Urban Pavement Ride Quality
- Pavement Ride Quality by Functional Classification
- Pavement Ride Quality by Mileage
- Lane Width
- Roadway Alignment
- Bridge System Conditions
- Explanation of Bridge Deficiencies
- Condition Ratings
- Appraisal Ratings
- NHS Bridge Condition
- Deficiencies by Bridge Deck Area
- Deficiencies by ADT Carried
- Deficiencies by Number of Bridges
- Interstate System
- STRAHNET System
- Overall Bridge Condition
- Deficient Bridges by Owner
- Rural and Urban Deficient Bridges by Functional Classification
- Culvert Conditions
- Explanation of Bridge Deficiencies
- Transit System Conditions
- Comparison
Road Conditions
The condition of the roadway pavement is an important factor in the cost to the public for the transportation of goods, the providing of services, and personal travel. Pavement condition affects costs associated with travel, including vehicle operation, delay, and crash expenses. Poor road surfaces cause additional wear and tear on, or even damage to, vehicle suspensions, wheels, and tires. When vehicles slow down in heavy traffic for potholes or very rough pavement, this can create significant queuing and subsequent delay. Inadequate road surfaces can reduce road friction, which affects the stopping ability and maneuverability of vehicles. Unexpected changes in surface conditions can also increase the probability that crashes may occur.
This section examines the physical conditions of the Nation's roadways, addressing both roadway surface conditions and other condition measures. This information is presented for the National Highway System (NHS) including its Interstate highway system component, and for the overall highway system. Chapter 4 addresses measuring operations performance trends from a broad perspective and Chapter 5 discusses safety performance measures.
Subsequent sections within this chapter explore the physical conditions of bridges and transit systems. This is followed by a section comparing key statistics from the highway, bridge, and transit sections with the information presented in the previous edition of this report.
Pavement Terminology and Measurements
The pavement condition ratings in this section are derived from one of two measures: the International Roughness Index (IRI) or the Present Serviceability Rating (PSR). The IRI measures the cumulative deviation from a smooth surface in inches per mile. The PSR is a subjective rating system based on a scale of 0 to 5. Prior to 1993, all pavement conditions were evaluated using PSR values. A conversion table is used to translate PSR values into equivalent IRI values to classify mileage for the tables in this section.
The FHWA adopted the IRI for the higher functional classifications because it is an objective measurement and is generally accepted worldwide as a pavement roughness measurement. The IRI system results in more consistent data for trend analyses and cross jurisdiction comparisons. Exhibit 3-1 contains a description of qualitative pavement condition terms and corresponding quantitative PSR and IRI values. The translation between PSR and IRI is not exact; IRI values are based on objective measurements of pavement roughness, while PSR is a subjective evaluation of a broader range of pavement characteristics. For example, a given Interstate pavement section could have an IRI rating of 165, but might be rated a 2.4 on the PSR scale. Such a section would be rated as acceptable based on its IRI rating, but would not have been rated as acceptable had PSR been used. Thus, the mileage of any given pavement condition category may differ depending on the rating methodology. The historic pavement ride quality data in this report start in 1997, while IRI data only began to be collected in 1993. Caution should be used when making comparisons with older data from earlier editions of this report and when attempting to make comparisons between PSR and IRI data in general.
| Ride Quality Terms* | All Functional Classifications | |
|---|---|---|
| IRI Rating | PSR Rating | |
| Good | < 95 | ≥ 3.5 |
| Acceptable | ≤ 170 | ≥ 2.5 |
as set by the FHWA Performance Plan for the NHS. Some transportation agencies
may use less stringent standards for lower functional classification highways
to be classified as "Acceptable."
While this edition of the C&P report retains a summary exhibit based on pavement conditions in terms of mileage to maintain continuity with previous editions, most exhibits are based on the percentage of vehicle miles traveled (VMT) occurring on pavements with good and/or acceptable ride quality.
| What are some measures of pavement condition other than IRI? | |
|
Other principal measures of pavement condition or distress such as rutting, cracking, and faulting exist, but are not currently reported in HPMS. However, FHWA has been working with states to determine a reasonable manner to report these items and is moving toward including them in future HPMS data requirements to be reported by the states. Adding these metrics to FHWA's database will enable the agency to account for national pavement needs more accurately.
|
|
The Federal Highway Administration 1998 National Strategic Plan introduced a new descriptive term for pavement condition: "acceptable ride quality," defined as pavements having an IRI value less than or equal to 170 inches per mile. While the initial target established in this plan was based on the percentage of miles of NHS pavements with acceptable ride quality, this metric was subsequently revised to be based on the percentage of NHS VMT on pavements with acceptable ride quality. In 2006, the FHWA adopted an even more rigorous performance measure, the percentage of NHS VMT pavements meeting the standard for "good ride quality," defined as having an IRI value less than 95 inches per mile. Note that "good" represents a subset of "acceptable" and this report does not apply any specific descriptive label to pavements with IRI values greater than or equal to 95 but less than or equal to 170 inches per mile, which fall within the "acceptable" range but outside the "good" range.
| What effect does pavement ride quality have on the economic costs experienced by highway users? | |
|
Among the three major components of highway user costs measured in this report (travel time costs, vehicle operating costs, and crash costs), pavement condition has the most direct impact on vehicle operating costs in the form of increased wear and tear on vehicles and repair costs. Poor pavement can also impact travel time costs to the extent that road conditions force drivers to reduce speed and can have an impact on crash rates. Highway user costs are discussed in more detail in Chapter 7.
As the terms "good ride quality" and "acceptable ride quality" are defined based on a range of IRI values, the impact that pavements classified in these categories would have on highway user costs tends to vary. In general, pavements falling below the acceptable ride quality threshold would tend to have greater impacts on user costs than those classified as having acceptable or good ride quality. However, the relative impacts on user costs of a pavement with an IRI of 169 (acceptable) compared to a pavement with an IRI of 171 (not acceptable) would not be significant. The same would be true for pavements just above or below the good ride quality standard (an IRI of less than or equal to 95). Other factors, such as vehicle speed, can significantly influence the impact that pavement ride quality has on highway user costs.
|
|
The Department of Transportation's FY 2008 Performance and Accountability Report presents an FY 2008 target of 57 percent for the share of travel on the NHS meeting pavement performance standards for good ride quality. This target was developed based on analyses using the Highway Economic Requirements System (HERS) model, which is discussed in more detail in Chapter 7 and Appendix A. It should be noted that the FY 2008 Performance and Accountability Report presents ride quality data on a Federal fiscal year basis, while the C&P report presents comparable data on a calendar year basis in order to retain consistency with the annual Highway Statistics publication.
The time required for the IRI on a roadway to transition from one pavement rating category to the next depends heavily on such factors as pavement design, the volume and types of traffic carried by the facility, environmental factors, and the type and frequency of maintenance actions performed on the facility. A new pavement will start at the top of the "Good" category and will, over time, transition to the lower range of that category; at some time in the future the pavement will likely transition to the "Acceptable" category and may move outside of this category, depending on the timing of future resurfacing or reconstruction actions.
Pavement Ride Quality on the National Highway System
As shown in Exhibit 3-2, the share of NHS VMT on pavements with good ride quality has risen sharply over time, from approximately 39 percent in 1997 to approximately 57 percent in 2006. The VMT on NHS pavements meeting the less stringent standard of acceptable ride quality grew more slowly, from approximately 89 percent in 1997 to approximately 93 percent in 2006.
| 1997 | 1999 | 2000 | 2002 | 2004 | 2006 | |
|---|---|---|---|---|---|---|
| Good (IRI < 95)* | 39% | 46% | 48% | 50% | 52% | 57% |
| Acceptable (IRI ≤ 170) | 89% | 91% | 91% | 91% | 91% | 93% |
As shown in Exhibit 3-3, rural NHS routes tend to have better pavement conditions than urban NHS routes, as 73.6 percent of rural NHS VMT in 2006 was on pavements with good ride quality while 47.7 percent of the urban NHS VMT was on pavements with good ride quality. However, the total NHS traffic in urban areas was higher than in rural areas, approximately 0.9 trillion VMT on urban NHS routes versus approximately 0.5 trillion VMT on rural NHS routes.
| 2004 | 2006 | |
|---|---|---|
| Rural | ||
| Good (IRI < 95) | 68.0% | 73.6% |
| Acceptable (IRI ≤ 170) | 97.0% | 97.8% |
| Urban | ||
| Good (IRI < 95) | 42.5% | 47.7% |
| Acceptable (IRI ≤ 170) | 86.9% | 90.0% |
The share of rural NHS VMT on pavements providing good ride quality increased from 68.0 percent in 2004 to 73.6 percent in 2006. The portion of VMT on rural pavements meeting the standard of acceptable ride quality also grew from 97.0 percent in 2004 to 97.8 percent in 2006. The share of NHS VMT on pavements with good ride quality in urban areas increased from 42.5 percent in 2004 to 47.7 percent in 2006. The urban NHS VMT on acceptable pavements rose from 86.9 percent in 2004 to 90.0 percent in 2006.
Interstate Pavement Ride Quality
As described in Chapter 2, the Interstate Highway System constitutes a key subset of the NHS. Exhibit 3-4 shows the percentage of total Interstate VMT on pavements with good and/or acceptable ride quality broken down by population area subsets. Since 1997, the percentage of VMT on interstate pavements with good ride quality has increased in rural areas, small urban areas, and urbanized areas.
| Quality | 1997 | 1999 | 2000 | 2002 | 2004 | 2006 |
|---|---|---|---|---|---|---|
| Good (IRI < 95) | ||||||
| Rural Areas | 56.5% | 66.8% | 69.6% | 72.2% | 73.7% | 78.6% |
| Small Urban Areas | 51.4% | 52.9% | 59.8% | 62.5% | 65.6% | 71.6% |
| Urbanized Areas | 39.1% | 35.4% | 39.7% | 42.5% | 48.5% | 52.9% |
| Acceptable (IRI ≤ 170) | ||||||
| Rural Areas | 95.7% | 97.4% | 97.4% | 97.3% | 97.8% | 98.2% |
| Small Urban Areas | 96.1% | 95.9% | 95.3% | 94.6% | 95.7% | 96.9% |
| Urbanized Areas | 88.1% | 90.4% | 91.0% | 89.3% | 89.9% | 92.5% |
Among the three population area subsets shown, rural Interstates had the highest percentage of VMT on pavements with good ride quality in 2006, at 78.6 percent. A total of 98.2 percent of all VMT on the rural Interstate System occurred on pavements with acceptable ride quality.
The share of small urban Interstate VMT occurring on pavements with good ride quality was 71.6 percent in 2006. The portion of VMT on small urban Interstate pavements with acceptable ride quality was 96.9 percent. For urbanized Interstates, the share of VMT occurring on pavements with good ride quality was 52.9 percent in 2006, while the share of VMT on acceptable ride quality pavements was 92.5 percent.
STRAHNET Pavement Ride Quality
The Strategic Highway Network (STRAHNET) constitutes another key subset of the NHS. The STRAHNET is discussed in more detail in Chapter 2.
As shown in Exhibit 3-5, the share of VMT on STRAHNET on pavements providing good ride quality increased from 56.9 percent in 2004 to 61.2 percent in 2006. The portion of VMT on pavements meeting the acceptable standard increased from 93.0 percent in 2004 to 94.6 percent in 2006.
| 2004 | 2006 | |
|---|---|---|
| Rural | ||
| Good (IRI < 95) | 72.2% | 77.3% |
| Acceptable (IRI ≤ 170) | 97.6% | 98.2% |
| Urban | ||
| Good (IRI < 95) | 47.6% | 52.2% |
| Acceptable (IRI ≤ 170) | 90.3% | 92.7% |
| Rural and Urban | ||
| Good (IRI < 95) | 56.9% | 61.2% |
| Acceptable (IRI ≤ 170) | 93.0% | 94.6% |
Pavement Ride Quality on Federal-Aid Highways
The Highway Performance Monitoring System collects ride quality data only for Federal-aid highways, which include all functional classes except for rural minor collectors, rural local, and urban local. As described in Chapter 2, these three functional classifications account for approximately three-fourths of the total mileage on the Nation's system, but carry less than one-sixth of the total daily VMT on the Nation's roadway system. Because the focus of this report is on VMT-based measures of ride quality rather than mileage-based measures, the omission of these functional classes from the statistics in this section is less significant.
The terms "good ride quality" and "acceptable ride quality" and the numeric thresholds that were used to describe NHS pavements for FHWA performance planning purposes are utilized in this section for all Federal-aid highways, although these thresholds may be less relevant to lower-ordered functional classes that carry less traffic than the typical route on the NHS. The ride quality for all Federal-aid highways (which include the NHS) tends to be worse on average than the ride quality for the average NHS route.
For those functional classes on which data are collected, the VMT on pavements with good ride quality increased from 39.4 percent in 1997 to 47.0 percent in 2006, as shown in Exhibit 3-6. The VMT on pavements meeting the standard of acceptable (which includes the category of good) declined slightly from 86.4 percent in 1997 to 86.0 percent in 2006.
| Quality | 1997 | 1999 | 2000 | 2002 | 2004 | 2006 |
|---|---|---|---|---|---|---|
| Good (IRI < 95) | 39.4% | 41.8% | 42.8% | 43.8% | 44.2% | 47.0% |
| Acceptable (IRI ≤ 170) | 86.4% | 86.0% | 85.5% | 85.3% | 84.9% | 86.0% |
Rural and Urban Pavement Ride Quality
When discussing ride quality, it is important to note the different travel characteristics between rural and urban areas. As noted in Chapter 2, rural areas contain about three-fourths of road miles, but support only about one-third of annual national VMT. In other words, although rural areas have a larger percentage of road miles, the majority of travel occurs in urban areas. According to 2006 data, the amount of VMT on pavements rated as having good ride quality in rural areas is higher than those in small urban and urbanized areas. Exhibit 3-7 shows that 62.2 percent of total VMT in rural areas is on pavement with good ride quality, compared with 44.2 percent of VMT in small urban areas and 38.2 percent of the VMT in urbanized areas.
| 1997 | 1999 | 2000 | 2002 | 2004 | 2006 | |
|---|---|---|---|---|---|---|
| Rural | ||||||
| Good (IRI < 95) | 47.9% | 53.0% | 55.2% | 58.0% | 58.3% | 62.2% |
| Acceptable (IRI ≤ 170) | 92.5% | 93.5% | 93.8% | 94.1% | 94.5% | 94.9% |
| Small Urban | ||||||
| Good (IRI < 95) | 39.3% | 40.0% | 41.2% | 41.6% | 41.2% | 44.2% |
| Acceptable (IRI ≤ 170) | 84.0% | 83.9% | 84.1% | 84.4% | 84.3% | 85.5% |
| Urbanized | ||||||
| Good (IRI < 95) | 33.5% | 34.1% | 34.3% | 34.1% | 36.1% | 38.2% |
| Acceptable (IRI ≤ 170) | 82.6% | 81.0% | 79.9% | 79.3% | 79.2% | 80.6% |
The share of VMT on pavements with good ride quality in the rural areas has steadily increased from 47.9 percent in 1997 to 62.2 percent in 2006. The percentages of VMT on similar pavements in small urban and urbanized areas have fluctuated during the same period. In small urban areas, the share of VMT on good pavements increased overall from 39.3 percent in 1997 to 44.2 percent in 2006. In urbanized areas, the share of VMT on good pavements increased from 33.5 percent in 1997 to 38.2 percent in 2006.
The portion of VMT on pavements with acceptable ride quality increased from 92.5 percent for 1997 to 94.9 percent for 2006 in rural areas; in small urban areas, the comparable share rose from 84.0 percent to 85.5 percent over the same period of time. In urbanized areas from 1997 through 2004, the portion of VMT on pavements rated in acceptable condition decreased from 82.6 percent to 79.2 percent, but increased in 2006 to 80.6 percent.
| Does the impact of poor pavement condition on highway user costs tend to vary by functional class? | |
|
Yes. The impact of pavement ride quality on user costs will tend to be higher on the higher functional classification roadways such as Interstate highways than on the roadways with lower functional classifications such as connectors.
The impact of poor ride quality on vehicle operating costs tends to vary with speed. For example, a vehicle encountering a pothole at 55 miles per hour on an Interstate highway would experience relatively more wear and tear than a vehicle encountering an identical pothole on a collector at 25 miles per hour.
Poor ride quality would also tend to have a greater impact on Interstate highways due to their higher traffic volumes. The Interstate System supports the movement of passenger vehicles and trucks at relatively high speeds across the Nation. Poor ride quality can cause drivers to travel at a lower speed than the facility is otherwise capable of supporting, thereby increasing the time of individual trips and adding to congestion. In the case of freight movement, this reduction in travel speed would add to the cost of the delivery of goods.
Poor ride quality on collectors would not have as great an impact on vehicle speeds because the average speed on such facilities is lower to begin with.
|
|
Pavement Ride Quality by Functional Classification
Roads classified as Interstate have the largest percentage of VMT per lane mile, followed (in order) by other principal arterials, minor arterials, collectors, and locals. Therefore, improving ride quality on a mile of an Interstate route affects more users than improving ride quality on a mile of road on a lower functional classification.
Exhibit 3-8 shows the percentage of VMT on good and acceptable pavements for each functional class from 1997 to 2006. Since 1997, the percentage of total rural road VMT on pavements with acceptable ride quality has increased for each of the four functional classes of rural roads for which data are available. The functional class of rural major collectors has shown a varied pattern between 1997 and 2006 and has ranged from a low of 86.1 percent in 1999 to a high of 88.5 percent in 2004, with 87.8 percent of VMT on this functional class occurring on roadways with acceptable ride quality in 2006.
| Functional System | 1997 | 1999 | 2000 | 2002 | 2004 | 2006 |
|---|---|---|---|---|---|---|
| Percent Good | ||||||
| Rural Interstate | 56.5% | 66.8% | 69.6% | 72.2% | 73.7% | 78.6% |
| Rural Principal Arterial | 47.0% | 54.3% | 56.8% | 60.2% | 61.0% | 66.8% |
| Rural Minor Arterial | 43.8% | 47.2% | 48.9% | 51.0% | 51.5% | 56.3% |
| Rural Major Collector | 41.9% | 38.6% | 39.9% | 42.4% | 40.3% | 39.8% |
| Small Urban Interstate | 52.9% | 59.8% | 62.5% | 65.1% | 65.6% | 71.6% |
| Small Urban Other Freeway & Expressway | 38.2% | 39.8% | 41.6% | 48.1% | 57.7% | 61.4% |
| Small Urban Other Principal Arterial | 32.9% | 35.0% | 38.0% | 37.0% | 37.6% | 42.2% |
| Small Urban Minor Arterial | 43.6% | 39.2% | 38.2% | 38.5% | 33.0% | 32.5% |
| Small Urban Collector | 36.6% | 36.0% | 34.1% | 32.8% | 30.7% | 24.8% |
| Urbanized Interstate | 35.4% | 39.7% | 42.5% | 43.8% | 48.5% | 52.9% |
| Urbanized Other Freeway & Expressway | 27.4% | 31.3% | 31.9% | 32.8% | 37.8% | 44.5% |
| Urbanized Other Principal Arterial | 26.1% | 24.2% | 25.0% | 23.8% | 24.8% | 26.7% |
| Urbanized Minor Arterial | 40.8% | 37.8% | 33.9% | 33.4% | 32.2% | 33.7% |
| Urbanized Collector | 39.8% | 39.9% | 38.5% | 35.9% | 36.4% | 35.6% |
| Percent Acceptable | ||||||
| Rural Interstate | 95.7% | 97.4% | 97.4% | 97.3% | 97.8% | 98.2% |
| Rural Principal Arterial | 93.8% | 95.5% | 96.0% | 96.2% | 96.1% | 97.0% |
| Rural Minor Arterial | 92.1% | 93.2% | 93.1% | 93.8% | 94.3% | 95.1% |
| Rural Major Collector | 87.3% | 86.1% | 86.9% | 87.6% | 88.5% | 87.8% |
| Small Urban Interstate | 96.1% | 95.9% | 95.3% | 94.6% | 95.0% | 96.9% |
| Small Urban Other Freeway & Expressway | 92.6% | 93.0% | 94.4% | 95.3% | 93.9% | 96.0% |
| Small Urban Other Principal Arterial | 80.6% | 82.2% | 83.3% | 83.8% | 84.2% | 86.7% |
| Small Urban Minor Arterial | 84.0% | 81.8% | 81.7% | 82.1% | 77.6% | 81.3% |
| Small Urban Collector | 78.7% | 76.6% | 74.3% | 74.9% | 66.5% | 71.0% |
| Urbanized Interstate | 88.1% | 90.4% | 91.0% | 89.3% | 89.9% | 92.5% |
| Urbanized Other Freeway & Expressway | 86.9% | 87.6% | 86.8% | 87.4% | 87.4% | 91.9% |
| Urbanized Other Principal Arterial | 73.3% | 68.3% | 68.8% | 68.8% | 70.7% | 71.8% |
| Urbanized Minor Arterial | 83.3% | 80.2% | 75.7% | 75.4% | 73.1% | 74.9% |
| Urbanized Collector | 84.4% | 80.1% | 76.4% | 74.5% | 72.4% | 72.9% |
Between 1997 and 2006, the share of VMT on roads with acceptable ride quality varied for the five functional classifications of roadways in small urban areas: the Interstate, other freeway and expressway, and other principal arterial functional classes each saw improvements, while the minor arterial and collector functional classes both experienced declines. In urbanized areas, the percentage of VMT on roads with acceptable ride quality rose for the Interstate and other freeway and expressway functional classes from 1997 to 2006, but declined over this period for the other principal arterial, minor arterial, and collector functional classes. Between 2004 and 2006, the percentage of VMT on pavements with acceptable ride quality for each small urban and urbanized functional class improved.
In rural areas, the percentages of VMT on pavements with good ride quality increased between 1997 and 2006 for the Interstate, other principal arterial, and minor arterial functional classes, but decreased for major collector routes. For both small urban areas and urbanized areas, the percentages of VMT on good ride quality pavements increased for the Interstate, other freeway and expressway, and other principal arterial functional classes, but declined for the minor arterial and collector functional classes. It is possible that the varied pattern shown is the result of the changes in the 2000 census adjustment of boundaries for population areas (rural, small, urban, and urbanized). These changes in the report of the distribution of mileage and VMT in the 2000 census for all population areas continues to have an impact on pavement ride quality. Another source of the change could be the deterioration in overall pavement conditions.
Pavement Ride Quality by Mileage
Exhibit 3-9 shows the pavement ride quality by functional classification from 1997 to 2006 based on mileage, rather than on VMT. Since 1997, the percentage of total rural road mileage of pavement with acceptable ride quality has increased for all four functional classes of rural roads for which data are available. For the five functional classifications of roadways in small urban areas, the total mileage meeting acceptable ride quality standards showed an increase for three functional classes—Interstate, other freeway and expressway, and other principal arterial—and a decrease for two other functional classes—minor arterial and collector. Urbanized functional classes showed increases in mileage meeting acceptable ride quality in two functional classes—Interstate, and other freeway and expressway—but a decrease for the remaining three classifications.
| Functional System | 1997 | 1999 | 2000 | 2002 | 2004 | 2006 |
|---|---|---|---|---|---|---|
| Percent Acceptable | ||||||
| Rural Interstate | 95.9% | 97.6% | 97.8% | 97.8% | 98.1% | 98.0% |
| Rural Other Principal Arterial | 93.7% | 95.4% | 96.0% | 96.6% | 95.8% | 96.7% |
| Rural Minor Arterial | 91.5% | 93.1% | 93.0% | 94.2% | 93.5% | 94.0% |
| Rural Major Collector | 82.1% | 81.5% | 81.8% | 83.2% | 83.9% | 84.5% |
| Subtotal Rural Areas | 86.5% | 86.8% | 87.1% | 88.2% | 88.4% | 89.0% |
| Small Urban Interstate | 95.8% | 95.4% | 95.7% | 95.3% | 95.0% | 96.5% |
| Small Urban Other Freeway & Expressway | 91.2% | 92.8% | 93.7% | 94.8% | 93.9% | 95.8% |
| Small Urban Other Principal Arterial | 80.5% | 81.7% | 82.9% | 83.0% | 84.4% | 85.9% |
| Small Urban Minor Arterial | 81.9% | 80.3% | 80.1% | 80.3% | 76.9% | 79.3% |
| Small Urban Collector | 74.4% | 73.1% | 71.0% | 71.8% | 66.7% | 66.9% |
| Subtotal Small Urban Areas | 79.4% | 78.7% | 78.1% | 78.5% | 75.6% | 76.8% |
| Urbanized Interstate | 90.1% | 92.2% | 93.0% | 91.7% | 92.6% | 94.2% |
| Urbanized Other Freeway & Expressway | 87.7% | 88.8% | 88.3% | 88.8% | 89.7% | 92.9% |
| Urbanized Other Principal Arterial | 73.2% | 67.6% | 67.7% | 67.5% | 69.5% | 71.1% |
| Urbanized Minor Arterial | 82.5% | 80.3% | 75.8% | 74.7% | 72.2% | 73.9% |
| Urbanized Collector | 80.8% | 76.2% | 72.6% | 71.3% | 69.0% | 68.2% |
| Subtotal Urbanized Areas | 80.7% | 77.4% | 74.6% | 73.7% | 72.4% | 73.3% |
| Total Acceptable | 84.8% | 84.3% | 83.9% | 84.5% | 83.7% | 84.2% |
| Percent Good | ||||||
| Rural Interstate | 56.9% | 65.4% | 68.5% | 71.9% | 73.2% | 77.2% |
| Rural Other Principal Arterial | 47.5% | 54.0% | 57.4% | 60.9% | 60.8% | 65.3% |
| Rural Minor Arterial | 42.6% | 46.1% | 46.8% | 50.6% | 50.0% | 53.3% |
| Rural Major Collector | 37.4% | 34.1% | 35.2% | 37.1% | 34.6% | 35.1% |
| Subtotal Rural Areas | 41.0% | 41.1% | 42.6% | 45.2% | 43.7% | 45.4% |
| Small Urban Interstate | 51.4% | 58.2% | 61.6% | 64.9% | 66.9% | 71.1% |
| Small Urban Other Freeway & Expressway | 35.8% | 41.3% | 43.8% | 49.7% | 54.6% | 60.0% |
| Small Urban Other Principal Arterial | 32.6% | 33.7% | 36.6% | 35.4% | 36.6% | 40.3% |
| Small Urban Minor Arterial | 40.4% | 37.3% | 35.8% | 36.1% | 31.1% | 31.9% |
| Small Urban Collector | 33.0% | 31.9% | 30.4% | 29.4% | 28.0% | 23.6% |
| Subtotal Small Urban Areas | 36.1% | 35.2% | 35.0% | 34.6% | 32.9% | 32.4% |
| Urbanized Interstate | 39.3% | 45.0% | 48.2% | 48.7% | 53.7% | 57.5% |
| Urbanized Other Freeway & Expressway | 31.4% | 35.5% | 37.9% | 39.6% | 43.6% | 49.0% |
| Urbanized Other Principal Arterial | 26.6% | 23.5% | 23.9% | 22.8% | 23.9% | 26.6% |
| Urbanized Minor Arterial | 39.7% | 37.0% | 33.8% | 31.9% | 30.6% | 33.3% |
| Urbanized Collector | 35.7% | 34.7% | 32.9% | 31.0% | 31.8% | 31.9% |
| Subtotal Urbanized Areas | 35.3% | 33.9% | 32.5% | 31.0% | 31.6% | 33.5% |
| Total Good | 39.5% | 39.2% | 40.0% | 41.5% | 40.0% | 41.5% |
Between 1997 and 2006, the percentage of roadway miles with good ride quality increased in rural areas for three of the four functional class groups—Interstate, other principal arterial, and minor arterial. It declined for major collectors. In small urban areas, good ride quality miles increased for three of the five functional classes—Interstate, other freeway and expressway, and other principal arterial. Decreases were reported for the minor arterial and collector classes.
For urbanized areas during the same time period, two of the five classes showed an increase in mileage with good ride quality—Interstate, and other freeway and expressway. The percentage of pavement with good ride quality in the other principal arterial functional classification in 2006 remained unchanged from the level in 1997, but did increase from 23.9 percent in 2004 to 26.6 percent in 2006. The remaining two classes, minor arterial and collector, both showed decreases in mileage meeting the criteria for pavements with good ride quality.
Lane Width
Lane width affects capacity and safety; narrow lanes have a lower capacity. As with roadway alignment, lane width is more crucial on those functional classifications with higher travel volumes.
Currently, higher functional systems such as Interstates are expected to have 12-foot lanes. Approximately 98.75 percent of all Interstate highways had lane widths of 12 feet or greater in 2006. As shown in Exhibit 3-10 approximately 98.99 percent of rural Interstate miles and 98.29 percent of urban Interstate miles have minimum 12-foot lane widths.
| > 12 foot | 11 foot | 10 foot | 9 foot | < 9 foot | |
|---|---|---|---|---|---|
| Rural | |||||
| Interstate | 98.99% | 1.00% | 0.00% | 0.00% | 0.02% |
| Other Principal Arterial | 89.39% | 8.63% | 1.62% | 0.30% | 0.07% |
| Minor Arterial | 70.40% | 18.74% | 9.82% | 0.91% | 0.14% |
| Major Collector | 38.08% | 26.45% | 26.42% | 7.05% | 2.00% |
| Urban | |||||
| Interstate | 98.29% | 1.66% | 0.02% | 0.01% | 0.02% |
| Other Freeway & Expressway | 95.03% | 4.43% | 0.46% | 0.02% | 0.07% |
| Other Principal Arterial | 80.82% | 13.15% | 5.42% | 0.34% | 0.26% |
| Minor Arterial | 66.37% | 18.69% | 12.61% | 1.71% | 0.63% |
| Collector | 51.70% | 19.47% | 20.91% | 5.76% | 2.16% |
A slight majority (51 percent) of urban collectors have lane widths of 12 feet or greater, but approximately one-fifth have 11-foot lanes, and about one-fifth have 10-foot lanes. Among rural major collectors, 38 percent have lane widths of 12 feet or greater, but approximately one-quarter have 11-foot lanes, about one-quarter have 10-foot lanes, and roughly one-tenth have lane widths of 9 feet or less.
Roadway Alignment
Alignment adequacy affects the level of service and safety of the highway system. There are two types of alignment: horizontal (curvature) and vertical (gradient). Inadequate alignment may result in speed reductions and impaired sight distance. In particular, trucks are affected by inadequate vertical alignment with regard to speed. Alignment adequacy is evaluated on a scale from Code 1 (best) to Code 4 (worst).
Adequate alignment is more important on roads with higher travel speeds and/or higher volumes (e.g., Interstates). Alignment is not an issue in more than a small number of urban areas; therefore, only rural alignment issues are presented in this section. The amount of change in roadway alignment is gradual and occurs only during major reconstruction of existing roadways. New roadways are constructed to meet current vertical and horizontal alignment criteria and therefore do not have alignment problems, except under very extreme conditions.
As shown in Exhibit 3-11, approximately 93.2 percent of rural Interstate miles are classified as Code 1 for horizontal alignment and 93.8 percent as Code 1 for vertical alignment.
| Code 1 | Code 2 | Code 3 | Code 4 | |
|---|---|---|---|---|
| Horizontal | ||||
| Interstate | 93.2% | 0.8% | 2.3% | 3.7% |
| Other Principal Arterial | 77.5% | 8.3% | 8.6% | 5.5% |
| Minor Arterial | 71.8% | 6.0% | 14.4% | 7.7% |
| Major Collector | 68.5% | 10.8% | 11.7% | 9.0% |
| Vertical | ||||
| Interstate | 93.8% | 5.7% | 0.3% | 0.2% |
| Other Principal Arterial | 65.8% | 23.0% | 6.3% | 4.9% |
| Minor Arterial | 52.5% | 27.2% | 12.3% | 7.9% |
| Major Collector | 58.4% | 25.7% | 9.8% | 6.1% |
Code 2 Some curves or grades are below design standards for new
construction, but curves can be negotiated safely at prevailing
speed limits. Truck speed is not substantially affected.
Code 3 Infrequent curves or grades occur that impair sight distance or
severely affect truck speeds. May have reduced speed limits.
Code 4 Frequent grades occur that impair sight distance or severely
affect truck speeds. Generally, curves are unsafe or
uncomfortable at prevailing speed limit, or the speed limit is
severely restricted due to the design speed limits of the curves.
For rural major collectors, 68.5 percent are rated as Code 1 for horizontal alignment while 58.4 percent are rated as Code 1 for vertical alignment.
Bridge System Conditions
Information relevant to the condition of the Nation's bridges is collected by the State, local, and Federal owners and provided to the Federal Highway Administration (FHWA). The data are maintained by the FHWA in the National Bridge Inventory (NBI) database. This database represents the most comprehensive source of nationwide information on bridges throughout the United States. All data presented in this chapter are from the NBI database as of December 2006.
| There is the perception that bridge failures such as the I-35W bridge collapse are common and that the potential of future collapses of this type is high. Is this correct? | |
|
No. The perception that bridge collapses are a common occurrence is not accurate. When considering the great number of bridges in the Nation, nearly 470,000 bridges in the 2006, the number of failures, such as those referenced below, are extremely rare.
The probable primary cause of the collapse of the I-35W bridge in Minneapolis, MN, as determined by the National Transportation Safety Board (NTSB) was an error in the original design of the gusset plates supporting the bridge. As designed, the gusset plates did not have adequate capacity to carry expected loads for the structure.
The first bridge accident investigated by the NTSB was in 1967. Since that time, the NTSB has investigated six collapses of bridges related to design problems or failure of materials. These investigations were of the Silver Bridge in 1967, the I-95 bridge over the Mianus River in 1983, the U.S. Chickasabogue bridge in 1985, the Schoharie Creek bridge in 1987, the Hatchie River bridge in 1989, and the I-35W bridge in 2007. These six accidents occurred over a period of approximately 40 years.
It must be noted that the investigations of each of these bridge accidents by the NTSB has advanced the knowledge of construction and inspection, improved the quality of the Nation's bridges, and increased the safety of the traveling public.
*Source: Accident Report NTSB/HAR-08/03 PB2008-916203 "Collapse of I-35W Highway Bridge Minneapolis, Minnesota August 1, 2007" Published November 14, 2008
|
|
The National Bridge Inspection Standards (NBIS), in place since the early 1970s, requires safety inspections every 24 months for bridges with lengths of more than 6.1 meters, approximately 20 feet, located on public roads. The conditions and composition of the structures are documented. Baseline composition information collected includes functional characteristics, descriptions and location information, geometric data, ownership and maintenance responsibilities, and other information. This information enables characterization of the system of bridges on a national level and analysis on the composition of the bridges. Safety, the primary purpose of the National Bridge Inspection Program, is ensured through periodic inspections and rating of the primary components of bridges, such as the deck, superstructure, and substructure.
| How often are the bridges inspected? | |
|
Most bridges in the U.S. Highway Bridge inventory are inspected once every 24 months. These inspections are performed by qualified inspectors. Structures with advanced deterioration or other conditions warranting close monitoring can be inspected more frequently. Certain types of structures in very good condition may receive an exemption from the 24-month inspection cycle. These structures that meet minimum criteria may be inspected less frequently. With FHWA approval, these structures may be inspected at intervals that do not exceed 48 months. Qualification for this extended inspection cycle is reevaluated depending on the conditions of the bridge. Approximately 83 percent are inspected once every 24 months, 12 percent are inspected on a 12-month cycle, and 5 percent are inspected on a minimum 48-month cycle.
|
|
Explanation of Bridge Deficiencies
From the information collected through the inspection process, assessments are performed to determine the adequacy of a structure to service the current structural and functional demands; factors considered include load-carrying capacity, deck geometry, clearances, waterway adequacy, and approach roadway alignment. Structural assessments together with condition ratings determine whether a bridge should be classified as "structurally deficient." Functional adequacy is assessed by comparing the existing geometric configurations and design load carrying capacities to current standards and demands. Disparities between the actual and preferred configurations are used to determine whether a bridge should be classified as "functionally obsolete." Structural deficiencies take precedence in the classification of deficiencies, so that a bridge that has been determined to be both structurally deficient and functionally obsolete would be classified as structurally deficient.
| What makes a bridge structurally deficient, and are structurally deficient bridges unsafe? | |
|
Structurally deficient bridges are not inherently unsafe. Bridges are considered structurally deficient if significant load-carrying elements are found to be in poor or worse condition due to deterioration and/or damage, or the adequacy of the waterway opening provided by the bridge is determined to be extremely insufficient to the point of causing intolerable traffic interruptions. That a bridge is deficient does not imply that it is likely to collapse or that it is unsafe. By conducting properly scheduled inspections, unsafe conditions may be identified; if the bridge is determined to be unsafe, the structure must be closed. A deficient bridge, when left open to traffic, typically requires significant maintenance and repair to remain in service and eventual rehabilitation or replacement to address deficiencies. To remain in service, structurally deficient bridges often have weight limits that restrict the gross weight of vehicles using the bridges to less than the maximum weight typically allowed by statute.
|
|
| How does a bridge become functionally obsolete? | |
|
Functional obsolescence is a function of the geometrics of the bridge in relation to the geometrics required by current design standards. While structural deficiencies are generally the result of deterioration of the conditions of the bridge components, functional obsolescence generally results from changing traffic demands on the structure. Facilities, including bridges, are designed to conform to the design standards in place at the time they are designed. Over time, improvements are made to the design requirements. As an example, a bridge designed in the 1930s would have shoulder widths in conformance with the design standards of the 1930s, but current design standards are based on different criteria and require wider bridge shoulders to meet current safety standards. The difference between the required, current-day shoulder width and the 1930s' designed shoulder width represents a deficiency. The magnitude of these types of deficiencies determines whether a bridge is classified as functionally obsolete.
|
|
Condition Ratings
Every structure begins to deteriorate from the completion of construction. Condition ratings have been established to measure the deterioration levels of bridges in a consistent and uniform manner to allow comparison of the condition of bridges on a National level.
The primary considerations in classifying structural deficiencies are the bridge component condition ratings. The NBI database contains ratings on the three primary components of a bridge: the deck, superstructure, and substructure. A bridge deck, the surface on which vehicles travel, is supported by the superstructure. This transfers the load of the deck and the traffic carried to the substructure, which provides support for the bridge.
| What was the condition rating of the I-35W bridge prior to collapse and why wasn't it closed to traffic? | |
|
The last inspection of the I-35W bridge was completed in 2007 prior to the collapse. At that time, it was classified as "Structurally Deficient". The classification of a bridge as structurally deficient does not mean that a bridge is unsafe.
The I-35W bridge was classified as "Structurally Deficient" due to a Superstructure condition rating of "4" on a "0 to 9" scale. Any structure receiving a condition rating of "4" or less for Deck condition, Superstructure condition, or Substructure condition is given the status of "Structurally Deficient". A structurally deficient bridge with any rating of "4" can often remain open but may require inspection on a more frequent basis.
The transition from any given condition rating value to the next lower value can take a long period of time. In the case of the I-35W structure the Superstructure condition rating was "4" from 1991 to 2007, a period of 16 years. The Substructure condition rating was "6" from 1983 to 2007 or a period of 24 years. The Deck condition was rated as "6" from 1991 to 1998 and "5" from 2000 to 2007.
A structure that has received a condition rating of "2" (Critical) will be closely monitored. It is possible the structure may be closed until corrective action is implemented. This is normally the initial condition rating where a structure may be closed in addition to being inspected more frequently.
When a condition rating of "1" (Imminent Failure) is given to a structure it is closed due to the severity of the amount of deterioration of one or more of the major systems of the bridge—deck, superstructure, or substructure.
|
|
Condition ratings are used to describe the existing, in-place status of a component and not its as-built state—the existing condition is compared with an as-new condition. Bridge inspectors assign condition ratings by evaluating the severity of the deterioration of individual bridge components and the extent to which it affects the component being rated. Condition ratings are also used to determine if a culvert is structurally deficient. These ratings provide an overall characterization of the general condition of the entire component being rated and not an indication of localized conditions. Exhibit 3-12 describes the bridge condition ratings in more detail.
| Rating | Condition Category | Description* |
|---|---|---|
| 9 | Excellent | |
| 8 | Very Good | No problems noted. |
| 7 | Good | Some minor problems. |
| 6 | Satisfactory | Structural elements show some minor deterioration. |
| 5 | Fair | All primary structural elements are sound but may have minor section loss, cracking, spalling, or scour. |
| 4 | Poor | Advanced section loss, deterioration, spalling, or scour. |
| 3 | Serious | Loss of section, deterioration, spalling or scour have seriously affected primary structural components. Local failures are possible. Fatigue cracks in steel or shear cracks in concrete may be present. |
| 2 | Critical | Advanced deterioration of primary structural elements. Fatigue cracks in steel or shear cracks in concrete may be present or scour may have removed substructure support. Unless closely monitored, it may be necessary to close the bridge until corrective action is taken. |
| 1 | Imminent Failure | Major deterioration or section loss present in critical structural components, or obvious loss present in critical structural components, or obvious vertical or horizontal movement affecting structural stability. Bridge is closed to traffic, but corrective action may put bridge back in light service. |
| 0 | Failed | Out of service; beyond corrective action. |
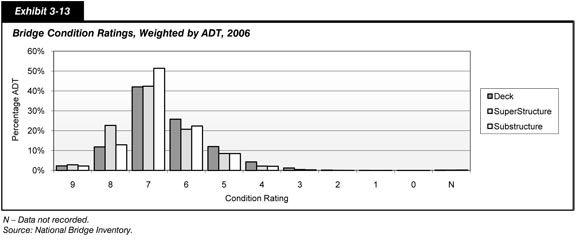
Condition rating distributions are shown in Exhibit 3-13 for decks, superstructures, and substructures for all bridges. Condition ratings of 4 and lower, as defined in Exhibit 3-12, indicate conditions of poor or worse and result in classification as structurally deficient; the majority of the condition ratings are 5 and greater. It should be noted that an individual structure may have more than one deficient component, so these classifications are not mutually exclusive.
Appraisal Ratings
Appraisal ratings are based on an evaluation of bridge characteristics relative to the current standards used for highway and bridge design. Exhibit 3-14 describes appraisal rating codes in more detail.
| Rating | Description |
|---|---|
| N | Not applicable. |
| 9 | Superior to present desirable criteria. |
| 8 | Equal to present desirable criteria. |
| 7 | Better than present minimum criteria. |
| 6 | Equal to present minimum criteria. |
| 5 | Somewhat better than minimum adequacy to tolerate being left in place as-is. |
| 4 | Meets minimum tolerable limits to be left in place as-is. |
| 3 | Basically intolerable requiring a high priority of corrective action. |
| 2 | Basically intolerable requiring a high priority of replacement. |
| 1 | This value of rating code is not used. |
| 0 | Bridge closed. |
Functional and Geometric-Based
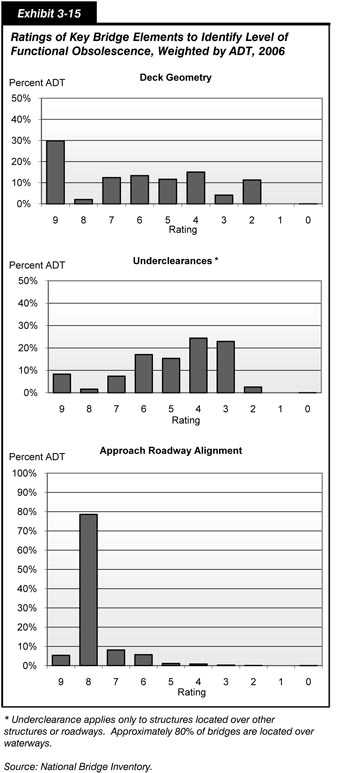
The primary considerations for functional obsolescence focus on functional and geometric-based appraisal ratings, including the deck geometry appraisal rating, the underclearance appraisal rating, and the approach roadway alignment appraisal rating.
Deck geometry ratings reflect the width of the bridge, the minimum vertical clearance of the bridge, the average daily traffic (ADT), the number of lanes carried by the structure, whether two-way or one-way traffic is serviced, and functional classifications. The basis for appraisal rating assignment is the difference between the minimum desired width for the roadways and the actual widths. For example, a bridge having a deck with 11 foot wide lanes would be considered deficient if the current design standards require 12 foot wide lanes.
Underclearance appraisals consider both the vertical and horizontal underclearances as measured from the roadway or railway to the nearest bridge component. For example, a bridge originally built with a vertical clearance of 15 feet would be considered deficient if the current design standards require 16 feet. The functional classification, Federal-aid designation, and defense categorization are all considered for the underpassing route.
Approach alignment ratings differ from the deck geometry and underclearance appraisal ratings in that they are determined by evaluating the existing approach roadway alignment to the bridge as it relates to the general highway alignment for the section of highway the bridge is on rather than comparing approach roadway alignment with current standards. Deficiencies are identified where the bridge route does not function adequately because of alignment disparities.
Exhibit 3-15 identifies the distribution of the percentage of daily bridge traffic for each appraisal rating category based on deck geometry, underclearance, and approach roadway alignment. A rating of 2 or lower indicates a situation typically not correctable without replacement of the structure; the vast majority of travel occurs on structures have ratings of 3 or greater.
Structural Evaluation/Waterway Adequacy
While condition ratings are primarily associated with the designation of bridges as structurally deficient, and functional and geometric-based appraisal ratings are generally associated with the designation of bridges as functional obsolete, structural evaluation and waterway adequacy ratings can result in the classification of a bridge as either structural deficient or functional obsolete.
The structural evaluation appraisal rating is used as a factor for determining whether a bridge has sufficient load-carrying capacity. A rating of 3 indicates that the load-carrying capacity is too low but can be mitigated through corrective action; in this case, the bridge is classified as functionally obsolete. A rating of 2 or lower for the structural evaluation appraisal results in a bridge being classified as structurally deficient; these ratings typically are not correctable without replacement.
As an example, a steel truss bridge built in 1950 would have been designed using the standards of that period, which were based on lighter truck weights than are typical today. If the load-carrying capacity of the bridge was judged to be below the minimum tolerable limits, it would be given a load-carrying capacity of 3 or lower. If it is judged that the structure could be strengthened to meet the current load-carrying standards, it would be rated a 3 and considered functionally obsolete. If it is determined that the structure would need to be replaced in order to meet the current load-carrying standards, it would be rated a 2 and considered to be structurally deficient.
The waterway adequacy appraisal rating describes the opening of the structure with respect to the passage of water flow through the bridge. This rating, which considers the potential for a structure to be submerged during a flood event and the potential inconvenience to the traveling public, is based on criteria assigned by functional classification. Waterway adequacy appraisal ratings of 2 or lower result in bridges being classified as structurally deficient. Waterway adequacy appraisal ratings of 3 result in bridges being classified as functionally obsolete.
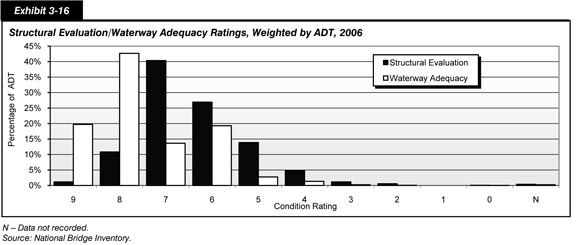
Exhibit 3-16 shows the distribution of structural evaluation appraisal and waterway adequacy ratings, weighted by ADT. As shown in the exhibit, the majority of the ratings are 3 and greater. Waterway adequacy impacts a much smaller percentage of structures than does load-carrying capacity, with less than 0.1 percent of the traffic carried by bridges in the network classified as structurally deficient resulting from waterway adequacy ratings of 2 or below.
Structural deficiency and functional obsolescence are not mutually exclusive, and a bridge may have both types of deficiencies. When deficiency percentages are presented, however, bridges are indicated as being in one of three categories—structurally deficient, functionally obsolete, or non-deficient. If a bridge is classified both structurally deficient and functionally obsolete, it is identified only as structurally deficient. Structural deficiencies are considered more critical because they have the potential to eventually lead to a loss of functionality or even closure unless the bridge is rehabilitated or replaced. Approximately 50 percent of structurally deficient bridges will have functional issues in need of correction, but bridges indicated as functionally obsolete do not have significant structural deficiencies. In other words, functional obsolescence alone does not indicate a bridge that requires rehabilitation or replacement but rather a bridge that, likely due to its build date, does not meet current design standards.
NHS Bridge Condition
Deficiencies by Bridge Deck Area
The FHWA has adopted as primary performance measures for bridge condition the percent of deck area on deficient bridges on the National Highway System (NHS) and the percent of deck area on deficient non-NHS bridges.
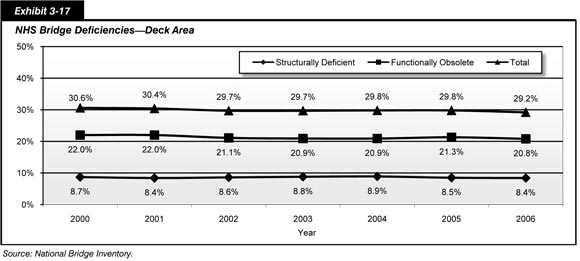
In 2006, the total deck area of bridges on the NHS was over 163 million square meters. The deck area on bridges classified as structurally deficient was slightly greater than 13.7 million square meters, or 8.4 percent of the total deck area for NHS bridges. Bridges classified as functionally obsolete had a total deck area of more than 33.9 million square meters, or 20.8 percent of the total NHS bridge deck area.
The total deck area of bridges considered either structurally deficient or functionally obsolete has decreased since 2000. The percent of deck area on structurally deficient bridges decreased from 8.7 percent in 2000 to 8.4 percent in 2006. During the same period, the deck area on bridges classified as functionally obsolete decreased from 22.0 percent in 2000 to 20.8 percent in 2006. Total deck area on either structurally deficient or functionally obsolete bridges on the NHS dropped from 30.6 percent in 2000 to 29.2 percent in 2006. These data are shown in Exhibit 3-17.
Deficiencies by ADT Carried
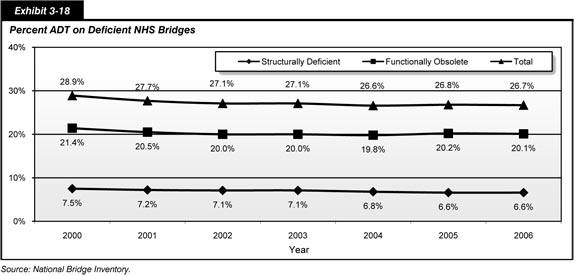
Approximately 7.5 percent of the traffic on NHS bridges in 2000 was on structurally deficient bridges. This decreased to 6.6 percent in 2006. Traffic on functionally obsolete bridges on the NHS decreased from 21.4 percent in 2000 to 20.1 percent on 2006. These data are shown in Exhibit 3-18.
Deficiencies by Number of Bridges
There were 115,203 bridges on the NHS in 2006 compared with approximately 114,556 bridges in 2000. As shown in Exhibit 3-19, 5.5 percent of the NHS bridges in 2006 were classified as structurally deficient. This is a decrease from the 6.0 percent of the NHS bridges classified as structurally deficient in 2000.
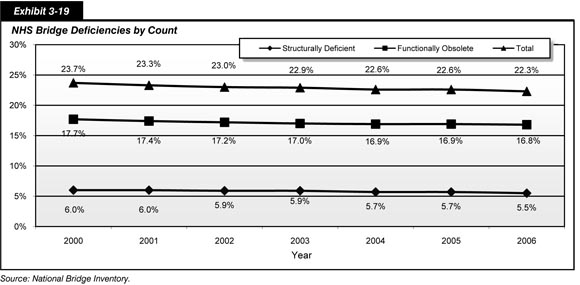
Bridges classified as functionally obsolete in 2006 numbered 19,369, or 16.8 percent. This is a decrease from 20,223 bridges, 17.7 percent, in 2000. The total number of either structurally deficient or functionally obsolete bridges decreased from 27,143 bridges, 23.7 percent of NHS bridges, in 2000 to 25,708, 22.3 percent of the NHS bridges, in 2006.
Interstate System
As stated in Chapter 2 and earlier in this chapter, the Interstate System constitutes a major subset of the NHS. Interstate bridge deficiencies by period built are shown in Exhibit 3-20. Approximately 80 percent—44,192 bridges of the total 55, 270 bridges on the Interstate System—were built between 1951 and 1980. Of the bridges built during this period, 2,684, approximately 6.1 percent, were classified as structurally deficient in 2006. A total of 8,221, approximately 18.6 percent, were classified as functionally obsolete.
| Time Period | Number of Interstate Bridges Built | Percent of Total Interstate Bridges | Structually Deficient Bridges | Percent Structurally Deficient | Functionally Obsolete Bridges | Percent Functionally Obsolete | Total Number Deficient Bridges | Total Percent Deficient |
|---|---|---|---|---|---|---|---|---|
| ≤ 1900 | 5 | 0.0% | – | 0.0% | 1 | 20.0% | 1 | 20.0% |
| 1901–1910 | 32 | 0.1% | 7 | 21.9% | 5 | 15.6% | 12 | 37.5% |
| 1911–1920 | 9 | 0.0% | 3 | 33.3% | 2 | 22.2% | 5 | 55.6% |
| 1921–1930 | 101 | 0.2% | 8 | 7.9% | 20 | 19.8% | 28 | 27.7% |
| 1931–1940 | 540 | 1.0% | 34 | 6.3% | 108 | 20.0% | 142 | 26.3% |
| 1941–1950 | 730 | 1.3% | 52 | 7.1% | 181 | 24.8% | 233 | 31.9% |
| 1951–1960 | 9,193 | 16.6% | 767 | 8.3% | 2,451 | 26.7% | 3,218 | 35.0% |
| 1961–1970 | 23,964 | 43.4% | 1,505 | 6.3% | 4,660 | 19.4% | 6,165 | 25.7% |
| 1971–1980 | 11,035 | 20.0% | 412 | 3.7% | 1,110 | 10.1% | 1,522 | 13.8% |
| 1981–1990 | 5,033 | 9.1% | 52 | 1.0% | 588 | 11.7% | 640 | 12.7% |
| 1991–2000 | 3,076 | 5.6% | 30 | 1.0% | 541 | 17.6% | 571 | 18.6% |
| 2001–2006 | 1,528 | 2.8% | 6 | 0.4% | 267 | 17.5% | 273 | 17.9% |
| Not Reported | 24 | 0.0% | – | 0.0% | 9 | 37.5% | 9 | 37.5% |
| Total | 55,270 | 100.0% | 2,876 | 5.2% | 9,943 | 18.0% | 12,819 | 23.2% |
The 2,684 structurally deficient bridges in this period constitute approximately 93.3 percent of the total number of structurally deficient bridges on the Interstate System. The 8,221 functionally obsolete bridges for the period between 1951 and 1980 account for approximately 82.6 percent of the total number of bridges on the Interstate System classified as functionally obsolete.
Of the 55,270 bridges on the Interstate System in 2006, approximately 5.2 percent, or 2,876 bridges, were classified as structurally deficient and 18 percent, or 9,943 bridges, were classified as functionally obsolete. The total number of bridges on the Interstate System classified as either structurally deficient or functionally obsolete in 2006 was 12,819 bridges, or 23.2 percent.
STRAHNET System
The STRAHNET system is a key subset of the NHS. The physical composition of this system has been described in Chapter 2 and the condition of the pavement portion has been presented earlier in this chapter. There has been no significant change in the percentage of structurally deficient and functionally obsolete bridges on the STRAHNET System since 2004. The share of structurally deficient bridges decreased from 5.1 percent in 2004 to 5.0 percent in 2006. The share of functionally obsolete bridges remained constant at 17.3 percent. The share of bridges either structurally deficient or functionally obsolete remained constant at 22.3 percent. These data are shown in Exhibit 3-21.
| 2004 | 2006 | |
|---|---|---|
| Deficient Bridges | 22.3% | 22.3% |
| Structurally Deficient Bridges | 5.1% | 5.0% |
| Functionally Obsolete Bridges | 17.3% | 17.3% |
Overall Bridge Condition
One commonly cited indicator of bridge condition is the number of deficient bridges. Of the 597,377 bridges listed in the inventory in 2006, 164,971, or slightly less than 27.6 percent, were classified as either structurally deficient or functionally obsolete. Of these, 75,408 (12.6 percent of all bridges) were classified as structurally deficient and 89,563 (15.0 percent of all bridges) were classified as functionally obsolete. Thus, 45.7 percent of the deficiencies were structural and 54.3 percent were functional.
| What is the "10-Year Rule," and how is it applied? | |
|
The FHWA established the "10-Year Rule" for determining a bridge's eligibility for Federal funds after new construction, replacement, or major rehabilitation has taken place. Bridges that have been newly constructed, replaced, or had major rehabilitation within the past 10 years are not considered nor eligible for Federal funds and are not used to apportion Highway Bridge Program funds.
Current laws and regulations permit the building of bridges off the Federal-aid system to design standards (width, clearance, etc.) that may be less than the minimum current design standards for bridges on the Federal-aid system. Newly constructed, replaced, or major rehabilitated bridges built to lesser design standards are often classified functionally obsolete once they are open to traffic. The "10-Year Rule" prevents Federal-aid funds from being used on bridges that were intentionally built to lesser design standards, and it prevents newly constructed, replaced, or major rehabilitated bridges that are immediately in a deficient status from being considered in the apportionment process of the Highway Bridge Program funds for a period of 10 years.
The "10-Year Rule" encourages the States to address all the deficiencies of a bridge at one time rather than separately, which results in multiple traffic disruptions and additional costs. The rule also assists in preventing intentional manipulation of the apportionment process of Highway Bridge Program funds. Without it, States may minimize the amount of improvements on deficient bridges to remain in a safe condition but still in a deficient classification so that the deck areas contribute to a stable or increased apportionment of Highway Bridge Program funds.
In prior C&P reports, the database used to develop the data on the condition of bridges on the Nation's highway system did not include those bridges that fell under the "10-Year Rule." This resulted in lower reported deficiency values. In order to provide a more accurate assessment of the condition of the Nation's bridges, all bridges are included in the data used in this version of the report. Trends in improvement are relatively the same, but the overall deficiency values are higher than in previous reports.
|
|
Exhibit 3-22 shows the overall trend of deficiency percentages from 1996 through 2006. Bridge deficiencies have been reduced primarily through reduction in the numbers of structurally deficient bridges. The percentage of functionally obsolete bridges has remained relatively static over this time period.
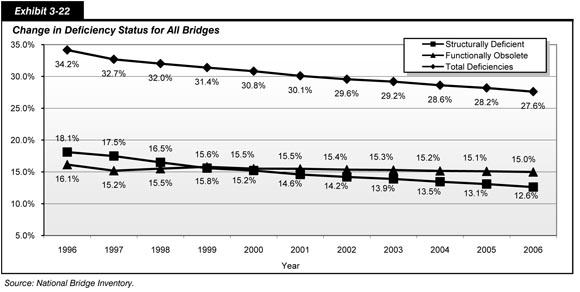
As indicated earlier, structural deficiencies and functional obsolescence are considered mutually exclusive, with structural deficiencies taking precedence where ratings classify a given bridge as both structurally deficient and functionally obsolete. Roughly half of the number of structurally deficient bridges have no functional obsolescence issues and are deficient solely because of deteriorated bridge components. The remaining structurally deficient bridges also have some type of functional obsolescence.
Exhibit 3-23 shows a comparison between bridges on the NHS and bridges not on the NHS (non-NHS). There are 482,174 bridges that are off the NHS, compared to 115,203 bridges on the NHS. However, the total deck area of the bridges on the NHS is nearly equal to the total deck area of the bridges off the NHS, with the deck area of the bridges off the NHS being slightly higher.
| NHS | Non-NHS | Total | |
|---|---|---|---|
| All Bridges | |||
| Total Number of Bridges | 115,203 | 482,174 | 597,377 |
| Total Deck Area of Bridges (sq. meters) | 163,090,974 | 170,633,496 | 333,724,470 |
| Total ADT | 3,019,188,106 | 1,256,100,752 | 4,275,288,858 |
| Structurally Deficient Bridges | |||
| Number of Structurally Deficient Bridges | 6,339 | 69,069 | 75,408 |
| Percent of Structurally Deficient Bridges | 5.5% | 14.3% | 12.6% |
| Deck Area of Structurally Deficient Bridges (sq. meters) | 13,702,644 | 18,435,417 | 32,138,060 |
| Percent of Deck Area of Structurally Deficient Bridges | 8.4% | 10.8% | 9.6% |
| ADT on Structurally Deficient Bridges | 198,113,588 | 116,942,892 | 315,056,480 |
| Percent of ADT on Structurally Deficient Bridges | 6.6% | 9.3% | 7.4% |
| Functionally Obsolete Bridges | |||
| Number of Functionally Obsolete Bridges | 19,369 | 70,194 | 89,563 |
| Percent of Functionally Obsolete Bridges | 16.8% | 14.6% | 15.0% |
| Deck Area of Functionally Obsolete Bridges (sq. meters) | 33,948,462 | 33,895,556 | 67,844,019 |
| Percent of Deck Area of Functionally Obsolete Bridges | 20.8% | 19.9% | 20.3% |
| ADT on Functionally Obsolete Bridges | 606,839,658 | 330,056,558 | 936,896,216 |
| Percent of ADT on Functionally Obsolete Bridges | 20.1% | 26.3% | 21.9% |
| Structurally Deficient and Functionally Obsolete Bridges | |||
| Total Number of Structurally Deficient/Functionally Obsolete Bridges | 25,708 | 139,263 | 164,971 |
| Percent of Structurally Deficient/Functionally Obsolete Bridges | 22.3% | 28.9% | 27.6% |
| Total Deck Area on Structurally Deficient/Functionally Obsolete Bridges | 47,651,106 | 52,330,973 | 99,982,079 |
| Total Percent of Deck Area on Structurally Deficient/Functionally Obsolete Bridges | 29.2% | 30.7% | 30.0% |
| Total ADT on Structurally Deficient/Functionally Obsolete Bridges | 804,953,246 | 446,999,450 | 1,251,952,696 |
| Total Percent of ADT on Structurally Deficient/Functionally Obsolete Bridges | 26.7% | 35.6% | 29.3% |
The most significant characteristic difference between NHS bridges and non-NHS bridges is the total ADT carried. Slightly more than 3 billion ADT are carried on the bridges on the NHS, while approximately 1.2 billion are carried on non-NHS bridges. NHS bridges carry the over 70 percent of the national ADT compared to approximately 29 percent carried by non-NHS bridges.
Deficient Bridges by Owner
Bridge deficiencies by ownership are examined in Exhibit 3-24. For Federally owned bridges, the 1,599 bridges classified as functionally obsolete outweighs the 740 bridges classified as structurally deficient by a ratio of more than 2 to 1. Similar percentages are seen for State-owned bridges, with 48,219 classified as functionally obsolete and 24,222 classified as structurally deficient. These bridges constitute a much more significant proportion of the overall inventory of structures because State agencies own approximately 48 percent of all bridges. Locally owned bridges have an opposite trend, with the number of structurally deficient bridges, 49,869, outnumbering the number of functionally obsolete bridges, 39,149.
| Federal | State | Local | Private/Other | Total | |
|---|---|---|---|---|---|
| Numbers | |||||
| Total Bridges | 8,355 | 284,668 | 301,912 | 2,627 | 597,562 |
| Total Deficient | 2,339 | 72,441 | 89,018 | 1,216 | 165,014 |
| Structurally Deficient | 740 | 24,222 | 49,869 | 591 | 75,422 |
| Functionally Obsolete | 1,599 | 48,219 | 39,149 | 625 | 89,592 |
| Percentages | |||||
| Percent of Total Inventory for Owner | 1% | 48% | 51% | 0% | 100.0% |
| Percent Deficient | 28% | 25% | 29% | 46% | 27.6% |
| Percent Structurally Deficient | 9% | 9% | 17% | 22% | 12.6% |
| Percent Functionally Obsolete | 19% | 17% | 13% | 24% | 15.0% |
Examination of ownership percentages for structurally deficient and functionally obsolete bridges reveals that the majority of structurally deficient bridges are owned by local agencies, while the majority of functionally obsolete bridges are owned by State agencies. These percentages can be contrasted with the ownership percentages for all bridges. The percentages are dominated by State and local ownership, with only small percentages of the total population of all structures owned by Federal, private, and other owners. However, it should be noted that 46 percent of privately owned bridges are deficient: 22 percent are structurally deficient and 24 percent are functionally obsolete.
Rural and Urban Deficient Bridges by Functional Classification
As noted in Chapter 2 and shown in Exhibit 3-25, the majority of bridges are located in rural environments. With rural bridges, the number of structural deficiencies (62,515) outweighs the number of bridges classified as functionally obsolete (53,004). With urban bridges, the number of structurally deficient bridges (12,884) is significantly lower than the number of functionally obsolete bridges (36,542). Overall, a higher percentage of urban structures are classified as deficient; however, the majority of these deficiencies result from functional obsolescence. While the percentage of rural bridges classified as deficient is lower, the population and therefore the total number of deficiencies is larger.
Bridge conditions in rural and urban areas have steadily improved over the past decade. As seen in Exhibit 3-26, overall deficiencies and structural deficiencies have both decreased. Functional obsolescence percentages, however, have not decreased and have remained relatively static in both rural and urban environments.
| Functional System | Total Number of Structures | Structurally Deficient | Functionally Obsolete | Total Deficiencies |
|---|---|---|---|---|
| Rural | ||||
| Interstate | 26,632 | 1,148 | 3,189 | 4,337 |
| Other Principal Arterial | 35,763 | 1,830 | 3,379 | 5,209 |
| Minor Arterial | 39,517 | 3,268 | 4,359 | 7,627 |
| Major Collector | 93,603 | 10,448 | 9,833 | 20,281 |
| Minor Collector | 48,635 | 6,181 | 5,777 | 11,958 |
| Local | 207,101 | 39,640 | 26,467 | 66,107 |
| Subtotal Rural | 451,251 | 62,515 | 53,004 | 115,519 |
| Urban | ||||
| Interstate | 28,635 | 1,728 | 6,754 | 8,482 |
| Other Freeway and Expressway | 17,985 | 1,047 | 4,152 | 5,199 |
| Other Principal Arterial | 26,051 | 2,275 | 6,387 | 8,662 |
| Minor Arterial | 26,238 | 2,620 | 7,717 | 10,337 |
| Collector | 17,616 | 1,940 | 5,060 | 7,000 |
| Local | 29,499 | 3,274 | 6,472 | 9,746 |
| Subtotal Urban | 146,024 | 12,884 | 36,542 | 49,426 |
| Total Identified by Functional System | 597,275 | 75,399 | 89,546 | 164,945 |
| Unknown | 102 | 9 | 17 | 26 |
| Total, Including Unknown | 597,377 | 75,408 | 89,563 | 164,971 |
| Year | 1996 | 1998 | 2000 | 2002 | 2004 | 2006 | |
|---|---|---|---|---|---|---|---|
| Interstates | |||||||
| Rural | Deficient Bridges | 21.3% | 17.7% | 17.2% | 17.0% | 17.1% | 16.3% |
| Rural | Structurally Deficient | 4.6% | 4.3% | 4.0% | 4.1% | 4.3% | 4.3% |
| Rural | Functionally Obsolete | 16.7% | 13.5% | 13.2% | 12.9% | 12.8% | 12.0% |
| Urban | Deficient Bridges | 35.7% | 30.8% | 30.6% | 29.5% | 29.6% | 29.6% |
| Urban | Structurally Deficient | 8.1% | 7.1% | 6.7% | 6.5% | 6.3% | 6.0% |
| Urban | Functionally Obsolete | 27.5% | 23.6% | 23.8% | 23.0% | 23.3% | 23.6% |
| All Bridges on Interstates | Deficient Bridges | 28.2% | 24.2% | 23.9% | 23.3% | 23.3% | 23.2% |
| All Bridges on Interstates | Structurally Deficient | 6.3% | 5.7% | 5.4% | 5.3% | 5.3% | 5.2% |
| All Bridges on Interstates | Functionally Obsolete | 21.9% | 18.6% | 18.5% | 18.0% | 18.0% | 18.0% |
| Other Arterials | |||||||
| Rural | Deficient Bridges | 22.6% | 20.4% | 19.2% | 18.4% | 17.8% | 17.1% |
| Rural | Structurally Deficient | 9.3% | 8.5% | 7.4% | 7.2% | 7.0% | 6.8% |
| Rural | Functionally Obsolete | 13.3% | 12.0% | 11.8% | 11.2% | 10.8% | 10.3% |
| Urban | Deficient Bridges | 39.4% | 37.7% | 36.5% | 35.6% | 35.1% | 34.4% |
| Urban | Structurally Deficient | 12.1% | 11.0% | 9.8% | 9.3% | 8.8% | 8.5% |
| Urban | Functionally Obsolete | 27.4% | 26.7% | 26.7% | 26.4% | 26.3% | 26.0% |
| All Bridges on Other Arterials | Deficient Bridges | 30.1% | 28.3% | 27.1% | 26.5% | 25.8% | 25.4% |
| All Bridges on Other Arterials | Structurally Deficient | 10.5% | 9.6% | 8.5% | 8.2% | 7.8% | 7.6% |
| All Bridges on Other Arterials | Functionally Obsolete | 19.6% | 18.6% | 18.6% | 18.3% | 18.0% | 17.9% |
| Collectors | |||||||
| Rural | Deficient Bridges | 27.1% | 25.8% | 25.3% | 24.6% | 23.7% | 22.7% |
| Rural | Structurally Deficient | 15.2% | 14.2% | 13.5% | 12.9% | 12.3% | 11.7% |
| Rural | Functionally Obsolete | 11.9% | 11.6% | 11.8% | 11.7% | 11.4% | 11.0% |
| Urban | Deficient Bridges | 44.2% | 42.1% | 41.0% | 39.7% | 39.7% | 39.7% |
| Urban | Structurally Deficient | 16.1% | 14.7% | 12.9% | 11.6% | 11.1% | 11.0% |
| Urban | Functionally Obsolete | 28.1% | 27.4% | 28.1% | 28.1% | 28.6% | 28.7% |
| All Bridges on Collectors | Deficient Bridges | 28.7% | 27.4% | 26.8% | 26.0% | 25.3% | 25.4% |
| All Bridges on Collectors | Structurally Deficient | 15.3% | 14.2% | 13.4% | 12.8% | 12.2% | 11.6% |
| All Bridges on Collectors | Functionally Obsolete | 13.4% | 13.1% | 13.4% | 13.2% | 13.1% | 12.9% |
| Locals | |||||||
| Rural | Deficient Bridges | 42.0% | 39.5% | 37.5% | 35.5% | 33.9% | 31.9% |
| Rural | Structurally Deficient | 28.3% | 25.6% | 23.9% | 22.0% | 20.7% | 19.1% |
| Rural | Functionally Obsolete | 13.6% | 13.8% | 13.6% | 13.5% | 13.2% | 12.8% |
| Urban | Deficient Bridges | 37.7% | 35.9% | 34.7% | 33.6% | 33.5% | 33.0% |
| Urban | Structurally Deficient | 16.0% | 14.9% | 13.4% | 12.1% | 11.5% | 11.1% |
| Urban | Functionally Obsolete | 21.7% | 21.1% | 21.3% | 21.4% | 22.0% | 21.9% |
| All Bridges on Locals | Deficient Bridges | 41.6% | 39.1% | 37.2% | 35.3% | 33.8% | 32.1% |
| All Bridges on Locals | Structurally Deficient | 27.1% | 24.5% | 22.7% | 20.9% | 19.6% | 18.1% |
| All Bridges on Locals | Functionally Obsolete | 14.5% | 14.6% | 14.5% | 14.4% | 14.2% | 13.9% |
Culvert Conditions
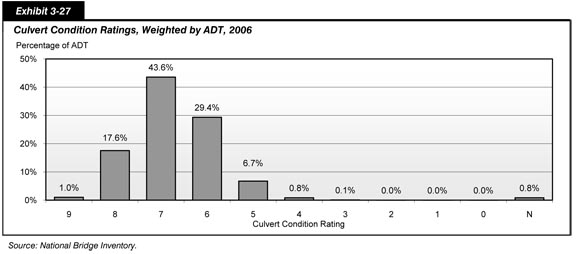
There are 124,843 culverts in the bridge inventory. These structures do not have a deck, superstructure, or substructure, but rather are self-contained units located under roadway fill. Culverts are typically constructed of concrete or corrugated steel. Multiple pipes or boxes placed side-by-side are considered to be a structure and are included in the National Bridge Inventory given that together they span a total length in excess of 6.1 meters and carry a public roadway. As these structures lack decks, superstructures, and substructures, individual ratings are provided to indicate the condition of the culvert as a whole. The distribution of culvert condition ratings weighted by ADT is shown in Exhibit 3-27. Of all 124,843 culverts in the inventory, approximately 0.9 percent are classified as structurally deficient based on condition ratings less than or equal to 4 (poor conditions).
Transit System Conditions
The condition of the U.S. transit infrastructure can be evaluated based on the quantity, the age, and the physical condition of the assets that comprise it. This infrastructure includes vehicles in service, maintenance facilities and the equipment they contain, and other supporting infrastructure such as guideways, power systems, rail yards, stations, and structures like bridges and tunnels.
The Federal Transit Administration (FTA) uses a numerical condition rating scale ranging from 1 to 5, detailed in Exhibit 3-28, to describe the relative deterioration of transit assets. It is important to note that the numerical scale used by FTA is continuous, meaning that condition ratings may take on any value within the 1 to 5 interval. This scale corresponds to the Present Serviceability Rating formerly used by the Federal Highway Administration to evaluate pavement conditions. A rating of 5, or "excellent," indicates that the asset is in nearly new condition or lacks visible defects. At the other end of the scale, a rating of 1 indicates that the asset needs immediate repair and may have one or more seriously damaged components.
| Rating | Condition | Description |
|---|---|---|
| Excellent | 5 | No visible defects, near new condition. |
| Good | 4 | Some slightly defective or deteriorated components. |
| Adequate | 3 | Moderately defective or deteriorated components. |
| Marginal | 2 | Defective or deteriorated components in need of replacement. |
| Poor | 1 | Seriously damaged components in need of immediate repair. |
The FTA uses the Transit Economic Requirements Model (TERM) to estimate the conditions of transit assets. This model comprises a database of transit assets and deterioration schedules that express asset conditions principally as a function of an asset's age. Vehicle condition is based on an estimate of vehicle maintenance history and major rehabilitation expenditures in addition to vehicle age; the conditions of wayside control systems and track are based on an estimate of use (revenue miles per mile of track) in addition to age. For the purposes of this report, state of good repair was defined using TERM's numerically based system for evaluating transit asset conditions. Specifically, this report considers an asset to be in a state of good repair when the physical condition of that asset is at or above a specific condition rating value of 2.5 (the mid-point between adequate and marginal). Similarly, an entire transit system would be in a state of good repair if all of its assets have an estimated condition value of 2.5 or higher. The level of investment required to attain and maintain a state of good repair is therefore that amount required to rehabilitate and replace all assets with estimated condition ratings that are less than this minimum condition value.
| How do the criteria used in the C&P report compare to the Rail Modernization report criteria? | |
|
For the purposes of the Rail Modernization study, released by FTA in April 2009, a state of good repair was defined using TERM's numerically based condition rating system of 1 to 5 (poor to excellent) for evaluating transit asset conditions. Specifically, the Rail Modernization study considered an asset to be in a state of good repair when the physical condition of that asset is at or above a specific condition rating value of 2.5 (the mid-point between adequate and marginal). Similarly, an entire transit system would be in a state of good repair if all of its assets have an estimated condition value of 2.5 or higher. The level of investment required to attain and maintain a state of good repair is therefore that amount required to rehabilitate and replace all assets with estimated condition ratings that are less than this minimum condition value.
The percent of transit vehicles below a condition of 2.5 is used in this report as a measure of the share of vehicles that have exceeded their useful life. This replaces the over-age criteria used in previous C&P reports that were based on FTA's minimum vehicle replacement ages. The analysis in this version of the C&P report, as in past versions, is focused on scenarios that depict the level of investment required to maintain or improve average asset conditions at specific target level. When assets with conditions below 2.5 are slated for replacement, a test is used to eliminate replacements where the benefits do not outweigh the costs. This additional cost-benefit criterion was not applied to similar analyses in the Rail Modernization study.
|
|
The deterioration schedules for vehicles; maintenance facilities; stations; and train control, electrification, and communication systems have been estimated by FTA with special on-site engineering surveys. Transit vehicle asset conditions also reflect the most recently available information on vehicle age, use, and level of maintenance from the National Transit Database (NTD) and data collected through special surveys. The information used in this report is for 2006. Age information is available on a vehicle-by-vehicle basis from the NTD and collected for all other assets through special surveys. Average maintenance expenditures and major rehabilitation expenditures by vehicle are also available on an agency and modal basis. Therefore, for the purpose of calculating conditions, average agency maintenance and rehabilitation expenditures for a particular mode are assumed to be the same for all vehicles operated by an agency in that mode. Because agency maintenance expenditures may fluctuate from year to year, TERM uses a 5-year average.
The deterioration schedules for guideway structures and track are based on much earlier studies. The methods used to calculate deterioration schedules and the sources of the data on which deterioration schedules are based are discussed in Appendix C.
Condition estimates in each new edition of the C&P report are based on updated asset inventory information and reflect updates in TERM's asset inventory. Since the 2006 C&P Report, asset data for approximately 71 percent of the Nation's transit assets have been updated. Data from the NTD were used to update asset records for the Nation's transit vehicle fleets. In addition, updated asset inventory data were collected from nine of the Nation's larger rail transit and bus agencies. Appendix C provides a more detailed discussion of TERM's data sources.
Bus Vehicles (Urban Areas)
Bus vehicle age and condition information is reported according to bus vehicle type for 1997 to 2006 in Exhibit 3-29. Based on a weighted average condition rating of all bus types, conditions gradually improved for buses from 1997 to 2004, on a revised basis for 2002 and 2004. Between 2004 and 2006, articulated, full-size, mid-size, and small buses experienced a slight decline in conditions; however, vans improved for that time period. In 2006, the estimated average condition rating of the urban bus fleet was 3.01 compared with 3.08 in 2004 and 2.94 in 1997; all condition estimates prior to 2002 are based on a different bus vehicle classification system, but the reclassification of vehicles had only a small impact on the condition estimates for the total bus fleet. The improvement in conditions between 1997 and 2004 reflects a decrease in the average age of the bus vehicle fleet from 6.6 to 6.1 years. For 2006, the average age of 6.1 years was maintained. Since 1997, larger vehicles (i.e., articulated, full-size, and mid-size buses) have tended to have, on average, slightly lower-rated conditions than smaller vehicles (i.e., small buses, vans). Vans, paratransit vehicles, and small buses, in general, decay more rapidly than full-size buses. Vans typically reach a condition rating of 2.50 in 7 years, compared with 14 years, on average, for a 40-foot bus. After the period of continual investment from 1997 to 2004 and gradual improvement in estimated average condition ratings, the overall decline in urban transit bus fleet average estimated conditions in 2006 is driven by lifecycle procurement fluctuations. Average bus fleet condition ratings vary considerably from agency to agency, ranging from 2.30 to 4.40 for the 31 agencies that participated in the most recent FTA bus vehicle conditions assessment in 2002.
| Revised Basis | |||||||
|---|---|---|---|---|---|---|---|
| 1997 | 1999 | 2000 | 2002 | 2004 | 2006 | ||
| Articulated Buses | |||||||
| Fleet Count | 1,523 | 1,967 | 2,078 | 2,765 | 3,060 | 3,422 | |
| Average Age (Years) | 11.8 | 8.7 | 6.9 | 7.1 | 4.9 | 5.4 | |
| Average Condition Rating | 2.49 | 3.10 | 3.33 | 3.11 | 3.38 | 3.17 | |
| Below Condition 2.50 (Percent) | 54.8% | 35.1% | 28.7% | 30.6% | 11.6% | 9.0% | |
| Full-Size Buses | |||||||
| Fleet Count | 47,149 | 49,195 | 49,721 | 46,685 | 46,090 | 45,260 | |
| Average Age (Years) | 8.2 | 8.7 | 8.5 | 7.5 | 7.3 | 7.4 | |
| Average Condition Rating | 2.86 | 2.90 | 2.93 | 3.02 | 3.00 | 2.95 | |
| Below Condition 2.50 (Percent) | 35.6% | 35.0% | 33.8% | 32.7% | 31.0% | 25.0% | |
| Mid-Size Buses | |||||||
| Fleet Count | 5,328 | 6,807 | 7,643 | 7,304 | 7,114 | 6,893 | |
| Average Age (Years) | 5.6 | 5.7 | 5.7 | 8.1 | 8.1 | 8.1 | |
| Average Condition Rating | 3.30 | 3.30 | 3.30 | 2.93 | 2.93 | 2.86 | |
| Below Condition 2.50 (Percent) | 15.7% | 13.3% | 14.4% | 26.6% | 23.3% | 27.9% | |
| Small Buses | |||||||
| Fleet Count | 7,081 | 8,461 | 9,039 | 14,857 | 15,981 | 17,441 | |
| Average Age (Years) | 3.7 | 4.0 | 4.2 | 4.5 | 4.8 | 5.1 | |
| Average Condition Rating | 3.56 | 3.51 | 3.47 | 3.39 | 3.37 | 3.26 | |
| Below Condition 2.50 (Percent) | 3.9% | 4.4% | 4.1% | 51.1% | 8.6% | 11.1% | |
| Vans | |||||||
| Fleet Count | 13,796 | 14,539 | 16,234 | 17,300 | 19,164 | 21,982 | |
| Average Age (Years) | 2.3 | 3.2 | 3.2 | 3.2 | 3.5 | 3.2 | |
| Average Condition Rating | 3.75 | 3.71 | 3.71 | 3.62 | 3.61 | 3.74 | |
| Below Condition 2.50 (Percent) | 1.3% | 0.9% | 1.2% | 1.2% | 1.5% | 1.9% | |
| Total Bus | |||||||
| Total Fleet Count | 74,877 | 80,969 | 84,715 | 88,911 | 91,409 | 94,998 | |
| Weighted Average Age (Years) | 6.6 | 7.0 | 6.8 | 6.2 | 6.1 | 6.1 | |
| Weighted Average Condition Rating | 2.94 | 3.01 | 3.05 | 3.07 | 3.08 | 3.01 | |
| Below Condition 2.50 (Percent) | 26.7% | 23.9% | 23.1% | 22.3% | 19.3% | 17.6% | |
Articulated buses experienced the largest fluctuations in condition ratings between 1997 and 2006, improving from 2.49 in 1997 to 3.17 in 2006. This fluctuation peaked in 2004 with an average estimated condition of 3.38, and is most likely the result of a 12-year industry replacement policy and the fact that many of these articulated buses were purchased between 1983 and 1984; because vehicle age frequently exceeds the recommended replacement age, the gradual replacement of articulated buses starting around 1997 would be consistent with the 12-year replacement policy. Mid-size buses maintained an average condition rating above 3.00 in all years based on the old bus classification systems. However, based on the new classification system, their average condition rating fell from 3.30 in 2000 to 2.86 in 2006 as a considerable number of these vehicles in better-than-average condition for this category were reclassified as small buses. Vans consistently maintained an average condition rating of between 3.61 and 3.75 while the rating of small buses declined from 3.56 in 1997 to 3.26 in 2006. This is partially the result of vehicles being reclassified from the full and mid-size bus categories to the small bus category. Full-size buses, which were on average consistently just below "adequate" condition between 1997 and 2000, reached an adequate average condition rating of 3.00 in 2004, but declined to 2.95 in 2006.
| How were bus vehicles reclassified in 2002? | |
|
The 2002 NTD collected information on buses according to length and seating capacity. Previously, bus information had been collected according to the number of seats only, except for articulated buses, which were reported separately. Two condition estimates are reported for 2002 in Exhibit 3-28, showing average conditions based on both the old classification system and on the new classification system. The 2002 NTD data on length revealed that a larger percentage of buses were 45 feet or longer than was previously estimated. Because all buses 45 feet or longer must be articulated for structural reasons, 458 vehicles were moved from the full-size bus category to the articulated bus category. A considerable number of buses that were previously categorized as full-size and mid-size (4,761) were reclassified as small. The number of articulated buses increased by 20 percent as a result of the reclassification, the number of full-size buses decreased by 7 percent, the number of mid-size buses decreased by 18 percent, and the number of small buses increased by 47 percent. Vans were not affected by the reclassification.
|
|
Bus Maintenance Facilities (Urban Areas)
The number of urban maintenance facilities for bus, vanpool, and demand response systems for directly operated and purchased transit services increased significantly from 1,207 in 2004 to 1,280 in 2006. Exhibit 3-30 provides the estimated age distribution of these maintenance facilities in 2006. This distribution is based on age information collected by the 1999 and 2002 National Bus Condition Assessments and applied to the total national bus maintenance facilities in 2006 as reported in the NTD. In 2006, 26.4 percent of bus maintenance facilities were estimated to be younger than 10 years old (compared with 10.4 percent in 2004), 24.6 percent were estimated to be 11 to 20 years old (compared with 41.8 percent in 2004), 40.8 percent were estimated to be 21 to 30 years of age (compared with 23.6 percent in 2004), and 8.2 percent were estimated to be 31 years or older (compared with 24.1 percent in 2004). It is important to note that individual facility ages may not relate well to condition, since substantive renovations are made to facilities at varying intervals.
| Age (Years) | Count | Percent |
|---|---|---|
| 0–10 | 337 | 26.4% |
| 11–20 | 315 | 24.6% |
| 21–30 | 523 | 40.8% |
| 31+ | 105 | 8.2% |
| Total | 1,280 | 100.0% |
The estimated average condition rating of bus maintenance facilities, including those used for vans and demand response vehicles, declined from 3.41 in 2004 to 3.26 in 2006. In 2006, 16.4 percent of all urban bus maintenance facilities were estimated to be in excellent condition (compared with 17.3 percent in 2004), 5.4 percent were estimated to be in "good" condition (compared with 5.2 percent in 2004), and 41.9 percent were estimated to be in adequate condition (compared with 45.7 percent in 2004). Combined, 63.6 percent of all urban bus maintenance facilities were estimated to be in adequate or better condition in 2006 and 36.4 percent were estimated to be in marginal or worse condition in 2006, compared with 68.1 percent estimated to be in adequate or better condition and 31.9 percent estimated to be in marginal or worse condition in 2004. These data are presented in Exhibit 3-31.
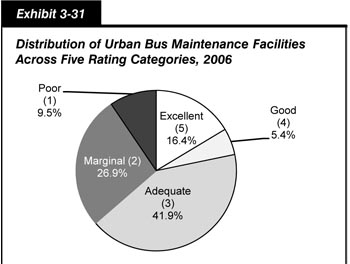
| Condition Rating | Count | Percent |
|---|---|---|
| Excellent (5) | 210 | 16.4% |
| Good (4) | 69 | 5.4% |
| Adequate (3) | 536 | 41.9% |
| Marginal (2) | 344 | 26.9% |
| Poor (1) | 121 | 9.5% |
| Total | 1,280 | 100.0% |
Rail Vehicles
As shown in Exhibit 3-32, the average rail vehicle condition increased from 3.50 in 2004 to 3.51 in 2006. This corresponded with an increase in the average vehicle age from 19.7 to 19.8 years. By comparison, in 1997 the average rail vehicle condition rating was 3.42 with an average age of 20.4 years. Average rail vehicle age and condition are heavily influenced by the average age and condition of heavy rail vehicles, which in 2006 accounted for 55.8 percent of the total U.S. rail fleet. Further, 21.9 percent of the heavy rail fleet is considered below a condition of 2.5, or below a state of good repair. The total urban transit rail fleet estimated to be below an average condition of 2.5 is 13.2 percent. All rail vehicles combined have been, on average, in slightly better condition than all bus and bus-type vehicles during the 1997 to 2006 period.
| 1997 | 1999 | 2000 | 2002 | 2004 | 2006 | |
|---|---|---|---|---|---|---|
| Commuter Rail Locomotives | ||||||
| Fleet Count | 586 | 644 | 591 | 709 | 772 | 797 |
| Average Age (Years) | 16.5 | 16.1 | 15.8 | 16.9 | 18.0 | 16.9 |
| Average Condition Rating | 3.70 | 3.82 | 3.77 | 3.72 | 3.72 | 3.72 |
| Below Condition 2.50 (Percent) | 0.0% | 0.0% | 0.0% | 1.7% | 2.0% | 1.8% |
| Commuter Rail Passenger Coaches | ||||||
| Fleet Count | 2,470 | 2,886 | 2,793 | 2,985 | 3,549 | 3,520 |
| Average Age (Years) | 19.8 | 18.5 | 17.7 | 19.0 | 17.8 | 18.8 |
| Average Condition Rating | 3.68 | 3.74 | 3.76 | 3.68 | 3.78 | 3.69 |
| Below Condition 2.50 (Percent) | 0.0% | 0.0% | 0.0% | 2.4% | 1.7% | 1.8% |
| Commuter Rail Self-Propelled Passenger Coaches | ||||||
| Fleet Count | 2,681 | 2,455 | 2,472 | 2,389 | 2,447 | 2,582 |
| Average Age (Years) | 22.0 | 24.3 | 25.2 | 27.1 | 23.6 | 16.0 |
| Average Condition Rating | 3.62 | 3.57 | 3.55 | 3.50 | 3.69 | 4.03 |
| Below Condition 2.50 (Percent) | 0.0% | 0.0% | 0.0% | 0.0% | 0.0% | 0.0% |
| Heavy Rail | ||||||
| Fleet Count | 10,173 | 10,366 | 10,375 | 11,093 | 11,046 | 11,126 |
| Average Age (Years) | 21.0 | 22.5 | 23.0 | 20.0 | 19.8 | 21.6 |
| Average Condition Rating | 3.31 | 3.26 | 3.25 | 3.41 | 3.35 | 3.30 |
| Below Condition 2.50 (Percent) | 11.6% | 22.1% | 22.8% | 18.5% | 16.8% | 21.9% |
| Light Rail | ||||||
| Fleet Count | 1,132 | 1,400 | 1,524 | 1,637 | 1,884 | 1,920 |
| Average Age (Years) | 14.6 | 18.9 | 18.4 | 16.1 | 16.5 | 15.8 |
| Average Condition Rating | 3.63 | 3.62 | 3.63 | 3.61 | 3.60 | 3.63 |
| Below Condition 2.50 (Percent) | 9.7% | 8.4% | 8.4% | 11.8% | 11.0% | 6.2% |
| Total Rail | ||||||
| Fleet Count | 17,042 | 17,751 | 17,755 | 18,813 | 19,698 | 19,945 |
| Weighted Average Age (Years) | 20.4 | 21.6 | 21.8 | 20.4 | 19.7 | 19.8 |
| Weighted Average Condition Rating | 3.42 | 3.40 | 3.38 | 3.47 | 3.50 | 3.51 |
| Below Condition 2.50 (Percent) | 7.8% | 13.6% | 14.2% | 12.6% | 11.2% | 13.2% |
Changes in ages and conditions of all rail vehicles appear to fall within the range of normal depreciation, rehabilitation, and replacement cycles. Although condition is often correlated with age, it is also correlated with preventive maintenance expenditures and vehicle rehabilitations. For this reason, a slight increase in average age may be accompanied by a slight decrease in condition or vice versa.
Rail Maintenance Facilities
As shown in Exhibit 3-33, in 2006, 54.2 percent of all rail facilities were estimated to be 10 years old or younger (compared with 50.7 percent in 2004), 13.9 percent were estimated to be 11 to 20 years old (compared with 24.3 percent in 2004), 7.0 percent were estimated to be 21 to 30 years old (compared with 12.5 percent in 2004), and 24.9 percent were estimated to be 31 years old or older (compared with 12.5 percent in 2004.). These revisions reflect updated inventory information collected since the 2004 report.
| Age (Years) | Count | Percent |
|---|---|---|
| 0–10 | 109 | 54.2% |
| 11–20 | 28 | 13.9% |
| 21–30 | 14 | 7.0% |
| 31+ | 50 | 24.9% |
| Total | 201 | 100.0% |
Including the updated inventory information, the estimated condition rating of these facilities decreased from 3.82 in 2004 to 3.68 in 2006. As shown in Exhibit 3-34, in 2006, 20.9 percent of facilities were estimated to be in excellent condition, 9.4 percent were estimated to be in good condition, 43.5 percent were estimated to be in adequate condition, 25.4 percent were estimated to be in marginal condition, and only 0.8 percent were estimated to be in poor condition.
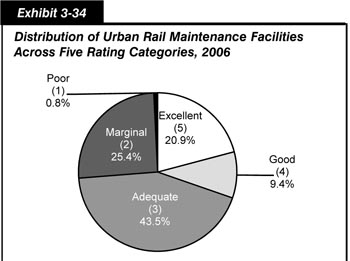
| Condition Rating | Count | Percent |
|---|---|---|
| Excellent (5) | 42 | 20.9% |
| Good (4) | 19 | 9.4% |
| Adequate (3) | 87 | 43.5% |
| Marginal (2) | 51 | 25.4% |
| Poor (1) | 2 | 0.8% |
| Total | 201 | 100.0% |
Rail Stations
The estimated condition rating of rail stations increased from 3.37 in 2004 to 3.53 in 2006. As shown in Exhibit 3-35, 65.7 percent were estimated to be in adequate or better condition (compared with 48.9 percent in 2004) and 34.3 percent were estimated to be in marginal or worse condition (compared with 51.1 percent in 2004).
| How does the condition of nonrail stations compare with the condition of rail stations? | |
|
Nonrail stations are generally in better condition than rail stations. The condition rating of nonrail stations decreased from 4.23 in 2004 to 4.08 in 2006. Surveys of nonrail stations have not been conducted. Nonrail stations are assumed to have the same deterioration schedules as light rail. The condition rating of stations for all modes combined decreased from 3.43 in 2004 to 3.38 in 2006. Rail stations dominate this average.
|
|

| Condition Rating | Count | Percent |
|---|---|---|
| Excellent (5) | 387 | 12.7% |
| Good (4) | 370 | 12.2% |
| Adequate (3) | 1243 | 40.8% |
| Marginal (2) | 951 | 31.3% |
| Poor (1) | 93 | 3.0% |
| Total | 3,043 | 100.0% |
Rail Systems
Exhibit 3-36 presents the physical condition of U.S. transit rail infrastructure and provides estimated average conditions for different types of rail systems, including train control, traction power, communications, and revenue collection. Historically, FTA has estimated the relative condition of rail systems using dollar amounts spent on different asset classes. This is still true, as shown by the percentages displayed across asset condition levels; however, this report also provides estimates of average condition by asset type, a new development since the release of the 2006 C&P Report.
| Condition Rating (Percent) | ||||||||||||
|---|---|---|---|---|---|---|---|---|---|---|---|---|
| Condition Estimates | Poor (1) | Marginal (2) | ||||||||||
| '00 | '02 | '04 | '06 | '00 | '02 | '04 | '06 | '00 | '02 | '04 | '06 | |
| Track | ||||||||||||
| Track | 4.06 | 4.17 | 4.27 | 4.06 | 7.0% | 5.9% | 3.8% | 14.7% | 10.0% | 9.1% | 4.4% | 5.3% |
| Systems | ||||||||||||
| Train Control | 3.89 | 4.00 | 3.39 | 3.50 | 9.5% | 7.8% | 12.0% | 5.5% | 10.3% | 9.7% | 14.1% | 14.4% |
| Traction Power | 4.15 | 4.37 | 3.95 | 3.61 | 7.3% | 4.2% | 0.0% | 4.2% | 6.9% | 2.9% | 1.4% | 7.2% |
| Communications | 3.73 | 4.10 | 4.05 | 3.96 | 11.9% | 8.3% | 0.0% | 0.0% | 14.0% | 6.0% | 0.0% | 0.6% |
| Revenue Collection | 4.08 | 4.29 | 4.27 | 3.66 | 3.8% | 0.8% | 3.0% | 21.5% | 18.1% | 6.9% | 8.0% | 8.8% |
| Structures | ||||||||||||
| Elevated Structure | 4.02 | 4.27 | 4.31 | 4.11 | 2.0% | 2.3% | 1.7% | 7.3% | 22.0% | 7.3% | 13.9% | 7.9% |
| Underground Tunnels | 3.75 | 4.09 | 4.23 | 3.70 | 12.0% | 7.5% | 7.4% | 14.8% | 11.0% | 8.6% | 5.6% | 15.4% |
| Maintenance | ||||||||||||
| Vehicle Storage Yards | 4.00 | 3.64 | 3.80 | 3.84 | 0.0% | 0.0% | 0.0% | 0.0% | 0.0% | 19.6% | 0.1% | 7.5% |
| Condition Rating (Percent) | ||||||||||||
|---|---|---|---|---|---|---|---|---|---|---|---|---|
| Adequate (3) | Good (4) | Excellent (5) | ||||||||||
| '00 | '02 | '04 | '06 | '00 | '02 | '04 | '06 | '00 | '02 | '04 | '06 | |
| Track | ||||||||||||
| Track | 12.0% | 11.6% | 17.7% | 6.7% | 45.0% | 33.9% | 38.8% | 33.4% | 26.0% | 39.5% | 35.2% | 39.8% |
| Systems | ||||||||||||
| Train Control | 16.9% | 11.1% | 29.0% | 41.0% | 56.0% | 65.9% | 44.6% | 37.0% | 7.2% | 5.5% | 0.3% | 2.2% |
| Traction Power | 10.6% | 10.8% | 44.5% | 46.5% | 54.5% | 45.0% | 46.5% | 35.0% | 20.7% | 37.0% | 7.6% | 7.0% |
| Communications | 12.1% | 9.7% | 25.2% | 54.8% | 62.0% | 68.6% | 62.7% | 30.5% | 0.0% | 7.4% | 12.1% | 14.0% |
| Revenue Collection | 17.6% | 2.4% | 9.5% | 10.7% | 31.0% | 56.4% | 53.7% | 30.0% | 29.5% | 33.5% | 25.8% | 28.9% |
| Structures | ||||||||||||
| Elevated Structure | 16.0% | 2.5% | 4.1% | 11.7% | 59.0% | 82.8% | 77.2% | 68.5% | 2.0% | 5.1% | 3.1% | 4.6% |
| Underground Tunnels | 19.0% | 13.0% | 12.4% | 10.5% | 46.0% | 36.7% | 48.2% | 41.1% | 12.0% | 34.2% | 26.4% | 18.2% |
| Maintenance | ||||||||||||
| Vehicle Storage Yards | 50.0% | 47.8% | 51.7% | 43.1% | 50.0% | 31.3% | 48.2% | 48.9% | 0.0% | 1.3% | 0.0% | 0.5% |
The estimated average condition rating for train control systems improved in 2006 to 3.50, compared with 3.39 in 2004. Conversely, the estimated average condition rating for all other rail systems assets declined from 2004 to 2006. The estimated average condition rating for rail communications systems was 3.96 in 2006, compared with 4.05 in 2004 showing a slight decline. The estimated average condition rating for traction power systems in 2006 was 3.61, a small decrease from the rating of 3.95 in 2004. These small decreases in condition mainly reflect improvements to the systems' asset decay algorithms housed in TERM, which are used to forecast how systems conditions deteriorate over time. The change in the estimated average condition rating of revenue collection systems—from 4.27 in 2004 to 3.66 in 2006—was a function of new and improved asset information contained in TERM.
Other Rail Infrastructure
Exhibit 3-36 also provides conditions for other rail infrastructure. Data for other rail infrastructure are based on the dollar amounts spent on different asset types (in constant dollars) rather than a numeric count of the assets. Earlier versions of this report provided condition results for these assets displayed as percentages across condition levels because this information is more accurate than average condition estimates. In addition to these data, this report also provides estimates of average condition by asset type.
The estimated average condition rating of elevated structures decreased from 4.31 in 2004 to 4.11 in 2006. During the time period from 2004 to 2006, the percentage of elevated structures estimated to be in adequate or better condition increased from 84.4 percent to 84.8 percent, and the percentage estimated to be in marginal or worse condition decreased from 15.6 percent to 15.2 percent. The estimated average condition rating of underground tunnels decreased from 4.23 to 3.70 during the same time period, as did the percentage of underground tunnels estimated to be in adequate or better condition, which went from 87.0 percent to 69.8 percent. The percentage of underground tunnels estimated to be in marginal and "poor" condition increased from 13.0 percent in 2004 to 30.2 percent in 2006.
| Why did the average condition of track increase while the percentage in adequate or better condition decreased? | |
|
The average condition of an asset may increase even when the percentage of assets in a higher condition category decreases. This occurs because of changes in the distribution of conditions of individual agency/mode assets within each condition category.
For example, assume that the percentage of assets in the adequate or better condition categories decreases by 5 percent. The average condition of all assets may still rise if the conditions of all other assets increase while remaining in their respective condition categories.
|
|
Track conditions worsened, going from an estimated average condition rating of 4.27 in 2004 to 4.06 in 2006, principally on the basis of updated asset information. The percentage of track estimated to be in adequate or better condition decreased from 91.7 percent in 2004 to 79.9 percent in 2006. The percentage estimated to be in marginal or poor condition increased from 8.2 to 20.0 percent.
| What is a storage yard? | |
|
Rail vehicles are held in storage yards when they are not in service. Storage yard records in TERM consist entirely of track. The next edition of this report will combine storage track with regular track because it is not clear that all agencies consistently report their storage track separately to the NTD. Storage yard information has been reported separately because it was a separate line item in the 1987 Rail Modernization Study, which set the groundwork for this report.
|
|
The estimated condition rating of vehicle storage yards increased from 3.80 in 2004 to 3.84 in 2006. In 2006, 92.5 percent of all yards were estimated to be in adequate or better condition.
Across the board, the change in condition of rail infrastructure from 2004 to 2006 is primarily the result of updates to the asset inventory in TERM.
The Replacement Value of U.S. Transit Assets
The total replacement value of the transit infrastructure in the United States was estimated at $607.2 billion in 2006. These estimates, presented in Exhibit 3-37, are based on the information contained in TERM and on data collected through the NTD and additional data collection efforts recently conducted for the nine largest rail operators. The data collected for these efforts represent a significant improvement in data availability, in terms of asset inventories and unit costs, and are significantly more comprehensive in comparison to previous C&P reports. The estimates are reported in current dollars. They exclude the value of assets that belong to special service operators that do not report to the NTD. Rail assets totaled $500.8 billion and nonrail assets were estimated at $99.5 billion in 2006. Joint assets—defined as assets that are used by one or more modes within a given transit agency—totaled $6.9 billion in 2006. Station assets formerly classified as joint have been reassigned to a specific rail or nonrail mode. Joint assets comprise assets that serve more than one mode within a single agency, and include administrative facilities, intermodal transfer centers, agency communications systems (e.g., PBX, radios, and computer networks), and vehicles used by agency management (e.g., vans and automobiles).
| (Billions of Current Dollars) | ||||
|---|---|---|---|---|
| Nonrail | Rail | Joint Assets |
Total | |
| Maintenance Facilities | $52.0 | $30.4 | $3.5 | $85.9 |
| Guideway Elements | $10.2 | $221.9 | $0.7 | $232.9 |
| Stations | $2.9 | $80.3 | $0.8 | $84.0 |
| Systems | $2.8 | $110.0 | $1.3 | $114.1 |
| Vehicles | $31.5 | $58.2 | $0.5 | $90.2 |
| Total | $99.5 | $500.8 | $6.9 | $607.2 |
What revisions were made to the generated assets component of TERM? |
|
|
A comprehensive review assessed TERM's capacity to generate assets for nonvehicle data. TERM has consistently generated assets for new agencies, but did not have a standardized method for checking the consistency of the asset base for older systems. An algorithm was developed to generate assets by comparing TERM's current asset inventory with listings of station counts, facility counts, and track miles by grade as reported to the NTD.
|
|
Rural Transit Vehicles and Facilities
As rail transit does not serve rural areas, all rural transit vehicles are buses or vans. Historically, data on the condition of rural vehicles and maintenance facilities were not collected by FTA. To obtain this information, FTA relied on special studies completed on an as-needed basis. Starting in 2005, however, FTA required rural operators to submit this type of data to the NTD, allowing FTA to report more accurately on the conditions of rural transit vehicles and facilities. These data, summarized in Exhibit 3-38, are discussed below.
| Vehicle Type | Fleet Total | Average Age | Percent Over-Age |
|---|---|---|---|
| Motor Bus | 1,610 | 5.5 | 31.3% |
| Vans | 18,762 | 3.5 | 28.0% |
| Total | 20,372 | 3.7 | 28.2% |
For 2006, data reported to the NTD indicated that 28.2 percent of the rural transit fleet—31.3 percent of buses and 28.0 percent of vans—was over-age. The rural transit fleet had an average age of 3.7 years in 2006; buses, with an average age of 5.5 years, were older than vans in 2006, which had an average age of 3.5 years.
Data on the conditions of rural maintenance facilities have not been updated since the 2002 edition of the report. The most recent data available were collected from surveys funded by the FTA and conducted by the Community Transportation Association of America. The information was collected between June 1997 and June 1999. The responses of the 158 rural operators that responded to these surveys have been combined. Note that, for the purpose of these surveys, rural operators are defined as those operators outside urbanized areas, a different definition than used by the U.S. Census. These surveys also found that approximately 30 percent of bus rural maintenance facilities were in excellent condition, 50 percent in good condition, 19 percent in poor condition, and 1 percent in very poor condition.
Special Service Vehicles
No information is available on the age and condition of special service vehicles. The FTA estimated that, in 2002, nearly 60 percent of special service vehicles were more than 5 years old.
Comparison
Exhibit 3-39 compares key highway and transit statistics discussed in this chapter with the values shown in the last C&P report. The first data column contains the values reported in the 2006 C&P Report, which were based on 2004 data. Some of the 2004 values have subsequently been revised, which is reflected in the second column as appropriate. The third column contains comparable values, based on 2006 data.
| Statistic | Condition | 2004 Data | 2006 Data | |
|---|---|---|---|---|
| 2006 C&P Report |
Revised | |||
| Total VMT on Pavements With Ride Quality of: | Good | 44.2% | 47.0% | |
| Total VMT on Pavements With Ride Quality of: | Acceptable | 84.9% | 86.0% | |
| Rural VMT on Pavements With Ride Quality of: | Good | 58.3% | 62.2% | |
| Rural VMT on Pavements With Ride Quality of: | Acceptable | 94.5% | 94.9% | |
| Small Urban VMT on Pavements With Ride Quality of: | Good | 41.2% | 44.2% | |
| Small Urban VMT on Pavements With Ride Quality of: | Acceptable | 84.3% | 85.5% | |
| Urbanized VMT on Pavements With Ride Quality of: | Good | 36.1% | 38.2% | |
| Urbanized VMT on Pavements With Ride Quality of: | Acceptable | 79.2% | 80.6% | |
| Deficient Bridges as a Percent of Total Bridges | 26.7% | 28.6% | 27.6% | |
| Structurally Deficient Bridges as a Percent of Total | 13.1% | 13.5% | 12.6% | |
| Functionally Obsolete Bridges as a Percent of Total | 13.6% | 15.2% | 15.0% | |
| Average Urban Bus Vehicle Condition Rating* | 3.08 | 3.01 | ||
| Average Rail Vehicle Condition Rating* | 3.50 | 3.51 | ||
| Urban Bus Maintenance Facilities With Condition of: | Excellent/Good | 22% | 22.4% | 21.8% |
| Urban Bus Maintenance Facilities With Condition of: | Adequate | 46% | 45.7% | 41.9% |
| Rail Maintenance Facilities With Condition of: | Excellent/Good | 43% | 43.6% | 30.3% |
| Rail Maintenance Facilities With Condition of: | Adequate | 48% | 48.5% | 43.5% |
| Rail Stations With Condition of: | Excellent/Good | 35% | 34.7% | 24.9% |
| Rail Stations With Condition of: | Adequate | 14% | 13.7% | 40.8% |
| Rail Track With Condition of: | Excellent/Good | 74% | 74.0% | 73.2% |
| Rail Track With Condition of: | Adequate | 18% | 17.7% | 6.7% |
Road Conditions
This chapter focused on pavement ride quality within rural, small urban, and urbanized population areas. The functional classification used was the National Highway System (NHS), which includes the Interstate highway system and the Strategic Highway Network. Rural minor collectors and local roads were not included as data were not available.
Road condition ratings were derived from International Roughness Index (IRI) or Present Serviceability Rating (PSR) measures, IRI measuring the cumulative deviation from a smooth surface in inches per mile and PSR being an objective rating system based on a scale of 0 through 5. Road conditions information in this report was primarily based on the percentages of vehicle miles traveled (VMT) occurring on pavement with good and/or acceptable ride quality.
Between 2004 and 2006, the percentage of VMT on pavements with good ride quality steadily increased from 44.2 percent to 47.0 percent. For the same period, all three population areas have increased their percentage of VMT on pavements with both acceptable and good ride quality.
For rural population areas, the percentage of VMT on pavements with acceptable ride quality increased from 84.9 percent to 86.0 percent, the percentage of VMT on pavements with good ride quality increased from 58.3 percent to 62.2 percent, and the percentage of VMT on pavements with acceptable ride quality increased from 94.5 percent to 94.9 percent. Small urban areas also experienced an increase in VMT on pavements with good and acceptable ride qualities during the same period from 41.2 percent to 44.2 percent and from 84.3 percent to 85.5 percent, respectively. Urban areas' acceptable VMT percentages rose from 79.2 percent in 2004 to 80.6 percent in 2006 and the urban VMT on pavement with good ride quality rose from 36.1 percent to 38.2 percent.
Bridge Conditions
The Federal Highway Administration (FHWA) has adopted as the performance measure for bridge condition the percent of total deck area that is on deficient bridges on the NHS and the percent of total deck area that is on deficient bridges off the NHS. This statistic is calculated based on the total deck area of deficient bridges, whether structurally deficient or functionally obsolete, divided by the total deck area for all bridges. All ranges of average daily traffic (ADT) are included in the calculation; however, separate and specific performance goals have been set for NHS and non-NHS bridges for performance planning purposes. This chapter focused on the physical conditions of all bridges; Chapter 12 examines bridge conditions on the NHS in more detail.
In 2006, 12.6 percent of all bridges were structurally deficient. This 2006 percentage is a decrease from the 13.5 percent of structurally deficient bridges in 2004. Functionally obsolete bridges accounted for 15.0 percent of all bridges in 2006, a decrease from 15.2 percent in 2004. When combined, the total number of structurally deficient and functionally obsolete bridges has decreased from 28.6 percent in 2004 to 27.6 percent in 2006.
Exhibit 3-39 provides a second column that includes revised 2004 data for structurally deficient and functionally obsolete bridges. The revision shows the total percent of 2004 deficient bridges as 28.6 percent compared to 26.7 percent shown in the first column, which provides the 2004 data as reported in the 2006 C&P Report. The 2004 revised data also show structurally deficient bridges as a percent of total as 13.5 percent compared to 13.1 percent and the functionally obsolete bridges as a percent of total as 15.2 percent compared to 13.6 percent.
These revisions are the result of the decision to change the 2004 data set to count structurally deficient and functionally obsolete bridges that are less than 10 years old. Previously, these "10-Year Rule" bridges were not included in the data set; however, they are part of the total picture of the condition of bridges in the country and, for the purposes of this report, have been added into the data set. The 2006 data set also uses the full data set. Although the data set has been revised for C&P report purposes, the "10-Year Rule" still applies; and any bridges newly constructed or reconstructed, less than 10 years in age, are not counted as structurally deficient or functionally obsolete and are not eligible for consideration in the apportionment process for Highway Bridge Program funds.
Transit Conditions
The Federal Transit Administration estimates conditions for transit vehicles, maintenance facilities, yards, stations, track, structures, and power systems using the Transit Economic Requirements Model, data collected through the National Transit Database, and special engineering surveys of transit assets. The data collected for the 2008 C&P Report represent a significant improvement in data availability and do not necessarily imply significant changes to estimated conditions of assets. The data for the 2008 C&P Report are significantly more comprehensive in comparison to previous C&P reports. Since the 2006 C&P Report, asset data for approximately 71 percent of the Nation's transit assets have been updated.
The average estimated condition and age of transit vehicles remained relatively stable between 2004 and 2006. On a scale of 1 (poor) to 5 (excellent), bus vehicles had an average condition of 3.01 in 2006 compared with 3.08 in 2004. The average age of the bus vehicle fleet remained unchanged, at 6.1 years. The average condition of the rail fleet increased slightly from 3.50 in 2004 to 3.51 in 2006. The average age of rail vehicles increased from 19.7 years in 2004 to 19.8 years in 2006. Average rail vehicle age and condition are heavily influenced by the average age and condition of heavy rail vehicles, which account for approximately 55.8 percent of the U.S. rail fleet.
The average condition of urban bus maintenance facilities (including facilities for vans and demand response vehicles) slightly declined, decreasing from 3.41 in 2004 to 3.26 in 2006. In 2006, 41.9 percent of urban bus maintenance facilities were in adequate condition, 5.4 percent were in good condition, and 16.4 percent were in excellent condition, for a combined total of 63.6 percent in adequate or better condition. The condition rating of rail maintenance facilities decreased from 3.82 in 2004 to 3.68 in 2006. Seventy-three and eight-tenths percent of all rail maintenance facilities are estimated to be in adequate or better condition, and 26.2 percent are in marginal or poor condition.
The condition rating of rail stations increased from 3.37 in 2002 to 3.53 in 2006, with 65.7 percent in adequate to excellent condition. The majority of structures, track, and yards are estimated to be in adequate to good condition for 2006, with 79.9 percent of track in adequate to excellent condition.