

- Highway Finance
- Overall Highway Finance Trends
- Current Revenue Sources
- Historical Revenue Trends
- Overall Highway Expenditures
- Highway Capital Outlay Expenditures
- Innovative Finance
- Public-Private Partnerships
- Credit Assistance
- Debt Financing
- Innovations in Tolling
- Overall Highway Finance Trends
- Transit Finance
- Transit Funding
- Level and Composition of Transit Funding
- Federal Funding
- State and Local Funding
- Level and Composition of System-Generated Funds
- Trends in Public Funding
- Funding in Current and Constant Dollars
- Capital Funding and Expenditures
- Operating Expenditures
- Operating Expenditures by Transit Mode
- Operating Expenditures by Type of Cost
- Operating Expenditures per Vehicle Revenue Mile
- Operating Expenditures per Passenger Mile
- Farebox Recovery Ratios
- Rural Transit
- Comparison
Highway Finance
This section presents a detailed look at highway finance from two different perspectives. First, this chapter examines overall highway finance trends, beginning with the revenue sources that support public investment in highways and bridges across all levels of government. This is followed by a detailed analysis of capital expenditures. Second, it examines tools that are allowing transportation agencies to finance surface transportation projects when traditional finance methods may not fully cover the need. These tools include the use of Public-Private Partnerships, credit assistance, debt financing, and innovations in tolling.
A separate section within this chapter explores the financing of transit systems. This is followed by a section comparing key statistics from the highway and transit sections with the information presented in the previous edition of this report. The goal of this chapter is to comprehensively address not only highway finance as supported by traditional means, but also the trends that may impact this area in the future.
Overall Highway Finance Trends
Innovative finance plays an increasingly important role in the delivery of highway infrastructure, but the vast majority of finance is still done by more traditional means. The following section takes a comprehensive look at all transportation funding in the United States; it presents information on the revenue sources that support public investment in highways and bridges, as well as the various types of investments that are being made by all levels of government. This is followed by a discussion of the current and historic roles of Federal, State, and local governments in highway funding. The section then concludes with a more detailed analysis of capital expenditures.
Private sector investment in highways would generally show up in the "other receipts" category in the exhibits in this section, to the extent that such investment is captured in State and local accounting systems.
Current Revenue Sources
As shown in Exhibit 6-1, $166.0 billion was generated by all levels of government in 2006 for the purpose of highway investment. Actual cash expenditures in 2006 for highways and bridges, however, were lower, totaling $161.1 billion. The $1.6 billion shown as drawn from reserves in the Federal column indicates that the cash balance of the Highway Account of the Federal Highway Trust Fund (HTF) declined by that amount during 2006. State and local governments, however, placed $6.6 billion in reserves, which means that $5.0 billion in revenue generated for highways at all levels of government was instead saved for spending at a later point.
| (Billions of Dollars) | Percent | ||||
|---|---|---|---|---|---|
| Federal | State | Local | Total | ||
| User Charges | |||||
| Motor-Fuel Taxes | $26.8 | $31.9 | $1.4 | $60.1 | 36.2% |
| Motor-Vehicle Taxes and Fees | $5.2 | $19.1 | $0.8 | $25.2 | 15.2% |
| Tolls | $0.0 | $6.7 | $1.4 | $8.1 | 4.9% |
| Subtotal | $32.1 | $57.7 | $3.6 | $93.4 | 56.3% |
| Other | |||||
| Property Taxes and Assessments | $0.0 | $0.0 | $8.6 | $8.6 | 5.2% |
| General Fund Appropriations | $2.4 | $4.9 | $19.6 | $26.8 | 16.1% |
| Other Taxes and Fees | $0.3 | $5.0 | $4.6 | $9.9 | 5.9% |
| Investment Income and Other Receipts | $0.0 | $4.2 | $5.3 | $9.5 | 5.7% |
| Bond Issue Proceeds | $0.0 | $11.9 | $5.9 | $17.8 | 10.7% |
| Subtotal | $2.7 | $26.0 | $44.0 | $72.6 | 43.7% |
| Total Revenues | $34.8 | $83.7 | $47.6 | $166.0 | 100.0% |
| Funds Drawn From (or Placed in) Reserves | $1.6 | ($2.8) | ($3.8) | ($5.0) | -3.0% |
| Total Expenditures Funded During 2006 | $36.3 | $80.9 | $43.8 | $161.1 | 97.0% |
Highway-user charges—including motor-fuel taxes, motor—vehicle taxes and fees, and tolls-were the source of 56.3 percent of the $166.0 billion of total revenues for highways and bridges in 2006. The remaining 43.7 percent of revenues came from a number of sources, including local property taxes and assessments, other dedicated taxes, general funds, bond issues, investment income, and other miscellaneous sources. Development fees and special district assessments are included under "Investment Income and Other Receipts" in Exhibit 6-1.
The degree to which highway programs are funded by highway-user charges differs widely among the different levels of government. At the Federal level, 92.3 percent of highway revenues came from motor-fuel and motor vehicle taxes in 2006. The remainder came from general fund appropriations; motor carrier fines and penalties; and some timber sales, leasing of Federal lands, and oil and mineral royalties.
Highway-user charges also provided the largest share, 69.0 percent, of highway revenues at the State level in 2006. Bond issue proceeds were another significant source of funding, providing 14.3 percent of highway funds at the State level. The remaining 16.7 percent of State highway funding came from general fund appropriations, other State taxes and fees, investment income, and other miscellaneous revenue sources.
Many States do not permit local governments to impose motor-fuel and motor-vehicle taxes, or they cap them at relatively low levels. Therefore, at the local government level, only 7.6 percent of highway funding was provided by highway-user charges in 2006. Local general funds, property taxes, and other taxes and fees were the sources of 68.9 percent of local highway funding. Bond issue proceeds provided 12.4 percent of local highway funding, while investment income and miscellaneous receipts provided the remaining 11.1 percent.
Historical Revenue Trends
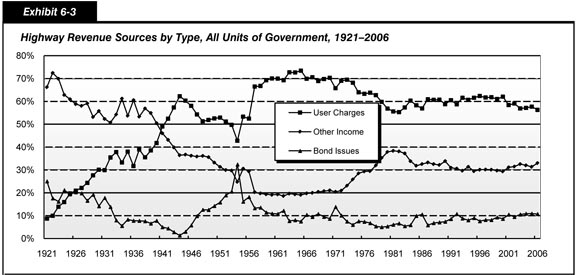
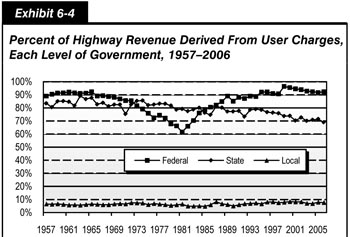
Exhibits 6-3 and 6-4 show how highway revenue sources have varied over time. Exhibit 6-3 identifies the different sources of highway revenue since 1921 for all levels of government combined. Exhibit 6-4 identifies the percentage of highway revenue derived from user charges by each level of government since 1957. Some of the variation in revenue sources shown in the graph portion of Exhibit 6-3 is caused by changes in the share of funding provided by each level of government over time; this topic will be discussed later in this chapter. In the early 1920s, when local government bore much of the responsibility for highway funding, property taxes were the primary source of revenues for highways. Property taxes have, however, become a much less significant source of revenue over time. In 2000, property taxes dropped to an all-time low of 4.7 percent of total highway revenue and remained at roughly that level through 2002; in 2003, property taxes began to climb slightly, reaching 5.2 percent of total highway revenues in 2006. The share of total highway revenues generated by bond proceeds has fluctuated over time, reaching a high of 32.4 percent in 1954. Since that time, combined highway and bridge programs have become less dependent on debt financing; this share has not exceeded 11 percent of revenues since 1971.
| Year | Fuel and Vehicle Taxes | Tolls | Property Taxes | General Fund Approps. | Other Taxes and Fees | Investment Income and Other | Issue Proceeds | Total |
|---|---|---|---|---|---|---|---|---|
| 1921 | $0.1 | $0.0 | $0.7 | $0.1 | $0.0 | $0.1 | $0.4 | $1.4 |
| 1925 | 0.4 | 0.0 | 0.9 | 0.2 | 0.0 | 0.0 | 0.4 | 2.0 |
| 1929 | 0.7 | 0.0 | 1.2 | 0.2 | 0.0 | 0.0 | 0.5 | 2.7 |
| 1933 | 0.7 | 0.0 | 0.6 | 0.4 | 0.0 | 0.0 | 0.2 | 1.9 |
| 1937 | 1.0 | 0.0 | 0.4 | 1.0 | 0.0 | 0.0 | 0.2 | 2.7 |
| 1941 | 1.2 | 0.1 | 0.4 | 0.8 | 0.0 | 0.0 | 0.1 | 2.6 |
| 1945 | 1.1 | 0.1 | 0.3 | 0.4 | 0.0 | 0.0 | 0.1 | 1.9 |
| 1949 | 2.1 | 0.1 | 0.4 | 1.0 | 0.0 | 0.1 | 0.5 | 4.3 |
| 1953 | 3.1 | 0.2 | 0.6 | 1.2 | 0.0 | 0.2 | 1.3 | 6.5 |
| 1957 | 5.6 | 0.4 | 0.8 | 0.7 | 0.0 | 0.2 | 1.2 | 9.0 |
| 1961 | 7.7 | 0.5 | 0.9 | 1.0 | 0.1 | 0.3 | 1.3 | 11.8 |
| 1965 | 9.8 | 0.7 | 1.1 | 1.1 | 0.2 | 0.4 | 1.1 | 14.3 |
| 1969 | 13.0 | 0.9 | 1.3 | 1.9 | 0.3 | 0.6 | 1.9 | 19.9 |
| 1973 | 17.0 | 1.2 | 1.5 | 3.0 | 0.4 | 1.1 | 2.0 | 26.2 |
| 1977 | 19.6 | 1.4 | 1.8 | 5.4 | 0.8 | 1.8 | 2.2 | 33.0 |
| 1981 | 21.8 | 1.8 | 2.5 | 8.8 | 1.4 | 3.7 | 2.6 | 42.5 |
| 1985 | 33.6 | 2.2 | 3.5 | 9.9 | 1.9 | 4.3 | 6.1 | 61.4 |
| 1989 | 41.4 | 2.9 | 4.3 | 10.8 | 2.9 | 5.5 | 5.2 | 72.8 |
| 1993 | 50.8 | 3.6 | 4.7 | 10.6 | 4.0 | 6.8 | 7.8 | 88.4 |
| 1997 | 61.6 | 4.7 | 5.3 | 15.1 | 5.0 | 7.0 | 8.8 | 107.4 |
| 1998 | 64.3 | 4.7 | 5.8 | 14.5 | 5.1 | 8.2 | 9.0 | 111.6 |
| 1999 | 69.1 | 5.1 | 5.8 | 17.2 | 6.4 | 6.8 | 11.3 | 121.7 |
| 2000 | 75.6 | 5.7 | 6.1 | 19.3 | 5.7 | 7.3 | 11.3 | 131.1 |
| 2001 | 71.8 | 5.9 | 6.3 | 19.1 | 8.0 | 8.0 | 14.0 | 133.1 |
| 2002 | 73.1 | 6.6 | 6.5 | 20.3 | 7.5 | 8.1 | 12.7 | 134.8 |
| 2003 | 73.3 | 5.9 | 7.2 | 21.8 | 8.8 | 7.5 | 14.7 | 139.2 |
| 2004 | 76.4 | 6.6 | 7.5 | 23.6 | 7.9 | 7.6 | 15.8 | 145.3 |
| 2005 | 83.4 | 7.7 | 8.2 | 24.3 | 9.1 | 8.0 | 17.2 | 157.8 |
| 2006 | 85.3 | 8.1 | 8.6 | 26.8 | 9.9 | 9.5 | 17.8 | 166.0 |
| Year | Federal | State | Local | Total |
|---|---|---|---|---|
| 1957 | 89.0% | 83.5% | 6.5% | 66.5% |
| 1961 | 92.1% | 84.7% | 5.7% | 69.9% |
| 1965 | 92.4% | 87.7% | 6.5% | 73.5% |
| 1969 | 88.1% | 82.5% | 6.5% | 69.8% |
| 1973 | 81.6% | 85.3% | 7.3% | 69.5% |
| 1977 | 74.3% | 83.2% | 6.4% | 63.8% |
| 1981 | 61.5% | 79.1% | 6.4% | 55.6% |
| 1985 | 78.8% | 76.2% | 4.7% | 58.3% |
| 1989 | 89.0% | 77.2% | 6.1% | 60.7% |
| 1993 | 89.0% | 78.5% | 6.9% | 61.6% |
| 1997 | 91.0% | 76.3% | 8.1% | 61.7% |
| 1998 | 90.7% | 75.9% | 7.5% | 61.8% |
| 1999 | 96.4% | 73.6% | 7.9% | 61.0% |
| 2000 | 95.5% | 73.9% | 8.3% | 62.0% |
| 2001 | 94.6% | 70.3% | 8.1% | 58.4% |
| 2002 | 93.9% | 72.6% | 8.2% | 59.1% |
| 2003 | 92.8% | 70.0% | 7.0% | 56.9% |
| 2004 | 92.4% | 70.8% | 6.9% | 57.1% |
| 2005 | 91.7% | 71.4% | 7.9% | 57.7% |
| 2006 | 92.3% | 69.0% | 7.6% | 56.3% |
Highway Statistics, various years, Tables HF-10A and HF-10.
Since the passage of the Federal-Aid Highway Act of 1956 and the establishment of the Federal HTF, motor-fuel and motor-vehicle tax receipts have consistently provided a majority of the combined revenues raised for highway and bridge programs by all levels of government.
After peaking at an all-time high of 73.5 percent of highway revenues in 1965, the share represented by highway-user charges dropped to 55.2 percent in 1982. As shown in Exhibit 6-4, until 2000, the percentage had rebounded and stabilized in a range of about 60 to 62 percent. Since 2001, it has been slightly lower, ranging from 56 to 59 percent.
A corresponding pattern can be observed in the percentage of Federal highway revenue derived from highway-user charges as shown by the Federal line in Exhibit 6-4. During the early years of the HTF, over 90 percent of highway revenues at the Federal level came from fuel and vehicle taxes. From the late 1960s to early 1980s, this percentage declined, to a low of 61.5 percent in 1981. During this period, Federal motor-fuel taxes did not increase, and a growing percentage of Federal highway funding came from other sources. Since 1981, Federal motor-fuel taxes have increased significantly, and Federal general fund revenues used for highways have declined. As a result, the portion of Federal highway revenue derived from highway-user charges increased, reaching an all-time high of 96.4 percent in 1999. Since then, however, the share of Federal funding generated by highway-user charges have begun to decrease, dropping to 92.3 percent in 2006.
Exhibit 6-4 shows that the share of State government highway funding contributed by highway-user charges has generally declined over time. From 1997 to 2006, the percentage dropped from 76.3 percent to 69.0 percent. Over the same period, States grew more reliant on debt financing, as bond proceeds grew from 8.6 percent to 14.3 percent of State government highway funding.
Highway-user charges have never been as significant a source of highway revenue at the local government level as at the Federal or State levels. In recent years, the share of local government highway funding derived from highway-user charges has been slightly higher than it was historically, exceeding 8 percent each year from 2000 to 2002, before dropping to 7.6 percent in 2006.
Overall Highway Expenditures
Exhibit 6-1 indicates that total expenditures for highways in 2006 equaled $161.1 billion, then identifies the portion of this aggregate amount funded by each level of government. Exhibit 6-5 classifies this total by type of expenditure and by the level of government. The "Federal," "State," and "Local" columns in Exhibit 6-5 indicate which level of government made the direct expenditures, while "Funded by…" in the column "Current Expenditures" indicates the level of government that provided the funding for those expenditures. All amounts cited as "expenditures," "spending," or "outlays" in this report represent cash expenditures rather than authorizations or obligations.
| (Billions of Dollars) | Percent | ||||
|---|---|---|---|---|---|
| Federal | State | Local | Total | ||
| Capital Outlay | $0.5 | $59.0 | $19.2 | $78.7 | 48.8% |
| Funded by Federal Government* | $0.5 | $32.8 | $1.4 | $34.6 | 21.5% |
| Funded by State or Local Govt's* | $0.0 | $26.2 | $17.9 | $44.1 | 27.4% |
| Noncapital Expenditures | |||||
| Maintenance | 0.2 | 12.6 | 18.6 | 31.3 | 19.4% |
| Highway and Traffic Services | 0.0 | 4.7 | 4.4 | 9.1 | 5.7% |
| Administration | 1.5 | 7.1 | 4.6 | 13.2 | 8.2% |
| Highway Patrol and Safety | 0.0 | 7.7 | 6.8 | 14.5 | 9.0% |
| Interest on Debt | 0.0 | 4.4 | 2.2 | 6.6 | 4.1% |
| Subtotal | $1.7 | $36.5 | $36.6 | $74.7 | 46.4% |
| Total, Current Expenditures | $2.2 | $95.4 | $55.8 | $153.4 | 95.3% |
| Bond Retirement | $0.0 | $4.6 | $3.0 | $7.6 | 4.7% |
| Total All Expenditures | $2.2 | $100.1 | $58.8 | $161.1 | 100.0% |
| Funded by Federal Government* | $2.2 | $32.8 | $1.4 | $36.3 | 22.6% |
| Funded by State Governments* | $0.0 | $65.1 | $15.8 | $80.9 | 50.2% |
| Funded by Local Governments* | $0.0 | $2.2 | $41.6 | $43.8 | 27.2% |
While the Federal government funded $36.3 billion of total highway expenditures in 2006, the majority of the Federal government's contribution to highways consists of grants to State and local governments. Direct Federal spending on capital outlay, maintenance, administration, and research amounted to only $2.2 billion (about 1.4 percent). The remaining $34.1 billion was in the form of transfers to State and local governments.
| How was the $36.3 billion figure for Federal contributions to total highway expenditures derived, and why does this figure differ from amounts that appear in other documents (e.g., the President's Budget)? | |
|
The Federal expenditures shown in this report are intended to reflect the highway-related activities of all Federal agencies, rather than just those of the traditional transportation agencies such as FHWA. The figures shown in this report tie back to data in Highway Statistics,1 which are linked to data for highway expenditures on an agency-by-agency basis2 at the Federal level. These data represent cash outlays, rather than obligations (which are more relevant in terms of the annual Federal budget) or authorizations (which are more relevant in terms of multiyear authorization bills). Since the financial data reported by State and local governments are compiled on a cash basis, this report uses the same basis for Federal expenditures to ensure consistency.
The Federal figures2 rely on data from a mix of Federal, State, and local sources. In some cases, this table captures Federal funding for highways that are not otherwise tracked at the Federal level. For example, under current law, 25 percent of the receipts derived from Federal timber sales are to be paid to States for public roads and schools in the counties where forests are situated. At the time these payments are made, it is unknown what portion will ultimately be used for roads as opposed to schools; however, once States have expended these funds, they report to FHWA what portion was used for roads so that this information may be included.
Note that the Federal highway funding figures in this report exclude any amounts funded from the Highway Account of the Federal HTF that were used for transit purposes as identified in Highway Statistics.1 Such amounts would appear as Federal funding for transit in this report.
The $34.6 billion Federal contribution to total capital expenditures represents total Federal highway expenditures of $36.3 billion, less direct Federal expenditures for noncapital purposes such as maintenance on Federally owned roads, administrative costs, and research.
1 Highway Statistics, Tables HF 10 and HF-10A.
2 Highway Statistics, Tables FA-5 and FA-5R. |
|
State governments combined $32.8 billion of Federal funds with $65.1 billion of State funds and $2.2 billion of local funds to make direct expenditures of $100.1 billion (62.1 percent). Local governments combined $1.4 billion of Federal funds with $15.8 billion of State funds and $41.6 billion of local funds to make direct expenditures of $58.8 billion (36.5 percent).
Types of Highway Expenditures
Current highway expenditures can be divided into two broad categories: noncapital and capital. Noncapital highway expenditures include maintenance of highways, highway and traffic services, administration, highway law enforcement, highway safety, and interest on debt. Highway capital outlay consists of those expenditures associated with highway improvements. Such improvements include land acquisition and other right-of-way costs; preliminary and construction engineering; new construction, reconstruction, resurfacing, rehabilitation, and restoration; and installation of guardrails, fencing, signs, and signals. Bond retirement is not part of current expenditures, but it is included in the figures cited for total highway expenditures in this report.
| What basis is used for distinguishing between capital expenditures and maintenance expenditures? | |
|
The classification of the revenue and expenditure items in this report is based on definitions contained in A Guide to Reporting Highway Statistics, the instructional manual for States providing financial data for the Highway Statistics publication. This manual indicates that the classification of highway construction and maintenance expenditures should be based on criteria provided in the American Association of State Highway and Transportation Officials publication, AASHTO Maintenance Manual—1987.
Other definitions of maintenance are used by different organizations. Some resurfacing, restoration, and rehabilitation projects that meet this report's definition of capital outlay might be classified as maintenance activities in internal State or local accounting systems.
|
|
As shown in Exhibit 6-5, all levels of government spent $78.7 billion on capital outlay in 2006, or 48.8 percent of total highway expenditures. Highway capital outlay expenditures are discussed in more detail later in this chapter.
| How are "maintenance" and "highway and traffic services" defined in this report? | |
|
Maintenance in this report includes routine and regular expenditures required to keep the highway surface, shoulders, roadsides, structures, and traffic control devices in usable condition. This includes completing spot patching and crack sealing of roadways and bridge decks and maintaining and repairing highway utilities and safety devices such as route markers, signs, guardrails, fence, signals, and highway lighting.
Highway and traffic services include activities designed to improve the operation and appearance of the roadway. This includes items such as the operation of traffic control systems, snow and ice removal, highway beautification, litter pickup, mowing, toll collection, and air quality monitoring.
|
|
Current non-capital expenditures consumed $74.7 billion (46.4 percent), while the remaining $7.6 billion (4.7 percent) went for bond redemption. As most Federal funding for highways goes for capital items, noncapital expenditures are funded primarily by State and local governments. In 2006, spending by local governments on noncapital expenditures slightly exceeded spending by State governments on noncapital expenditures, with local governments allocating $36.6 billion and State governments spending $36.5 billion. Local government expenditures for the maintenance subset of noncapital expenditures comprised $18.6 billion (about 59.3 percent) of the $31.3 billion total.
Historical Expenditure and Funding Trends
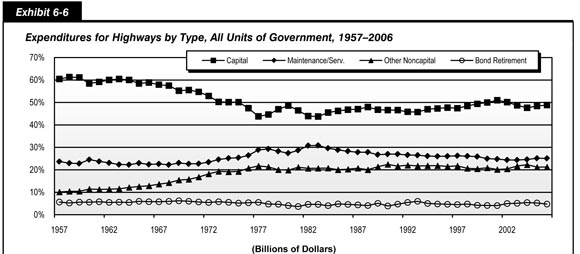
Exhibits 6-6 and 6-7 provide historical perspective for the 2006 values shown in Exhibit 6-5. Exhibit 6-6 shows how the composition of highway expenditures by all levels of government combined has changed over time. Exhibit 6-6 shows the amounts provided by each level of government to finance those expenditures and the share of funding provided by the Federal government for total highway expenditures and for highway capital outlay.
| Year | Capital Outlay | Maintenance and Services | Other Noncapital | Debt Retirement | Total | |||
|---|---|---|---|---|---|---|---|---|
| Administration | Highway Patrol and Safety | Interest on Debt | Total Other Noncapital | |||||
| 1957 | $5.6 | $2.2 | $0.4 | $0.3 | $0.3 | $0.9 | $0.5 | $9.3 |
| 1961 | $6.8 | $2.7 | $0.5 | $0.3 | $0.4 | $1.3 | $0.7 | $11.5 |
| 1965 | $8.4 | $3.3 | $0.8 | $0.5 | $0.5 | $1.8 | $0.9 | $14.3 |
| 1969 | $10.4 | $4.3 | $1.1 | $1.1 | $0.7 | $2.9 | $1.2 | $18.8 |
| 1973 | $12.2 | $5.9 | $1.7 | $1.9 | $1.0 | $4.7 | $1.4 | $24.2 |
| 1977 | $13.1 | $8.6 | $2.4 | $2.8 | $1.3 | $6.5 | $1.6 | $29.8 |
| 1981 | $19.7 | $12.2 | $3.4 | $3.9 | $1.7 | $9.0 | $1.6 | $42.4 |
| 1985 | $26.6 | $16.6 | $4.2 | $5.2 | $2.1 | $11.5 | $2.8 | $57.5 |
| 1989 | $33.1 | $19.0 | $5.7 | $6.6 | $2.8 | $15.2 | $3.6 | $70.9 |
| 1993 | $39.5 | $22.9 | $7.9 | $7.2 | $3.7 | $18.8 | $5.2 | $86.4 |
| 1997 | $48.4 | $26.8 | $8.3 | $9.8 | $4.2 | $22.2 | $4.6 | $102.0 |
| 1998 | $52.3 | $28.2 | $8.5 | $9.4 | $4.4 | $22.3 | $5.1 | $108.0 |
| 1999 | $57.2 | $30.0 | $9.0 | $10.4 | $4.4 | $23.7 | $4.9 | $115.9 |
| 2000 | $61.3 | $30.6 | $10.0 | $11.0 | $4.6 | $25.6 | $5.1 | $122.7 |
| 2001 | $66.7 | $32.4 | $10.2 | $11.4 | $4.8 | $26.4 | $5.3 | $130.8 |
| 2002 | $68.2 | $33.2 | $10.7 | $11.7 | $5.4 | $27.8 | $6.8 | $135.9 |
| 2003 | $70.0 | $35.0 | $12.0 | $13.5 | $5.7 | $31.2 | $7.4 | $143.6 |
| 2004 | $70.3 | $36.3 | $12.7 | $14.3 | $5.8 | $32.9 | $8.0 | $147.5 |
| 2005 | $74.1 | $38.5 | $12.0 | $14.2 | $6.3 | $32.5 | $8.0 | $153.2 |
| 2006 | $78.7 | $40.4 | $13.2 | $14.5 | $6.6 | $34.3 | $7.6 | $161.1 |
| Year | Funding for Total Highway Expenditures | Funding for Capital Outlay | ||||||
|---|---|---|---|---|---|---|---|---|
| (Billions of Dollars) | Percent Federal | (Billions of Dollars) | Percent Federal | |||||
| Federal | State | Local | Total | Federal | Total | |||
| 1957 | $1.1 | $6.1 | $2.0 | $9.3 | 12.2% | $1.1 | $5.6 | 19.4% |
| 1961 | $2.9 | $6.2 | $2.4 | $11.5 | 24.8% | $2.8 | $6.8 | 41.1% |
| 1965 | $4.3 | $7.3 | $2.7 | $14.3 | 30.1% | $4.2 | $8.4 | 50.7% |
| 1969 | $4.7 | $10.4 | $3.7 | $18.8 | 25.1% | $4.6 | $10.4 | 44.2% |
| 1973 | $5.8 | $13.8 | $4.6 | $24.2 | 24.1% | $5.6 | $12.2 | 46.0% |
| 1977 | $7.8 | $15.1 | $6.9 | $29.8 | 26.3% | $7.5 | $13.1 | 57.6% |
| 1981 | $11.9 | $20.1 | $10.4 | $42.4 | 28.1% | $11.5 | $19.7 | 58.4% |
| 1985 | $14.7 | $27.9 | $14.9 | $57.5 | 25.7% | $14.3 | $26.6 | 53.8% |
| 1989 | $14.5 | $36.4 | $19.9 | $70.9 | 20.5% | $14.1 | $33.1 | 42.5% |
| 1993 | $17.6 | $46.5 | $22.3 | $86.4 | 20.4% | $16.9 | $39.5 | 42.7% |
| 1997 | $21.2 | $54.2 | $26.6 | $102.0 | 20.8% | $20.1 | $48.4 | 41.6% |
| 1998 | $20.5 | $59.7 | $27.8 | $108.0 | 19.0% | $19.4 | $52.3 | 37.1% |
| 1999 | $23.3 | $61.0 | $31.7 | $116.0 | 20.1% | $22.1 | $57.2 | 38.7% |
| 2000 | $27.5 | $62.7 | $32.6 | $122.7 | 22.4% | $26.1 | $61.3 | 42.6% |
| 2001 | $30.0 | $66.3 | $34.5 | $130.8 | 23.0% | $28.5 | $66.7 | 42.8% |
| 2002 | $32.8 | $69.0 | $34.1 | $135.9 | 24.1% | $31.5 | $68.2 | 46.1% |
| 2003 | $33.0 | $71.9 | $38.7 | $143.6 | 23.0% | $31.1 | $70.0 | 44.4% |
| 2004 | $33.1 | $72.8 | $41.6 | $147.5 | 22.4% | $30.8 | $70.3 | 43.8% |
| 2005 | $35.1 | $75.3 | $42.8 | $153.2 | 22.9% | $33.7 | $74.1 | 45.5% |
| 2006 | $36.3 | $80.9 | $43.8 | $161.1 | 22.6% | $34.6 | $78.7 | 44.0% |
The increased Federal funding for highways available under the Transportation Equity Act for the 21st Century (TEA-21) and the Safe, Accountable, Flexible, Efficient Transportation Equity Act: A Legacy for Users (SAFETEA-LU) contributed to a 58.0 percent increase (from $102.0 billion to $161.1 billion in nominal dollars) in total highway spending by all levels of government between 1997 and 2006. Capital outlay by all levels of government increased by 62.7 percent in nominal dollar terms over the same period, from $48.4 billion to $78.7 billion.
The percentage of total highway expenditures that went for capital outlay peaked at 61.3 percent in 1958, the start of the Interstate era. Subsequently, capital outlay's share of total spending gradually declined to a low of 43.8 percent in 1983. As shown in Exhibit 6-6, this share climbed up above 50 percent in 2001, but has subsequently fallen back below this level. In 2006, about 48.9 percent of all highway expenditures were used for capital improvements.
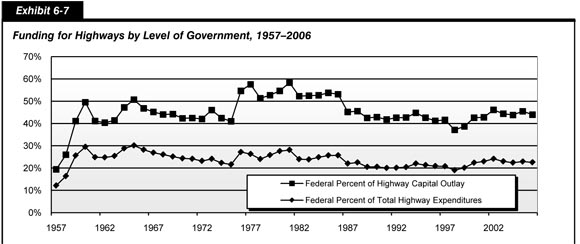
Exhibit 6-7 shows that the portion of total highway funding provided by the Federal government rose from 20.8 percent in 1997 to 22.6 percent in 2006. The Federal share of capital funding also increased significantly (from 41.6 percent to 44.0 percent) over this same period. Federal cash expenditures for capital purposes increased from $20.1 billion in 1997 to $34.6 billion in 2006, while State and local capital investment increased from $28.3 billion to $44.1 billion.
Federal support for highways increased dramatically following the passage of the Federal-Aid Highway Act of 1956 and the establishment of the HTF. The Federal share of total funding peaked in 1965 at 30.1 percent. Since that time, the Federal percentage of total funding gradually declined, dropping to a low of 19.0 percent in 1998. The Federal percentage of total funding rose steadily from 1998 until 2002 when it reached 24.1 percent, as the increased obligation authority provided under TEA-21 began to translate into higher cash outlays, but has generally declined since then. The Federally funded portion of capital outlay by all levels of government rose above 40 percent in 1959, peaking at 58.4 percent in 1981. From 1987 through 1997, the Federal share remained in a range of 41 to 46 percent. The Federal percentage of capital outlay dropped below this range in 1998, falling to 37.1 percent, but returned to this range in 2000 and has remained in it since.
| Do the relative Federal, State, and local shares of funding described in this chapter equate to a comparable relative degree of influence? | |
|
No. Significant intergovernmental transfers of funds occur from the Federal government to State and local governments, from State governments to local governments, and from local governments to State governments. Depending on the specific grant program, recipients have a varying degree of autonomy and discretion in how they use the funds. The relative degree of influence that each level of government has on what individual projects are funded and what types of highway expenditures are made is not necessarily consistent with the share of highway funding that each level of government provides. |
|
Spending by all levels of government on maintenance and traffic services increased by 51.0 percent in nominal dollar terms from 1997 to 2006, but declined as a percentage of total highway spending, since other types of expenditures grew even faster. As shown in Exhibit 6-6, maintenance and traffic services' share of total highway spending dropped to 25.1 percent. Spending on other noncapital expenditures, including highway law enforcement and safety, administration and research, and interest payments, declined from 21.8 percent of total spending to 21.3 percent. Debt retirement expenditures were the fastest-growing category of expenses between 1997 and 2006, but the rate of spending growth has declined since 2004.
| What factors have contributed to the increase in the BPI from 2004 to 2006? | |
|
The leading factors for the increase include strong growth in residential construction and global competition for construction materials. Transportation construction is one aspect of the national construction picture.
Among highway construction materials, the largest price increases have been associated with diesel fuel, steel, and concrete. Worldwide demand from China, Europe, India, and the United States has put pressure on the refining and producing capacities for these construction materials. In the United States, according to the Energy Information Agency, the transition to low-sulfur diesel fuel has affected diesel fuel production and distribution costs.
In addition to higher energy costs, a number of diverse factors are impacting construction costs. These include localized material shortages for specific construction products; consolidation in the highway industry (number of prime contractors, ownership of quarries, etc.); increased construction market opportunities in other areas, such as hurricane recovery reconstruction programs; the downsizing of the workforce due to instability of transportation funding prior to August 2005; spot shortages of skilled labor; regulatory restrictions, such as environmental permits for plants and quarries; and hurricane-related issues increasing non-highway construction demand.
|
|
Constant Dollar Expenditures
This report uses two indices for converting nominal dollar highway spending to constant dollars; the FHWA Composite Bid Price Index (BPI) is used for converting highway capital expenditures, while the Consumer Price Index (CPI) is used for converting noncapital highway spending. For some historic periods the BPI has grown faster than the CPI, while in others the CPI has grown faster. The BPI tends to be more volatile than the CPI, as it is affected by industry-specific trends as well as the general trends within the overall economy. This volatility was demonstrated in the period between 2004 and 2006, as sharp increases in the prices of materials such as steel, asphalt, and cement caused the BPI to increase by 43.3 percent, compared to a 6.7 percent increase in the CPI.
Exhibit 6-8 compares highway expenditures in current (nominal) and constant (real) dollars over time. While highway expenditures have grown in current dollar terms in each of the years from 1960 through 2006, constant dollar expenditures show a different pattern. In constant dollar terms, total highway expenditures reached a plateau in 1971, and did not keep pace with inflation from 1972 through 1981. Since 1981, constant dollar highway spending has increased; and by 1986, it had moved back above the 1971 level. Constant dollar spending reached an all time high in 2003, then dropped sharply to below 1999 levels.
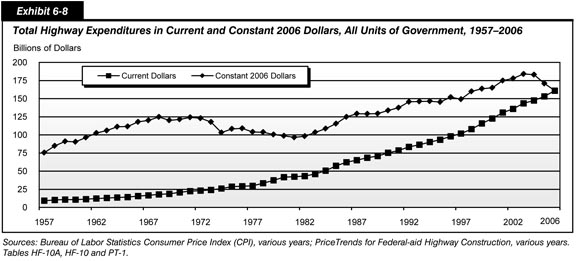
Despite the recent sharp decline in the purchasing power of highway capital investment, overall highway expenditures grew more quickly than inflation between 1997 and 2006. As noted earlier, total highway expenditures increased by 58.0 percent from $102.0 billion in 1997 to $161.1 billion in 2006, which equates to an average annual growth rate of 5.2 percent in nominal terms. Over the same period, the BPI increased at an average annual rate of 6.0 percent, and the CPI increased at an average annual rate of 2.6 percent. In constant dollar terms total highway expenditures grew by 7.9 percent from 1997 to 2006, equating to an average annual growth rate of 0.8 percent.
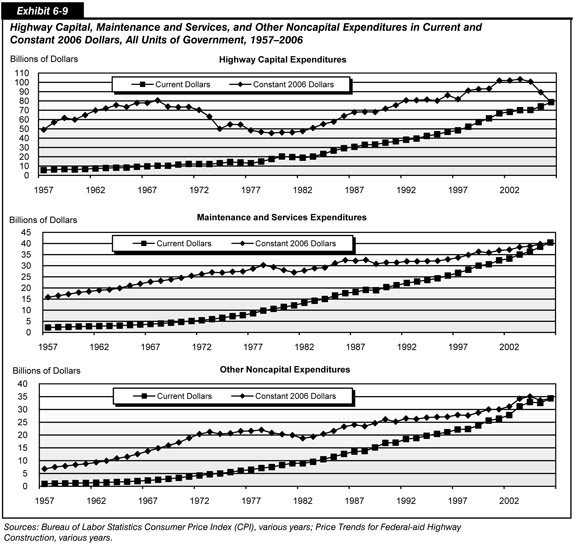
Exhibit 6-9 compares current dollar and constant dollar spending for capital outlay, maintenance and traffic services, and other noncapital expenditures (including highway law enforcement and safety, administration and research, and interest payments). As noted earlier, highway capital expenditures by all levels of government increased more quickly than noncapital expenditures, increasing 62.7 percent from $48.4 billion in 1997 to $78.7 billion in 2006, which equates to an average annual growth rate of 5.6 percent in nominal dollar terms. Because this rate of increase is smaller than the increase in the BPI over this period, highway capital expenditures fell by 4.0 percent from 1997 to 2006, equating to an average annual decline of 0.8 percent. In constant dollar terms, highway capital expenditures in 2006 were at their lowest level since 1991.
| Are the recent increases observed in the BPI unprecedented? | |
|
No. The increase in the BPI between 2004 and 2006 was of approximately the same magnitude as the increase from 1977 to 1979, and smaller than its growth from 1972 to 1974.
Other indices such as the Bureau of Labor Statistics' (BLS') Producer Price Index Industry Data for Highway and Street Construction also show large increases in this general time frame. Between 2003 and 2006, this index rose 35.3 percent, compared to a 47.7 percent increase for the same period in the BPI. Sharp increases in steel prices beginning in 2003 were followed by increases in petroleum, concrete, and other highway construction materials.
The BLS index cited above increased by an additional 5.8 percent in 2007 and 13.8 percent in 2008. However, after peaking in July 2008, the index has subsequently declined back close to its 2007 level. No 2007 or 2008 data for the BPI are available, because the index has been discontinued. A replacement index is currently being developed that will draw upon bid price data generated by States for both State-only and Federal-aid projects. The next edition of this report will utilize this new index to recalculate historic constant dollar highway expenditure data.
|
|
In constant dollar terms based on the CPI, spending for maintenance and traffic services reached an all time high in 2006, increasing 20.2 percent (2.1 percent per year) over the nine-year period beginning in 1997. Other noncapital expenditures grew by 23.1 percent (3.3 percent per year) in constant dollar terms over this same period.
Total highway expenditures funded by State and local governments, which includes a mix of capital and noncapital spending, grew by 9.6 percent (1.0 percent per year) in constant dollar terms from 1997 to 2006. Highway capital spending funded by State and local governments fell by 7.8 percent (0.9 percent per year) in constant dollar terms over this period. Expenditures funded by the Federal government, which are more heavily weighted towards capital items, grew by 2.5 percent in constant dollar terms (0.3 percent per year) from 1997 to 2006. Federally funded highway capital spending grew by 1.4 percent (0.2 percent per year) over this period.
Looking back further to 1981, the growth of capital expenditures and noncapital expenditures is more consistent in constant dollar terms. Over this 25-year period, highway capital outlay grew at an average annual rate of 5.7 percent from $19.0 to $78.7 billion in nominal dollars; in constant dollar terms this equates to a 70.0 percent increase (2.1 percent per year). Over this same period, maintenance and traffic services grew by 49.8 percent in constant dollar terms (1.6 percent per year), and other noncapital expenditures grew by 72.2 percent in constant dollar terms (2.2 percent per year).
Constant Dollar Expenditures per Vehicle Mile Traveled
While not all types of highway expenditures would necessarily be expected to grow in proportion to vehicle miles traveled (VMT), increases in VMT do increase the wear and tear on existing roads, leading to higher capital and maintenance costs. The addition of new lanes and roads to accommodate additional traffic results in one-time capital costs, as well as recurring costs for rehabilitation and maintenance. Traffic supervision and safety costs are also related in part to traffic volume. As the highway system has grown and become more complex, the cost of administering the system has grown as well.
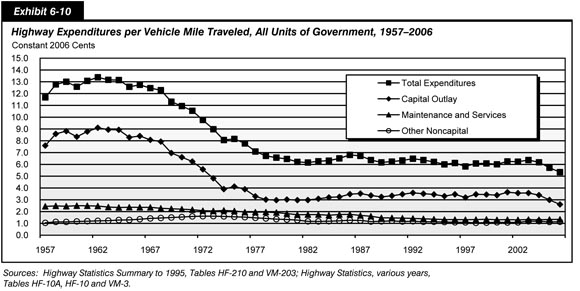
In current dollar terms, total expenditures per VMT have grown steadily over time. Between 1997 and 2006, expenditures per VMT rose from 4.0 cents to 5.3 cents. However, expenditures per VMT in constant dollars fell by 8.3 percent during this period. The initial peak in total expenditures per VMT in constant dollars during the early 1960s corresponds to the significant level of new construction and rapid Interstate Highway System expansion during that timeframe. This was followed by a steady decline in total constant dollar expenditures per VMT during the 1960s and 1970s, with the rate of decline slowing during the 1980s and early 1990s but reaccelerating after 2003. Capital outlay per VMT fell by 18.4 percent between 1997 and 2006 in constant dollar terms. Spending on maintenance and traffic services increased by 2.2 percent over this same period in terms of constant cents per VMT basis, while constant spending per VMT on other noncapital items rose 4.7 percent. These data are shown in Exhibit 6-10.
Highway Capital Outlay Expenditures
State governments directly spent $59.0 billion on highway capital outlay in 2006. Exhibit 6-11 shows how States applied this $59.0 billion to different functional systems. It also includes an estimate of how the total $78.7 billion spent by all levels of government was applied. State government capital outlay is concentrated on the higher-order functional systems, while local governments apply the larger part of their capital expenditures to lower-order systems.
| Functional Class | Direct State Capital Outlay (Billions of Dollars) | Capital Outlay, All Jurisdictions | ||
|---|---|---|---|---|
| Total (Billions of Dollars) | Per Lane Mile (Dollars) | Per VMT (Cents) | ||
| Rural Arterials and Collectors | ||||
| Interstate | $4.2 | $4.2 | $33,709 | 1.6 |
| Other Principal Arterial | 9.5 | 9.5 | 38,449 | 4.1 |
| Minor Arterial | 4.4 | 5.0 | 17,567 | 3.0 |
| Major Collector | 3.1 | 4.4 | 5,193 | 2.3 |
| Minor Collector | 0.4 | 1.2 | 2,343 | 2.1 |
| Subtotal | $21.6 | $24.3 | $12,009 | 2.7 |
| Urban Arterials and Collectors | ||||
| Interstate | 12.4 | 12.4 | 140,443 | 2.6 |
| Other Freeway and Expressway | 5.3 | 5.5 | 110,037 | 2.5 |
| Other Principal Arterial | 8.5 | 10.6 | 48,082 | 2.3 |
| Minor Arterial | 3.5 | 6.4 | 24,240 | 1.7 |
| Collector | 0.9 | 3.3 | 14,206 | 1.9 |
| Subtotal | $30.5 | $38.1 | $44,679 | 2.2 |
| Subtotal, Rural and Urban | $52.0 | $62.4 | $21,697 | 2.4 |
| Rural and Urban Local | $7.0 | $16.3 | $2,936 | 4.1 |
| Total, All Systems | $59.0 | $78.7 | $9,343 | 2.6 |
| Funded by Federal Government* | $32.8 | $34.6 | $4,109 | 1.1 |
Total highway capital expenditures by all levels of government amounted to $9,343 per lane mile in 2006, or 2.6 cents per VMT. Capital outlay per lane mile was generally greatest for the higher-order functional systems and was greater on urban roads than rural roads.
Capital outlay per VMT ranged from 4.1 cents on rural other principal arterials to 1.6 cents on rural Interstates. Capital outlay per lane mile was greater on urban roads than rural roads; however, when measured by VMT, outlay per VMT was greater on rural routes than urban routes. Between 2004 and 2006, capital outlay per VMT grew from 2.4 cents to 2.7 cents on rural roads, while it remained steady on urban roads at 2.2 cents.
Capital Outlay by Improvement Type
States provide the FHWA with detailed data on what they spend on arterials and collectors, classifying expenditures on each functional system into 17 improvement types. For this report, these improvement types have been allocated among three groups: System Rehabilitation, System Expansion, and System Enhancement.
| How are "system rehabilitation," "system expansion," and "system enhancement" defined in this report? | |
|
System rehabilitation consists of capital improvements on existing roads and bridges that are intended to preserve the existing pavement and bridge infrastructure. These activities include reconstruction, resurfacing, pavement restoration or rehabilitation, widening of narrow lanes or shoulders, bridge replacement, and bridge rehabilitation. Also included is the portion of widening (lane addition) projects estimated to be related to reconstructing or improving existing lanes. System rehabilitation does not include routine maintenance costs. As shown in Exhibit 6-5, an additional $31.3 billion was spent by all levels of government in 2006 on routine maintenance.
System expansion includes construction of new roads and new bridges and addition of new lanes to existing roads. This includes all "New Construction," "New Bridge," "Major Widening," and most of the costs associated with "Reconstruction-Added Capacity," except for the portion of these expenditures estimated to be related to improving the existing lanes of a facility. As used in this report, "System Expansion" is the functional equivalent to "Capacity Expansion" used in some previous editions. The term was modified because some system rehabilitation and system enhancement improvements may result in added capacity without the addition of new lanes.
System enhancement includes safety enhancements, traffic operations improvements such as the installation of intelligent transportation systems, and environmental enhancements.
|
|
Exhibit 6-12 shows the distribution of the $52.0 billion in State expenditures among these three categories. Detailed data on Federal government and local expenditures are unavailable, so the combined $62.4 billion of capital outlay on arterials and collectors by all levels of government was classified based on the State expenditure patterns. Similarly, little information is available on the types of improvements being made by all levels of government on local functional system roads. To develop an estimate for the improvement type breakdown for the $78.7 billion invested on all systems in 2006, it was assumed that expenditure patterns were roughly equivalent to those observed for rural minor collectors.
| (Billions of Dollars) | |||||
|---|---|---|---|---|---|
| System Rehabilitation | System Expansion | System Enhancement | Total | ||
| New Roads and Bridges | Existing Roads | ||||
| Direct State Expenditures on Arterials and Collectors | |||||
| Right-of-Way | $2.0 | $1.8 | $3.8 | ||
| Engineering | $3.3 | 1.3 | 1.2 | $0.6 | 6.3 |
| New Construction | 7.5 | 7.5 | |||
| Relocation | 1.0 | 1.0 | |||
| Reconstruction—Added Capacity | 1.8 | 4.2 | 6.0 | ||
| Reconstruction—No Added Capacity | 4.0 | 4.0 | |||
| Major Widening | 2.6 | 2.6 | |||
| Minor Widening | 0.9 | 0.9 | |||
| Restoration and Rehabilitation | 8.6 | 8.6 | |||
| Resurfacing | 0.3 | 0.3 | |||
| New Bridge | 0.8 | 0.8 | |||
| Bridge Replacement | 3.5 | 3.5 | |||
| Major Bridge Rehabilitation | 1.0 | 1.0 | |||
| Minor Bridge Work | 1.9 | 1.9 | |||
| Safety | 1.5 | 1.5 | |||
| Traffic Management/Engineering | 1.0 | 1.0 | |||
| Environmental and Other | 1.4 | 1.4 | |||
| Total, State Arterials and Collectors | $25.4 | $11.5 | $10.8 | $4.3 | $52.0 |
| Total, Arterials and Collectors, All Jurisdictions (estimated)* | |||||
| Highways and Other | 23.1 | 12.1 | 12.9 | 5.5 | 53.6 |
| Bridges | 7.9 | 0.9 | 8.8 | ||
| Total, Arterials and Collectors | $31.1 | $13.0 | $12.9 | $5.5 | $62.4 |
| Total Capital Outlay on All Systems (estimated)* | |||||
| Highways and Other | 30.2 | 15.0 | 13.8 | 8.2 | 67.3 |
| Bridges | 10.1 | 1.2 | 11.4 | ||
| Total, All Systems | $40.4 | $16.2 | $13.8 | $8.2 | $78.7 |
| Percent of Total | 51.3% | 20.6% | 17.6% | 10.5% | 100.0% |
In 2006, about $40.4 billion was spent on system rehabilitation (51.3 percent of total capital outlay). As defined in this report, system rehabilitation activities include capital improvements on existing roads and bridges that are designed to preserve the existing pavement and bridge infrastructure. These improvements do not include routine maintenance.
About $16.2 billion—20.6 percent of total capital outlay—was spent on the construction of new roads and bridges in 2006. An additional $13.8 billion, or 17.6 percent, was used to add lanes to existing roads. Another $8.2 billion, or 10.5 percent, was spent on system enhancement, including safety enhancements, traffic operations improvements, and environmental enhancements.
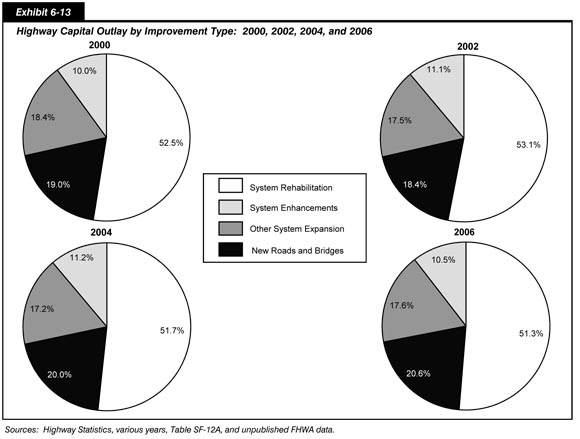
Exhibit 6-13 depicts the change over time in the share of capital outlay devoted to these major categories. The overall share of highway capital improvements going toward system rehabilitation slightly decreased between 2000 and 2006, declining to 51.3 percent. The share devoted to system enhancements increased between 2000 and 2006, growing to 10.5 percent. Expenditures for new roads and bridges relative to other improvement expenditures increased from 19.0 percent in 2000 to 20.6 percent in 2006.
| Are the data shown in Exhibit 6-13 consistent with comparable information provided in previous editions of this report? | |
|
No. The information for 2002 and 2004 have been revised to correct errors in the underlying data for these years. In addition, the methodology used to estimate the distribution of local functional class expenditures was modified for each of the years depicted in the exhibit. As a result of this change, the estimated percentages for system enhancements and new roads and bridges increased, while the estimated percentages for other system expansion and system rehabilitation decreased.
|
|
Exhibit 6-14 shows significant variations in the types of capital expenditures made by States on different functional systems. The portion of capital outlay devoted to system rehabilitation ranges from 34.4 percent on urban other principal arterials to 73.6 percent on rural major collectors. Overall, system rehabilitation's share on arterials and collectors in rural areas (59.4 percent) was greater than in urban areas (43.7 percent).
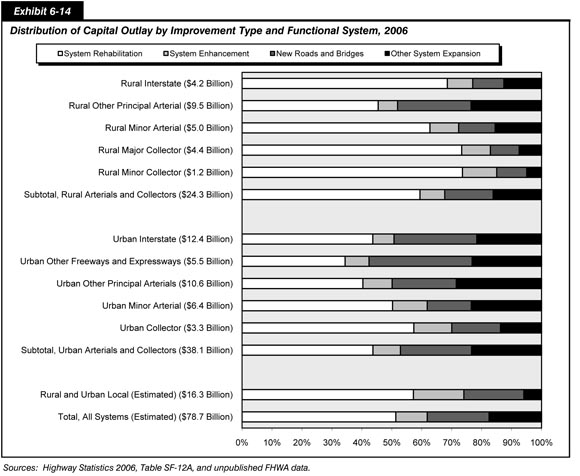
System expansion expenditures also vary significantly by functional class. The portion of capital used for construction of new roads and bridges is highest on urban other freeways and expressways, at 34.4 percent, while urban other principal arterials have the largest share going to other system expansion improvements, at 28.5 percent. Urban other freeways and expressways have over 57.6 percent of capital investment devoted to system expansion).
Constant Dollar Expenditures by Improvement Type
As noted earlier, inflation has greatly reduced the relative purchasing power of transportation dollars. Between 1997 and 2006, highway capital outlay expenditures declined by 4.0 percent in constant dollar terms. Investment in system expansion—such as the widening of roads and the construction of new facilities—decreased by 14.2 percent in constant dollar terms, reflecting the increased cost of materials. At the same time, spending on other improvements increased. In constant dollar terms, investment in system enhancement increased by 22.7 percent, while funding for system rehabilitation grew by 0.4 percent.
Capital Outlay on the National Highway System
The National Highway System (NHS), which is described more fully in Chapter 2, includes the Interstate Highway System and other roads important to the nation's economy, defense, and mobility. Exhibit 6-15 identifies the distribution of the $37.1 billion of capital outlay on the NHS in 2006 by functional system. Approximately $13.5 billion was invested on rural arterials and collectors that year, and another $23.3 billion was spent on urban arterials and collectors. An estimated $0.3 billion was spent on NHS routes functionally classified as rural local or urban local, which would mainly consist of intermodal connectors and STRAHNET Connectors.
| Functional Class | Total (Billions of Dollars) | Percent of Total NHS |
|---|---|---|
| Rural Arterials and Collectors | ||
| Interstate | $4.2 | 11.3% |
| Other Principal Arterial | $8.2 | 22.1% |
| Minor Arterial | $0.6 | 1.7% |
| Major Collector | $0.4 | 1.2% |
| Minor Collector | $0.0 | 0.0% |
| Subtotal | $13.5 | 36.3% |
| Urban Arterials and Collectors | ||
| Interstate | $12.4 | 33.3% |
| Other Freeway and Expressway | $4.9 | 13.3% |
| Other Principal Arterial | $5.5 | 14.7% |
| Minor Arterial | $0.4 | 1.2% |
| Collector | $0.2 | 0.4% |
| Subtotal | $23.3 | 62.9% |
| Subtotal, Rural and Urban | $36.8 | 99.2% |
| Rural and Urban Local | $0.3 | 0.8% |
| Total, All Systems | $37.1 | 100.0% |
Exhibit 6-16 categorizes capital spending on the NHS by type of improvement. System rehabilitation expenditures of $16.6 billion constituted 44.7 percent of total NHS capital spending in 2006. The $17.7 billion spent for system expansion represented 47.7 percent of total NHS capital spending, while the $2.8 billion spent for NHS system enhancement constituted 7.6 percent. Between 2004 and 2006, there was an increase in the relative share of spending directed to NHS rehabilitation projects (up from 43.5 percent), an increase in the share of spending for NHS expansion (up slightly from 47.6 percent), and a decrease in the share of spending for NHS enhancement (down from 8.9 percent).
| Total Invested (Billions of Dollars) |
Total NHS Capital Spending | NHS Percent of Total Capital Expenditures for All Highways | |||||
|---|---|---|---|---|---|---|---|
| Rural | Urban | Total | Rural | Urban | Total | ||
| System Rehabilitation | |||||||
| Highway | $6.0 | $6.2 | $12.3 | 33.1% | 19.7% | 20.3% | 40.1% |
| Bridge | $1.1 | $3.2 | $4.3 | 11.6% | 9.2% | 26.4% | 35.6% |
| Subtotal | $7.2 | $9.4 | $16.6 | 44.7% | 16.7% | 22.0% | 38.8% |
| System Expansion | |||||||
| Additions to Existing Roadways | $2.6 | $5.5 | $8.1 | 21.8% | 18.8% | 39.7% | 58.5% |
| New Routes | $2.6 | $6.3 | $8.9 | 24.0% | 19.1% | 46.2% | 65.3% |
| New Bridges | $0.1 | $0.6 | $0.7 | 1.9% | 13.2% | 57.0% | 70.1% |
| Subtotal | $5.3 | $12.3 | $17.7 | 47.7% | 18.8% | 43.4% | 62.2% |
| System Enhancements | $1.0 | $1.8 | $2.8 | 7.6% | 12.9% | 24.7% | 37.6% |
| Total Investment | $13.5 | $23.6 | $37.1 | 100.0% | 17.1% | 30.0% | 47.1% |
The $37.1 billion spent for capital improvements to the NHS in 2006 constituted 47.1 percent of the $78.7 billion that all governments expended on highway capital projects that year. Approximately 38.8 percent of total highway rehabilitation investment on all roads was directed toward the NHS, including 16.7 percent directed toward rural NHS routes and 22.0 percent directed toward urban NHS routes.
Of total highway system expansion investment on all roads in 2006, approximately 62.2 percent was directed toward the NHS, including 18.8 percent directed toward rural NHS routes and 43.4 percent directed toward urban NHS routes. Approximately 37.6 percent of total capital expenditures classified as system enhancements in 2006 were directed toward NHS routes.
Capital Outlay on the Interstate Highway System
Of the $37.1 billion spent by all levels of government for the capital improvements to the NHS in 2006, 44.6 percent was used on the Interstate component of the NHS. Exhibit 6-17 describes how the $16.5 billion of Interstate capital spending in 2006 was distributed by type of improvement. In 2006, all levels of government combined directed 49.9 percent of their Interstate-related expenditures to system rehabilitation, 42.6 percent to system expansion, and 7.4 percent to system enhancement. Between 2004 and 2006, there was a decrease in the relative share of spending directed to Interstate rehabilitation projects (down from 50.8 percent), an increase in the share of spending for Interstate expansion (up from 40.9 percent), and a slight increase in the share of spending for Interstate enhancement (up from 8.3 percent).
| Total Invested (Billions of Dollars) |
Percent of Total Interstate Capital Spending | Percent of Total for All Functional Classes | |||||
|---|---|---|---|---|---|---|---|
| Rural | Urban | Total | Rural | Urban | Total | ||
| System Rehabilitation | |||||||
| Highway | $2.5 | $3.2 | $5.8 | 34.8% | 8.3% | 10.5% | 18.8% |
| Bridge | $0.3 | $2.2 | $2.5 | 15.1% | 2.8% | 17.9% | 20.7% |
| Subtotal | $2.9 | $5.4 | $8.3 | 49.9% | 6.7% | 12.6% | 19.3% |
| System Expansion | |||||||
| Additions to Existing Roadways | $0.5 | $2.7 | $3.2 | 19.4% | 3.8% | 19.4% | 23.2% |
| New Routes | $0.4 | $3.1 | $3.5 | 21.3% | 3.0% | 22.8% | 25.8% |
| New Bridges | $0.0 | $0.3 | $0.3 | 1.9% | 2.6% | 29.9% | 32.6% |
| Subtotal | $1.0 | $6.1 | $7.1 | 42.6% | 3.4% | 21.4% | 24.8% |
| System Enhancements | $0.4 | $0.9 | $1.2 | 7.4% | 4.7% | 11.7% | 16.4% |
| Total Investment | $4.2 | $12.4 | $16.5 | 100.0% | 5.3% | 15.7% | 21.0% |
Exhibit 6-18 examines these changes in greater detail. Most notably, increased funding for Interstate expansion projects was targeted in urban areas. Between 2004 and 2006, there was a 39.7 percent increase in spending for system expansion projects on urban Interstates, and a 22.6 percent decline in Interstate expansion activities in rural areas. Overall, between 2004 and 2006, there was a 26.2 percent increase in capital spending on urban Interstates, and a 7.5 percent increase on rural Interstates.
| 2004 (Billions of Dollars) | 2006 (Billions of Dollars) |
Percent Change 2006/2004 | |||||||
|---|---|---|---|---|---|---|---|---|---|
| Rural | Urban | Total | Rural | Urban | Total | Rural | Urban | Total | |
| System Rehabilitation | |||||||||
| Highway | $1.9 | $2.8 | $4.7 | $2.5 | $3.2 | $5.8 | 31.4% | 16.6% | 22.7% |
| Bridge | $0.4 | $1.8 | $2.3 | $0.3 | $2.2 | $2.5 | -21.1% | 18.3% | 10.8% |
| Subtotal | $2.4 | $4.6 | $7.0 | $2.9 | $5.4 | $8.3 | 21.9% | 17.3% | 18.8% |
| System Expansion | |||||||||
| Additions to Existing Roadways | $0.7 | $2.2 | $2.9 | $0.5 | $2.7 | $3.2 | -24.2% | 21.4% | 10.5% |
| New Routes | $0.5 | $2.0 | $2.5 | $0.4 | $3.1 | $3.5 | -19.5% | 57.1% | 41.4% |
| New Bridges | $0.0 | $0.2 | $0.2 | $0.0 | $0.3 | $0.3 | -32.5% | 73.6% | 54.1% |
| Subtotal | $1.2 | $4.4 | $5.6 | $1.0 | $6.1 | $7.1 | -22.6% | 39.7% | 25.9% |
| System Enhancements | $0.3 | $0.8 | $1.1 | $0.4 | $0.9 | $1.2 | 19.2% | 5.1% | 8.8% |
| Total Investment | $3.9 | $9.8 | $13.7 | $4.2 | $12.4 | $16.5 | 7.5% | 26.2% | 20.9% |
It is important to note that, for any particular functional class (such as rural Interstates) and any particular type of capital improvement (such as the bridge component of system rehabilitation), year-to-year spending is much more variable than for total capital investment of all types. Year-to-year investment can be more easily affected by large individual projects that happen to have a high level of cash outlays in a given year. The changes in expenditure patterns observed between 2004 and 2006, therefore, may not represent a long-term trend. This comparison is included primarily to help put into perspective the comparisons of 2006 spending with the future capital investment scenarios discussed in Part II of this report.
Innovative Finance
In recent years, governments throughout the United States have experimented with new ways of financing transportation projects. As costs have increased for many of these projects, officials have often tried to replicate some of the most successful strategies of the private sector. Some officials have taken this approach much further, engaging the private sector as an active partner in delivering projects. As a result, innovative finance is a far more advanced element of transportation policy than it was 5 or 10 years ago. This section describes how innovative finance is complementing traditional methods of paying for the Nation's surface transportation projects.
Innovative finance includes a combination of specially designed techniques that aid traditional funding methods in providing financing for transportation projects. These techniques open up new streams of revenue, helping to retire debt obligations; and reduce financing and related costs, freeing up savings for other projects. While these methods are commonly used in the private sector, they are relatively new to Federally aided transportation funding.
Innovative finance concepts have evolved over time. The Intermodal Surface Transportation Efficiency Act (ISTEA) and TEA-21 laid the foundations for several new concepts designed to fund transportation investment. SAFETEA-LU has continued the development of innovative financing mechanisms. SAFETEA-LU advanced the use of Public-Private Partnerships (PPPs), credit assistance, and innovative debt financing as tools in transportation finance.
Public-Private Partnerships
There is a long history of the private sector providing transportation service. In the late 1700s and early 1800s, private toll roads opened the interior United States to commerce and settlement. More recently, commercial and residential developers have helped finance local roads so that new projects could be built. These developers have either built the roads themselves, or paid impact fees that local governments used to complete new routes.
While private sector investment has slowed somewhat since the advent of public financing for highways, there has been renewed interest in private sector involvement as transportation budgets have been stretched. Additionally, private sector arrangements are central to many projects that involve freight transportation, since nearly all service providers and many elements of freight infrastructure are private.
| Are PPPs limited to the transportation sector? | |
|
No. PPPs are used regularly in several sectors, including water and wastewater, education, health care, corrections, parks and recreation, and technology.
|
|
Today, a variety of public-private partnerships (PPPs) are being used to provide transportation services. A public-private partnership is a broad term that refers to contractual agreements formed between public and private sector partners. Under this arrangement, the private sector steps out of its traditional role and becomes more active in making decisions as to how a project will be accomplished.
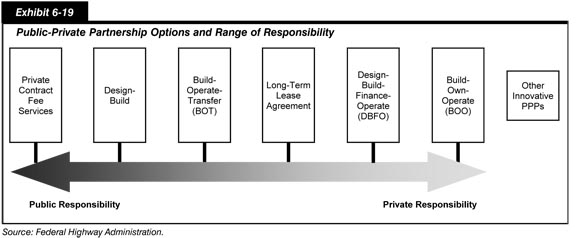
Public-private partnerships can be applied to a large range of transportation functions across all modes. These functions may include project conceptualization, design, finance, construction, maintenance, toll collection, and project maintenance. Exhibit 6-19 describes the more common PPP options currently being used in the United States. It shows how the range of responsibilities shifts from the public to the private sectors depending on different PPP options, which are described below. Exhibit 6-20 provides a list of the PPPs being implemented across the United States, either on existing facilities or new capacities.
| PPP | Location | Status |
|---|---|---|
| Existing Facility | ||
| Chicago Skyway | Illinois | Closed |
| Indiana Toll Road | Indiana | Closed |
| Pocahontas Parkway | Virginia | Closed |
| Northwest Parkway | Colorado | Closed |
| Dulles Greenway | Virginia | Closed |
| Pennsylvania Turnpike | Pennsylvania | Request for Quotation (RFQ) Issued |
| Greenville Southern Connector | South Carolina | RFQ Issued |
| New Capacity * | ||
| Trans-Texas Corridor (TTC) -35 | Texas | Concession Awarded |
| SH-130 Segments 5 and 6 | Texas | Closed |
| I-69/TTC | Texas | Request For Proposals (RFP) Issued |
| I-635 | Texas | RFP Issued |
| North Tarrant Express | Texas | Bidders Shortlisted |
| Dallas/Fort Worth (DFW) Connector | Texas | Bidders Shortlisted |
| SH-161 | Texas | Bidders Shortlisted |
| US-281/Loop 1604 | Texas | Bidders Shortlisted |
| Capital Beltway High-Occupancy Toll (HOT) Lanes | Virginia | Closed |
| I-95/I-395 HOT Lanes | Virginia | Interim Agreement Executed |
| US Route 460 | Virginia | Bidders Shortlisted |
| Midtown Corridor Tunnel | Virginia | Expressions of Interest Submitted |
| Port of Miami Tunnel | Florida | Preferred Bidder Selected |
| I-595 Improvements | Florida | Bidders Shortlisted |
| First Coast Outer Beltway | Florida | RFQ Issued |
| Northwest Corridor | Georgia | Development Agreement Executed |
| I-285 Northwest Truck-Only Toll (TOT) Lanes | Georgia | Evaluation of Proposers |
| GA-400 Crossroads Region | Georgia | Evaluation of Proposal |
| I-20 Managed Lanes | Georgia | Pre-Solicitation |
| Missouri Safe and Sound Bridge Program | Missouri | Preferred Bidder Selected |
| Oakland Airport Connector | California | RFP Issued |
| Knik Arm Crossing Project | Alaska | Bidders Shortlisted |
| Denver Regional Transportation District (RTD) | Colorado | RFQ Expected |
| I-73 | South Carolina | Request for Conceptual Proposals |
Private Contract-Fee Services
Many public agencies are transferring responsibility for services they would typically perform to private sector companies. Agencies that use private contract-fee services can tap private sector technical, management, and financial planning expertise in new ways. This often reduces the work burden for agency staff, and it can provide access to innovative technology and specialized expertise. Maintenance, operations, and finance are three areas where this approach is often used.
As an example of this model, the South Carolina Department of Transportation has implemented a statewide program to accelerate the completion of 200 highway improvement projects in 7 years, instead of 27. Because the State did not want to add new personnel, the Department of Transportation entered into partnerships with two private construction and resource management firms. It was agreed that these companies would work on strategic planning, financial management, design, and construction activities.
Design-Build
With the second model, Design-Build delivery, design and construction phases are merged into a single contract. The design-builder assumes responsibility for the majority of the design work and all construction activities, together with the risks associated with providing these services, for a fixed fee. When using Design-Build delivery, owners usually retain responsibility for financing, operating, and maintaining the project. While Design-Build procurement has been more prevalent in private sector work, it is also gaining acceptance among many public agencies. SAFETEA-LU advanced the use of Design-Build delivery by eliminating an FHWA requirement that prohibited agencies from issuing requests for proposals and entering into contracts until after environmental approval. This had been a particular problem for PPPs, since there are many advantages in having the private sector partner involved in the environmental review process.
| The 2006 edition of the C&P report listed the Design-Bid-Build model on the continuum of public-private partnerships. Why has it been removed from this edition of the report? | |
|
The Federal government does not consider the Design-Bid-Build model a PPP because it fails to go beyond the "traditional" arrangement for implementing projects.
The Design-Bid-Build model was used for much of the Twentieth Century. A Design-Bid-Build model segregates design and construction responsibilities by awarding them to an independent private engineer and a separate private contractor. The delivery process is separated into three linear phases: (1) design, (2) bid, and (3) construction. During the initial design phase, a transportation agency awards a design contract to an engineer or architect, who completes a final project design and supporting documentation. In the second phase, the owner uses this documentation to assemble construction bid documents. Pre-qualified contractors are invited to submit competitive, lump-sum bids; and the owner awards the construction contract to the contractor submitting the lowest responsible bid or total contract price. In the construction phase that follows, the owner retains responsibility for monitoring the contractor's performance.
|
|
Alaska's Anton Anderson Memorial Tunnel is an example of both the private contract-fee service model and the Design-Build model. To convert the former railroad tunnel for both rail and highway use, the Alaska Department of Transportation and Public Facilities awarded a Design-Build contract. Once the project was finished, the State outsourced the operation of the tunnel to a private highway asset management and operations company. Since the tunnel opened in 2000, that firm's responsibilities have included toll collection and administration, emergency response, snow removal, maintenance, and the complex procedures by which the tunnel switches between train and automobile use.
Build-Operate-Transfer/Design-Build-Operate-Maintain
The third model, "turnkey procurement," is more formally known as Build-Operate-Transfer (BOT)/Design-Build-Operate-Maintain (DBOM). This approach combines responsibility for usually separate functions—design, construction, and operations and maintenance—under a single entity. One advantage of this approach is that the private sector team is required to establish a long-term maintenance program up front, together with estimates of the associated costs. This might reduce the likelihood that problems with the physical performance of the infrastructure asset will go unnoticed, saving money in the long run.
Recent improvements to Massachusetts Route 3 were completed through a BOT/DBOM contract. Under a traditional public process, the improvements would have required five different contract packages and taken 12 to 15 years to complete. Instead, the State used a BOT/DBOM approach, cutting the construction time in half. Through a competitive process, the Massachusetts Highway Department selected a private developer to finance, design, and build the project, then operate and maintain the facility for 30 years. The developer may generate nonproject revenues through ancillary development in the corridor. The developer also shares in the sale of fiber optic rights and the sublease of a service plaza.
Long-Term Lease Arrangements
The fourth model, that which is used in long-term lease arrangements, involves the leasing of an existing, publicly financed toll facility to a private sector concessionaire for a certain period of time. The transportation agency awards long-term leases on a competitive basis, picking the most attractive offer. The amount of the concession fee is typically the most important factor, but other criteria may include the length of the concession period and the creditworthiness and professional qualifications of the bidders. Once the award is made, the concessionaire pays the upfront concession fee, then has the right to collect tolls on the facility for a specified time period. In exchange, the private partner must operate and maintain the road, often making improvements.
Long-term lease arrangements are among the most visible, hotly debated innovations in transportation today. Supporters argue that long-term leases are among the fastest ways to improve transportation services in an era when public funding is limited and citizens are often reluctant to pay higher taxes. By transferring toll setting responsibilities to the private sector, they argue, the process is depoliticized. They also argue that the large, up-front concession fees can be used to fund badly needed transportation projects elsewhere. Opponents of long-term lease arrangements, however, claim that the public can lose control over toll rates, and that tolls may become potentially burdensome. Opponents also argue that, in the long run, the public agency loses a consistent stream of revenue.
| What terms and conditions can help preserve some public control over facilities that are part of long-term lease arrangements? | |
|
There are several ways a long-term lease arrangement can be structured to preserve some public control. Transportation agencies can provide oversight of the private sector partner's performance, and require specific capital reinvestment, safety, and customer services requirements in their lease agreements. Other regulations can be enacted to ensure that the lease proceeds are used to support transportation improvements in prescribed areas. Provisions can also be incorporated requiring sharing of excess revenues between the public and private entities if toll revenues exceed some predetermined level. |
|
Over the past several years, there have been several high-profile long-term lease arrangements. In 2005, the City of Chicago announced that it had entered into an agreement with a consortium to lease the 7.8-mile Chicago Skyway Toll Bridge System for 99 years. Under the lease agreement, the consortium paid the City of Chicago $1.83 billion for the right to operate and collect tolls on the Chicago Skyway. The privatization of the Skyway, an existing toll road, was the first agreement of its kind in the United States. The lease agreement established maximum toll rates and set facility performance standards. The consortium is responsible for all operating and maintenance costs of the Skyway and will have the right to all toll revenue. In this particular example, the toll road concession revenues were treated as general revenues to the city, rather than being dedicated to highway or transit improvements.
In 2006, the same consortium entered into an agreement with the Indiana Finance Authority to take over operations of the 157-mile Indiana Toll Road for the next 75 years. The concession agreement established toll rates and possible increases, and it placed limits on the return on investment for the concessionaire. The $3.8 billion concession fee will provide funding for about 200 transportation projects around the State, including the construction of Interstate 69 between Evansville and Indianapolis.
Also in 2006, the Virginia Department of Transportation executed agreements to turn over the Pocahontas Parkway to a private concessionaire for 99 years. Under the terms of those agreements, the concessionaire acquired the sole right to enhance, manage, operate, maintain, and collect tolls on the Parkway. The $548 million concession fee relieved the Virginia Department of Transportation from all debt related to the construction of the Pocahontas Parkway. This arrangement—combined with credit from the Transportation Infrastructure Finance and Innovation Act (TIFIA) program—will also lead to the construction of a four-lane extension to Richmond International Airport.
All three of these projects involved foreign investors. The PPP markets in Europe and Australia are more mature than those in the United States, and experienced investors from both continents are actively seeking out new opportunities in the United States. Several American financial institutions, however, are now establishing infrastructure investment funds. The new authority provided by SAFETEA-LU to issue tax exempt private activity bonds for transportation projects may encourage American investors to expand their activity in the domestic toll road market.
| How have other countries used PPPs to provide transportation services? | |
|
PPPs are central to the transportation policies of several European countries. In these countries, highway agencies are beginning to take on the role of network operator rather than provider of services.
The United Kingdom has some of the most extensive experience with PPPs, where they became popular in the early 1990s as local governments struggled with maintenance and reconstruction costs. Improvements were often delayed and, when construction finally began, limited public funds meant that completion was often delayed. Since that time, the use of PPPs has proven to be a remarkable remedy. A survey by the United Kingdom Treasury showed that of 61 PPP projects, nearly 90 percent were completed early or on time. Projects that were not completed on time were completed within three months of the scheduled date.
In France, long-term lease arrangements have been used for more than three decades. Portugal is aggressively using long-term lease arrangements as part of its long-term transportation strategic plan, and eventually aims to have 90 percent of its national network administered by concessions.
|
|
Design-Build-Finance-Operate
The fifth model, the Design-Build-Finance-Operate (DBFO) approach, bundles together all design, construction, finance, and operation activities, transferring these functions to private sector partners. There is a great deal of variety in DBFO arrangements in the United States, especially in the degree to which financial responsibilities are actually transferred to the private sector. One commonality among all DBFO projects is that they are either partly or wholly financed by debt leveraging revenue streams dedicated to the project. Tolls are the most common revenue source; however, other finance mechanisms may include lease payments and vehicle registration fees. Future revenue is leveraged to issue bonds or other debt that provides funds for capital and project development costs. They are also often supplemented by public sector grants, either through direct funding or in-kind contributions such as donations of right-of-way. In some cases, private partners are required to make equity investments as well.
One example of a DBFO project is California State Road 125, commonly known as the South Bay Expressway. This connects the only commercial port of entry in San Diego to the regional freeway network. The southern section of S.R. 125, stretching about ten miles, was constructed as a privately financed and operated toll road with electronic toll collection. A limited partnership holds a franchise with the State under which it financed and built the highway. When the road was finished in 2007, the State took ownership, but the limited partnership leased the facility back from the State. The limited partnership will operate and maintain the road for five years. After that period, control will revert to the State at no cost.
Build-Own-Operate
The sixth model, Build-Own-Operate (BOO), completely removes the public sector from the transportation project. Under this approach, a private company is granted the right to develop, finance, design, build, own, operate, and maintain a transportation project, owning the project outright and retaining the operating revenue risk and all of the surplus operating revenue. This approach is most common in the power and telecommunications industries.
A major section of the Foley Beach Express was built using BOO principles. This limited access, four-lane route stretches for about 14 miles in southern Alabama. Six miles of the route—including a major bridge over the Intracoastal Waterway—were completely financed, designed, and constructed by a private company. The company operates and maintains the facility today.
Other Public-Private Partnerships
There are some types of PPPs that do not necessarily correspond to the six models outlined above. They demonstrate the variety of ways in which the public and private sectors can meet modern transportation needs.
Construction of a major section of the King Coal Highway involves an innovative partnership between the West Virginia Department of Transportation, a local redevelopment authority, and coal companies. The State is using excess materials generated by the mining process to construct the foundation for the highway. Because regulatory agencies are more likely to allow permits for coal removal if there is a constructive use for excess material, coal companies have benefited from this level of participation. It is estimated that this collaborative process has cut costs by 50 percent for the initial section of the highway.
| How has the U.S. Department of Transportation advanced the use of PPPs? | |
|
In the last few years, the U.S. Department of Transportation has implemented several initiatives to help remove barriers and increase the role of the private sector in highway construction, operation, and maintenance.
One major initiative is Special Experimental Project No. 15 (SEP-15), which identifies regulations that inhibit the creation of PPPs and private investment in transportation improvements and aims to develop new procedures and approaches to address these impediments. SEP-15 addresses, but is not limited to, four major components of project delivery: innovative contracting, compliance with environmental requirements, right-of-way acquisition, and project finance. Nine projects have been preliminarily accepted into this program.
The Department has sponsored numerous workshops to share knowledge between State governments and the private sector. The Department has developed case studies on how States and local governments have overcome institutional barriers to PPP implementation, and published the Manual for Using Public-Private Partnerships on Highway Projects, which is a one-stop resource for States interested in pursuing PPPs.
The Department has published a Web site that contains links to many PPP resources and a checklist of 28 key elements that States can use to implement enabling legislation for PPP projects. This checklist can be found at https://www.fhwa.dot.gov/ppp/legislation.cfm. |
|
Another innovative partnership is the Heartland Corridor initiative, the first time the private freight rail industry has worked with the U.S. Department of Transportation to develop and finance a rail improvement project. Among other improvements, the Heartland Corridor initiative involves raising tunnel clearances and removing overhead obstructions that block the transportation of double-stacked containers. The project includes $44 million from a major private railroad, and its completion is expected to improve freight transportation between the Eastern Seaboard and the Midwest.
The Chicago Region Environmental and Transportation Efficiency Program (CREATE) is a similar collaborative effort. Six of the seven major railroads operating in North America pass through Chicago, and all of them are partners in the CREATE Program. Working with AMTRAK and State and local governments, the private railroads plan to make a $212 million equity contribution towards a $1.5 billion capital improvement program. The project involves grade separation projects and extensive upgrades of tracks, switches, and signal systems.
Credit Assistance
Another innovative finance tool is the use of credit assistance. Federal credit assistance for transportation projects takes various forms, and it can provide an efficient way to utilize scarce Federal budget authority. Secured—or direct—loans and loan guarantees to project sponsors provide the necessary capital to advance a project. Credit enhancement, including standby lines of credit, make Federal funds available on a contingency basis, reducing the risk to investors and allowing project sponsors to borrow at lower interest rates. These projects typically involve partnerships between the public and private sectors.
The following section describes two of the most significant Federal credit assistance initiatives introduced in recent years: the Transportation Infrastructure and Finance Innovation Act (TIFIA) and the State Infrastructure Bank (SIB) programs. Section 129(a) loans are also discussed.
Transportation Infrastructure and Finance Innovation Act
The Transportation Infrastructure Finance and Innovation Act of 1998 (TIFIA) provides Federal credit assistance for major transportation projects of national importance. The TIFIA credit program is designed to fill market gaps and leverage substantial investment by the private sector. There are three distinct types of financial assistance. First, direct Federal loans offer flexible repayment terms and provide combined construction and permanent financing of capital costs. Second, loan guarantees provide full-faith-and-credit guarantees by the Federal government to institutional investors, such as pension funds, which make loans for projects. Third, standby lines of credit may be drawn upon to supplement project revenue, if needed, during the first ten years a project is operating.
The TIFIA program is designed for major projects. Eligible projects must cost at least $50 million or one-third of the State's annual apportionment of Federal-aid funds, whichever is less (for Intelligent Transportation Systems, the minimum cost is $15 million). The borrower must have an associated revenue stream—such as tolls or local sales taxes—that can be used to repay the debt issued for the project. Qualified projects are evaluated by the U.S. Secretary of Transportation based on the extent to which they generate economic benefits, leverage private capital, promote innovative technologies, and meet other program objectives.Exhibit 6-21 describes the 17 projects that have received commitments of TIFIA credit assistance. TIFIA projects include highway toll roads and bridges, transit systems, rail stations, ferry terminals, and intermodal facilities. Together, these projects represent more than $24.4 billion in infrastructure investment in the United States. The 19 credit agreements executed or under negotiation amount to about $6.6 billion in Federal credit assistance. TIFIA assistance has ranged from $42 million for the Warwick Intermodal Station in Rhode Island to about $917 million for the Central Texas Turnpike. No TIFIA borrower has defaulted on a loan repayment, and five borrowers have retired their TIFIA loans either by early repayment or refinancing.
| Project | Location | Project Type | Project Cost (Millions of Dollars) | Type of TIFIA Assistance | Credit Amount (Millions of Dollars) | Revenue Pledge |
|---|---|---|---|---|---|---|
| Active Credit Agreements | ||||||
| Miami Intermodal Center | Florida | Intermodal | $1,350 | Direct Loan | $270 | User Charges |
| Washington Metro | DC, VA, MD | Transit | $2,324 | Guarantee | $600 | Interjurisdictional Funding Agreements |
| Central Texas Turnpike | Texas | Highway | $3,181 | Direct Loan | $916.76 | User Charges |
| South Bay Expressway | California | Highway | $653 | Direct Loan | $140 | User Charges |
| 183 A Toll Road | Texas | Highway | $331 | Direct Loan | $66 | User Charges |
| LA-1 Project | Louisiana | Highway | $247 | Direct Loan | $66 | User Charges |
| Warwick Intermodal Station | Rhode Island | Intermodal | $222 | Direct Loan | $42 | User Charges |
| Pocahontas Parkway/Richmond Airport | Virginia | Highway | $748 | Direct Loan | $150 | User Charges |
| Capital Beltway/I-495 HOT Lanes Project | Virginia | Highway | $1,998 | Direct Loan | $589 | User Charges |
| SH 130 Corridor | Texas | Highway | $1,360 | Direct Loan | $430 | User Charges |
| Intercounty Connector | Maryland | Highway | $2,466 | Direct Loan | $516 | User Charges |
| I-595 Corridor Roadway Improvements | Florida | Highway | $1,834 | Direct Loan | $603 | Availability Payments |
| Subtotal Active | $4,388.76 | |||||
| Commitments Awaiting Credit Agreements | ||||||
| Triangle Expressway Project | North Carolina | Highway | $1,252 | Direct Loan | $413 | User Charges |
| IH 635 Managed Lanes | Texas | Highway | $2,678 | Direct Loan | $800 | User Charges |
| Subtotal Awaiting | $1,213.00 | |||||
| Retired Credit Agreements | ||||||
| Tren Urbano | Puerto Rico | Transit | $2,250 | Direct Loan | $300 | Tax Revenues |
| Cooper River Bridge | South Carolina | Highway | $677 | Direct Loan | $215 | Infrastructure Bank Loan Repayments |
| Staten Island Ferries | New York | Transit | $482 | Direct Loan | $159.23 | Tobacco Settlement Revenues |
| Reno Rail Corridor | Nevada | Intermodal | $280 | Direct Loan | $51 | Room and Sales Tax |
| Miami Intermodal Center FDOT* | Florida | Intermodal | Direct Loan | $269.08 | Tax Revenues | |
| Subtotal Retired | $993.80 | |||||
| Total | $24,333 | $6,595.56 | ||||
State Infrastructure Banks
Another innovative finance tool is the use of State Infrastructure Banks (SIBs). Section 350 of the NHS Designation Act of 1995 authorized the U.S. Department of Transportation to establish the State Infrastructure Bank Pilot Program. This program provides increased financial flexibility for infrastructure projects by offering direct loans and loan guarantees. SIBs are capitalized with Federal and State funds. Some States augment these operating reserves through a variety of methods, including special appropriations and debt issues. Each SIB operates as a revolving fund and can finance a wide variety of surface transportation projects. As loans are repaid, additional funds become available to new loan applicants.
Under the NHS Act, 31 States established SIBs. TEA-21 limited the use of newly authorized funds for SIB capitalization to four States, of which only two actually operated under the TEA-21 provisions; the remaining States participating in the SIB program operated under NHS Act provisions and were not allowed to capitalize SIBs with TEA-21 funds. Additional capitalizing has been done with State funds.
SAFETEA-LU established a new SIB program under which all States and territories are authorized to enter into cooperative agreements with the Department. These agreements allow for the creation of infrastructure revolving funds that could be capitalized with Federal transportation funds from fiscal years 2005 through 2009. Three SIB accounts may be established—highways, transit, and rail. Under SAFETEA-LU, States that established SIBs authorized by TEA-21 and the NHS Act may continue to operate those SIBs.
States participating in the new SIB program established by SAFETEA-LU may capitalize their SIB highway account with up to 10 percent of the funds apportioned to the State for the National Highway System Program, the Surface Transportation Program, the Highway Bridge Program, and the Equity Bonus. Their SIB transit account may be capitalized with up to 10 percent of the funds made available for capital projects under Urbanized Area Formula Grants, Capital Investment Grants, and Formula Grants for Other Than Urbanized Areas for FY 2005 through FY 2009.
Exhibit 6-22 reflects the number of SIBs loans and loan agreements by State. As of June 2007, $6.2 billion in loan agreements had been made by 32 States and Puerto Rico, of which $4.3 billion had been disbursed for 596 loan agreements.
| State | Number of Agreements | Loan Agreement Amount (Thousands of Dollars) | Disbursements to Date (Thousands of Dollars) |
|---|---|---|---|
| Alaska | 1 | $2,737 | $2,737 |
| Arizona | 56 | $612,090 | $515,504 |
| Arkansas | 1 | $31 | $31 |
| California | 2 | $1,120 | $1,120 |
| Colorado | 4 | $4,400 | $1,900 |
| Delaware | 1 | $6,000 | $6,000 |
| Florida | 59 | $989,871 | $228,922 |
| Indiana | 2 | $6,000 | $6,000 |
| Iowa | 2 | $2,879 | $2,879 |
| Maine | 23 | $1,635 | $1,635 |
| Michigan | 44 | $33,635 | $29,307 |
| Minnesota | 17 | $122,476 | $112,295 |
| Missouri | 23 | $149,400 | $106,400 |
| Nebraska | 2 | $6,792 | $6,792 |
| New Mexico | 4 | $25,216 | $17,815 |
| New York | 10 | $27,700 | $27,700 |
| North Carolina | 6 | $1,279 | $1,279 |
| North Dakota | 2 | $3,891 | $3,891 |
| Ohio | 96 | $286,839 | $199,382 |
| Oregon | 20 | $34,773 | $33,577 |
| Pennsylvania | 104 | $61,973 | $50,354 |
| Puerto Rico | 1 | $15,000 | $15,000 |
| Rhode Island | 1 | $1,311 | $1,311 |
| South Carolina | 13 | $3,311,000 | $2,430,000 |
| South Dakota | 3 | $28,776 | $28,776 |
| Tennessee | 1 | $1,875 | $1,875 |
| Texas | 68 | $310,888 | $290,642 |
| Utah | 1 | $2,888 | $2,888 |
| Vermont | 4 | $1,805 | $1,427 |
| Virginia | 1 | $18,000 | $17,989 |
| Washington | 3 | $2,376 | $487 |
| Wisconsin | 7 | $3,051 | $3,051 |
| Wyoming | 14 | $112,332 | $112,332 |
| Total | 596 | $6,190,039 | $4,261,298 |
Section 129 Loans
Prior to 1991, States were only allowed to use Federal-aid highway funds on a "grant" reimbursement basis. Section 129(a) of Title 23 allows States to recycle Federal-aid highway funds by lending them out to pay for projects with dedicated revenue streams, obtaining repayments from project revenue, and then reusing the repaid funds on other highway projects. For example, a State may directly lend apportioned funds-not exceeding more than 80 percent of the project cost-to projects that generate a toll or that have some other dedicated revenue such as excise, sales, property, and motor-vehicle taxes and other beneficiary fees, as long as the project sponsor pledges revenues from a dedicated source for repayment of the loan. These types of loans are attractive to private investors because they can be used to offset up-front capital requirements, such as right-of-way acquisition, physical construction, or engineering costs that might otherwise have to be borrowed at higher interest rates on the open market. Only those costs incurred after a loan is authorized by the FHWA are eligible for reimbursement from loan proceeds; costs incurred prior to the authorization of the loan are not eligible for reimbursement.
Section 129 loans allow States get more value out of annual apportionments. Since Federal funds are initially cycled through a Section 129 loan that must comply with Federal requirements and laws that are attached to Federal-aid highway projects, the funds obtained by the State from loan repayment no longer retain characteristics of Federal funds. Therefore, repaid funds may be used without complying with Federal requirements and laws normally attached to Federal-aid projects, freeing them up for use on any project eligible for funding under Title 23.
Debt Financing
Because of their complexity, cost, and lengthy design and construction periods, transportation projects are often financed by issuance of bonds. Bonds are traditionally repaid over several years by State and local taxes or revenue generated from highway user fees. Recent Federal legislation, however, has introduced new ways that project sponsors can take advantage of debt financing.
Grant Anticipation Revenue Vehicle
Highway and transit project sponsors have increasingly issued debt instruments known as Grant Anticipation Notes (GANs), which are backed by anticipated grant money. Grant Anticipation Revenue Vehicles (GARVEEs) are a particular form of GAN being used for transportation projects. A GARVEE is a debt financing instrument that has a pledge of future Federal-aid for debt service and is authorized for Federal reimbursement of debt service and related financing costs. This generates up-front capital for major highway projects that the State may be unable to build in the near term using traditional pay-as-you-go funding approaches. The GARVEE bond technique enables a State to accelerate construction timelines and spread the cost of a transportation facility over its useful life rather than just the construction period.
The 1995 NHS Act was a significant enabler for GARVEEs, expanding the eligibility of debt financing costs for Federal-aid reimbursements. In addition to traditional debt service, expenses such as underwriting fees, bond insurance, and financial counsel are now eligible for reimbursement.
GARVEEs have helped facilitate PPPs. They expand access to capital markets, supplement general revenue bonds, and provide immediate and reliable sources of funding. This makes large projects possible and allows construction to begin more quickly—all of which attract greater private sector involvement because of GARVEEs' ability to yield immediate influxes of up-front capital. For all these reasons, GARVEEs have become a major element of transportation funding, as shown in Exhibit 6-23. As of December 2007, the amount of GARVEE debt issued nationally had reached over $7.3 billion.
| State | Issues | Total Issuance (Millions of Dollars) | Projects Financed | Insurance |
|---|---|---|---|---|
| Alabama | 1 | $200.0 | County bridge program | Yes |
| Alaska | 1 | $102.8 | Eight road and bridge projects | No |
| Arizona | 5 | $460.4 | Maricopa freeway projects | No |
| Arkansas | 3 | $575.0 | Interstate highways | No |
| California | 1 | $614.9 | Eight road projects | Yes, except 2005 series |
| Colorado1 | 5 | $1,665.6 | Any project financed wholly or in part by Federal funds | No |
| Georgia | 1 | $360.0 | Various transportation projects | Yes |
| Idaho | 1 | $194.3 | Various expansion projects | Yes |
| Kentucky | 2 | $417.5 | Three Interstate widening and rehabilitation projects | Yes |
| Maine | 1 | $48.4 | Replacement of the Waldo-Hancock Bridge | Yes |
| Maryland | 1 | $325.0 | InterCounty Connector | No |
| Montana | 1 | $122.8 | 44 miles of U.S. 93 improvements | Yes |
| New Mexico | 2 | $118.7 | New Mexico SR 44 | Yes |
| North Carolina | 1 | $287.6 | 38 projects around the State | Yes |
| North Dakota | 1 | $51.4 | Highway and bridge projects | Yes |
| Ohio | 8 | $928.1 | Various projects including Spring-Sandusky and Maumee River improvements | No |
| Oklahoma2 | 3 | $192.2 | Projects in 12 corridors | No |
| Puerto Rico | 1 | $139.8 | Various transportation projects | Yes |
| Rhode Island | 2 | $401.4 | Freeway, bridge, and freight rail improvement projects | Yes |
| Virgin Islands | 1 | $20.8 | Enighed Pond Port Project and Red Hook Passenger Terminal Building | Yes |
| West Virginia | 2 | $109.2 | Route 35 enhancements | Yes |
| Total | 44 | $7,335.9 |
2 With premiums on net proceeds worth $50 million.
Private Activity Bonds
SAFETEA-LU amended Section 142 of the Internal Revenue Code to add highway and freight transfer facilities to the types of privately developed and operated projects for which private activity bonds may be issued. This change allows private activity on these types of projects, while maintaining the tax-exempt status of the bonds. SAFETEA-LU limits the total amount of such bonds to $15 billion and directs the Secretary of Transportation to allocate this amount among qualified facilities. Three types of facilities are eligible: (1) any surface transportation project which receives Federal assistance under Title 23 of the United States Code, (2) certain international bridges and tunnels, and (3) certain freight transfer facilities, such as those that move cargo from rail to truck or from truck to rail.
Passage of the private activity bond legislation reflects the Federal government's desire to increase private sector investment in U.S. transportation infrastructure. Providing private developers and operators with access to tax-exempt interest rates lowers the cost of capital significantly, enhancing investment prospects. Increasing the involvement of private investors in highway and freight projects generates new sources of money and ideas and improves efficiency.
As of January 15, 2008, the Department of Transportation had approved $3.3 billion in private activity bond allocations for five projects. These projects are the Port of Miami Tunnel; the Missouri Department of Transportation Safe and Sound Bridge Improvement Program; the Knik Arm Crossing in Alaska; Interstate-495 High-Occupancy Toll Lanes in Virginia; and the Lyndon Baines Johnson Expressway in Texas.
| Can a transportation project utilize more than one innovative finance technique? | |
|
Yes. There are numerous projects that have been constructed or operated under more than one innovative finance technique.
The Pocahontas Parkway, for example, is operated under a long-term PPP-model lease arrangement. Operators of the parkway are taking advantage of credit from the TIFIA program to extend the highway to Richmond International Airport. The parkway is also a participant in Special Experimental Project No. 15.
Alaska's Anton Anderson Memorial Tunnel implemented two PPP models. Improvements to Alaska's Anton Anderson Memorial Tunnel were completed under the Design-Build model, but its operations have been carried out using the private contract-fee service model.
The Central Texas Turnpike between Interstate 35 and U.S. 183 was built under a Design-Build model. About $916 million in credit from the TIFIA program assisted in its construction.
|
|
Innovations in Tolling
Tolling is a central element of many projects developed under innovative finance techniques, but it is also being used to pay for facilities constructed in more traditional ways. SAFETEA-LU included several innovations to expand the use of tolling.
The Interstate System Construction Toll Pilot Program authorizes the U.S. Secretary of Transportation to select up to three projects nationwide where a State may collect tolls on Interstate highways, bridges, or tunnels in order to construct new Interstate highways; for a project to be eligible, tolling must be judged to be the most efficient and economical finance method. In 2007, Federal officials selected the first such project, authorizing the South Carolina Department of Transportation to participate in order to construct a portion of the proposed Interstate 73.
The Express Lane Demonstration Program authorizes the U.S. Secretary of Transportation to select up to 15 projects nationwide where States, public authorities, and public or private entities may permit the automated collection of tolls on existing HOV facilities. The goal of the program is to demonstrate the impact that tolling can have on managing high levels of congestion, reducing emissions, and financing the addition of Interstate lanes. Tolls charged on high occupancy vehicle (HOV) facilities under this program must vary according to time of day or level of traffic; variable pricing on non-HOV facilities is optional.
SAFETEA-LU also continued several existing pilot programs. The Value Pricing Pilot Program, first established in ISTEA as the Congestion Pricing Pilot Program and renamed in TEA-21, examines the potential effects that different value pricing approaches would have on congestion reduction. The Interstate System Reconstruction and Rehabilitation Toll Pilot Program was established under TEA-21 as a construction revenue source. This program, continued through SAFETEA-LU, allows tolling on up to three existing Interstate facilities to fund needed reconstruction or rehabilitation on Interstate highway corridors that could not otherwise be adequately maintained or functionally improved.
Transit Finance
Transit Funding
In 2006, $43.4 billion was available from all sources to finance transit investment and operations, compared with $39.5 billion in 2004. Transit funding comes from two major sources: public funds allocated by Federal, State, and local governments, and system-generated revenues earned for the provision of transit services. Federal funding for transit includes fuel taxes dedicated to transit from the Mass Transit Account (MTA) of the Highway Trust Fund (HTF), as well as undedicated taxes allocated from Federal general fund appropriations; revenue sources are shown in Exhibit 6-24. State and local governments also provide funding for transit from their general fund appropriations, as well as from fuel, income, sales, property, and other unspecified taxes, specific percentages of which may be dedicated to transit. These percentages vary considerably among taxing jurisdictions and by type of tax. Other public funds from sources such as toll revenues and general transportation funds may also be used to fund transit. System-generated revenues are composed principally of passenger fares, although additional revenues are also earned by transit systems from advertising and concessions, park-and-ride lots, investment income, and rental of excess property and equipment.
| (Millions of Dollars) | |||||
|---|---|---|---|---|---|
| Federal | State | Local | Total | Percent | |
| Public Funds | $8,075.5 | $8,570.8 | $14,261.8 | $30,908.1 | 71.3% |
| General Fund | $1,615.1 | $2,358.3 | $3,014.6 | $6,988.0 | 16.1% |
| Fuel Tax | $6,460.4 | $549.5 | $159.8 | $7,169.7 | 16.5% |
| Income Tax | $195.1 | $70.8 | $265.9 | 0.6% | |
| Sales Tax | $2,429.9 | $4,797.6 | $7,227.5 | 16.7% | |
| Property Tax | $0.0 | $547.3 | $547.3 | 1.3% | |
| Other Dedicated Taxes | $1,203.5 | $1,163.6 | $2,367.1 | 5.5% | |
| Other Public Funds | $1,834.5 | $4,508.1 | $6,342.6 | 14.6% | |
| System-Generated Revenue | $12,452.4 | 28.7% | |||
| Passenger Fares | $10,461.1 | 24.1% | |||
| Other Revenue | $1,991.3 | 4.6% | |||
| Total All Sources | $43,360.5 | 100.0% | |||
Level and Composition of Transit Funding
Exhibit 6-25 breaks down the sources of total transit funding. In 2006, public funds of $30.9 billion were available for transit and accounted for 71.3 percent of total transit funding. Of this amount, Federal funding was $8.1 billion, accounting for 26.1 percent of total public funding and for 18.6 percent of all funding from both public and nonpublic sources. State funding was $8.6 billion, accounting for 27.7 percent of total public funds and 19.8 percent of all funding. Local jurisdictions provided the bulk of transit funds, $14.3 billion in 2006, or 46.1 percent of total public funds and 32.9 percent of all funding. System-generated revenues were $12.5 billion, 28.7 percent of all funding.
| What type of dedicated funding does mass transit receive from Federal highway-user fees? | |
|
Prior to FY 1983, all Federal funding for transit was from general revenue sources. In 1983 the Mass Transit Account (MTA) was established within the Highway Trust Fund, funded by 1.0 cent of the Federal motor-fuel tax. In 1990, the portion of the Federal fuel tax dedicated to the MTA was increased to 1.5 cents, in 1995 to 2.0 cents, in 1997 to 2.85 cents, and in 1998 to 2.86 cents (retroactive to October 1, 1997) with the passage of the Transportation Equity Act for the 21st Century. Since 1997, 2.86 cents of Federal highway-user fees on gasohol, diesel and kerosene fuel, and other special fuels, including benzol, benzene, and naphtha, have also been dedicated to the MTA. Also since 1997, the total Federal fuel tax for a gallon of gasoline has been 18.4 cents and the total tax for a gallon of diesel has been 24.4 cents.
The MTA has also received 2.13 cents of the user fee on liquefied petroleum gas (LPG) and 1.86 cents of the user fee on liquefied natural gas (LNG) since 1997. The MTA does not receive any of the nonfuel revenues (such as heavy vehicle use taxes) that accrue to the Highway Trust Fund.
Since the passage of the Safe, Accountable, Flexible and Efficient Transportation Equity Act: A Legacy for Users (SAFETEA-LU) only the Formula and Bus Grants Program is funded from the MTA. Prior to SAFETEA-LU, MTA funded other FTA programs.
|
|
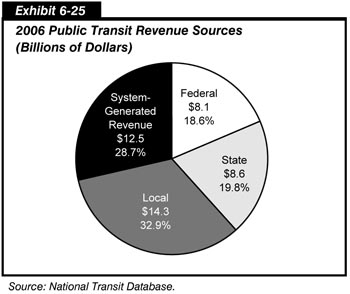
Federal Funding
Federal funding for transit comes from two sources: the general revenues of the U.S. government and revenues generated from fuel taxes credited to the HTF's MTA. The MTA, a trust fund for capital projects in transit, is the largest source of Federal funding for transit. Eighty-two percent of the transit funds authorized for transit by the Safe, Accountable, Flexible, Efficient Transportation Equity Act: A Legacy for Users (SAFETEA-LU) ($37.2 billion) will be derived from the MTA. Funding from the MTA in nominal dollars increased from $0.5 billion in 1983 to $6.5 billion in 2006.
Since 1973, Federal surface transportation authorization statutes have contained flexible funding provisions that enable transfers from certain highway funds to transit programs and vice versa. In 1973, Congress began to allow local areas to exchange interstate highway trust funds for transit funding from general revenues; this allows Federal-aid highway dollars to be used for transit grant purposes, with a higher local share. Flexible funding was implemented under the Intermodal Surface Transportation Efficiency Act of 1991 (ISTEA) and continued by the Transportation Equity Act for the 21st Century (TEA-21). Transfers are subject to State and regional/local discretion, and priorities are established through Statewide transportation planning processes. All States and territories within the United States participate in the flexible funding program, except Kansas, North Dakota, South Dakota, and Wyoming. The amount of flexible funding transferred from highways to transit fluctuates from year to year and is drawn from several different sources.
| What makes up general revenue sources? | |
|
General revenue sources, or the general fund, comprise all appropriation, expenditure, and receipt transactions, except for those that are required to be accounted for in a separate fund, generally by statute. General revenue sources include income taxes, corporate taxes, tariffs, fees and other government income not committed by statute to a particular purpose.
|
|
| Does the Federal Transit Administration have any security-specific grant programs? | |
|
The Federal Transit Administration (FTA) does not have a security-specific grant program. However, Section 5307 grantees are required to either spend at least one percent of their Section 5307 formula funds on transit security or certify that they do not need to do so.
Section 5307 (d)(1)(J) specifically states that grantees will expend at least one percent of the funds received in a fiscal year for increased lighting in or adjacent to a public transportation system; increased camera surveillance of an area in or adjacent to that system; to provide an emergency telephone line to contact law enforcement or security personnel in an area in or adjacent to that system; or any other project intended to increase the security and safety of an existing or planned public transportation system.
Section 5307 grantees in urbanized zone areas (UZAs) with a population of less than 200,000 may use both capital and operating security-related expenses to meet or exceed the "1% for security" requirement. Section 5307 grantees in UZAs with a population greater than 200,000 can only use security-related capital projects to meet the 1% for security requirement. SAFETEA-LU expanded the definition of allowable security-related capital projects to include security planning, training and drills and exercises.
FTA tracks annual Section 5307 expenditures for security through its Triennial Review oversight program.
|
|
The Surface Transportation Program (STP) is the largest source of funds from the FHWA. Funding is at 80 percent Federal share and may be used for all projects eligible for funds under current FTA programs excluding operating assistance.
Congestion Mitigation and Air Quality (CMAQ) Improvement Program funds are used to support transportation projects in air quality nonattainment areas. A CMAQ project must contribute to the attainment of the national ambient air quality standards by reducing air pollutant emissions from transportation sources.
Several transit projects are also earmarked under TEA-21 and SAFETEA-LU as high-priority projects. FHWA asked that they be administered by FTA. FHWA earmarked funds through FY 1999 were transferred to FTA's formula programs only.
The Department of Homeland Security (DHS) also provides funding for projects aimed at improving transit security. In 2005, DHS provided $134.1 million to increase transit security across the Nation. In 2006, DHS increased the funds available for transit security, providing transit service providers with a total of $136.0 million.
In FY 2006, $1.8 billion in flexible funds/transfers were available to FTA for obligation. Of that total, $1.3 billion (68.0 percent) was transferred in FY 2006; the remaining available $430.5 million (32.0 percent) was the un-obligated carryover or recovery of prior year transfers. Thirty-eight states transferred flexible funds during FY 2006. Obligations in FY 2006 totaled $1.3 billion. Once transferred, these funds take on the characteristics of the program in which they are received and are included in the figures reported across various programs. Obligations in FY 2006 were: Urbanized Area Formula: $1.2 billion (91.9 percent); Capital: $18.0 million (1.4 percent); Elderly and Persons with Disabilities: $62.8 million (4.9 percent); and Non-urbanized Area Formula: $23.0 million (1.8 percent). Since the program's initiation in FY 1992, a total of $13.1 billion has been transferred from highways to transit, with obligations of approximately $12.6 billion.
No flexible funds may be transferred directly to the Section 5309 Program; however, flexible funds that have been transferred to the 5307 Program may be used with Section 5309 funds to finance capital investment projects.
State and Local Funding
General funds and other dedicated public funds are important sources of funding for transit at both the State and local levels; State and local transit funding sources are shown in Exhibits 6-26 and 6-27. In 2006, 27.5 percent of State funds and 21.0 percent of local funds came from general revenues. Allocations from other public funds accounted for 21.4 percent of total State and 32.1 percent of total local funding for transit. Dedicated sales taxes are a major source of funding for transit at both the State and local level. In 2006, they accounted for 28.4 percent of total State and 33.4 percent of total local funding for transit. Dedicated income and property taxes provide more modest levels of funding at both the State and local levels. Dedicated income taxes are a more important source of transit funds at the State level, whereas dedicated property taxes are more important at the local level.
| What are other public funds? | |
|
Other public funds are those funds that are not dedicated to transit at their source or are not included in the budgeting process of general revenue funds. These funds include vehicle licensing and registration fees, communications access fees, surcharges and taxes, lottery and casino, and the proceeds from property and asset sales. |
|
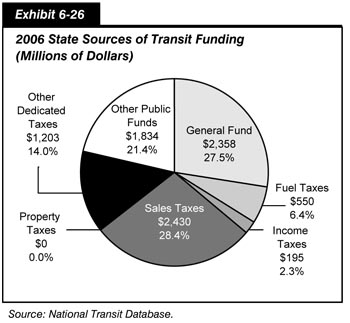
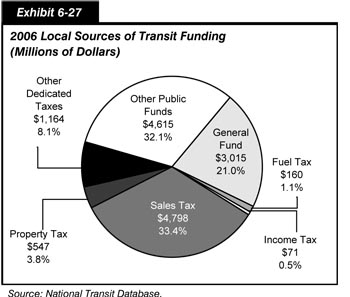
Level and Composition of System-Generated Funds
In 2006, system-generated funds were $12.5 billion and provided 28.7 percent of total transit funding. Passenger fares contributed $10.5 billion, accounting for 84.0 percent of system-generated funds and 24.1 percent of total transit funds. These passenger fare figures do not include payments by State entities to transit systems that offset reduced transit fares for certain segments of the population, such as students and the elderly. These payments are included in the other revenue category.
Trends in Public Funding
Prior to 1962, there was no Federal funding for transit. State and local funding was limited, equal to approximately 15.0 percent of current total funding in 2006 real terms. Public funding for transit grew rapidly in the 1970s, and Federal funding increased at an average annual rate of 38.9 percent and State and local funding increased at an average annual rate of 11.9 percent. Federal funding grew much more slowly during the 1980s, increasing at an average annual rate of 0.4 percent, while funding at the State and local levels continued to grow steadily at an average annual rate of 7.8 percent. During the 1990s, Federal funding for transit grew more rapidly than in the 1980s, increasing at an average annual rate of 4.3 percent. However, State and local government funding grew more slowly than in the preceding decade, increasing at an average annual rate of 4.8 percent. Public funding for transit increased even more rapidly between 2000 and 2006 than in the 1980s and 1990s, growing at an average annual rate of 6.7 percent; Federal funding increased at an average annual rate of 7.4 percent, and State and local funding grew at an average annual rate of 6.4 percent. The average annual increase in Federal funding between 2004 and 2006 was 7.8 percent and the average annual increase in State and local funding over this period was 3.2 percent. These data are presented in Exhibit 6-28.
| Year | (Millions of Current Dollars) | Federal Share | ||
|---|---|---|---|---|
| Federal | State and Local | Total | ||
| 1960 | $0.0 | $683.0 | $683.0 | 0.0% |
| 1970 | $124.0 | $1,499.0 | $1,623.0 | 7.6% |
| 1980 | $3,307.0 | $4,617.0 | $7,924.0 | 41.7% |
| 1990 | $3,458.0 | $9,823.0 | $13,281.0 | 26.0% |
| 1991 | $3,395.0 | $11,116.0 | $14,511.0 | 23.4% |
| 1992 | $3,448.0 | $11,195.0 | $14,643.0 | 23.5% |
| 1993 | $3,296.5 | $11,990.7 | $15,287.2 | 21.6% |
| 1994 | $3,379.6 | $12,522.4 | $15,902.0 | 21.3% |
| 1995 | $4,081.5 | $12,971.0 | $17,052.5 | 23.9% |
| 1996 | $4,059.9 | $12,642.7 | $16,702.6 | 24.3% |
| 1997 | $4,742.0 | $12,727.7 | $17,469.7 | 27.1% |
| 1998 | $4,420.8 | $13,199.5 | $17,620.3 | 25.1% |
| 1999 | $4,586.2 | $15,166.1 | $19,752.3 | 23.2% |
| 2000 | $5,259.3 | $15,739.4 | $20,998.7 | 25.0% |
| 2001 | $6,585.7 | $17,630.8 | $24,216.5 | 27.2% |
| 2002 | $6,296.0 | $20,294.0 | $26,590.0 | 23.7% |
| 2003 | $6,688.1 | $21,107.4 | $27,795.5 | 24.1% |
| 2004 | $6,954.4 | $21,451.6 | $28,406.0 | 24.5% |
| 2005 | $6,854.9 | $22,214.6 | $29,069.5 | 23.6% |
| 2006 | $8,075.5 | $22,832.6 | $30,908.1 | 26.1% |
Federal funding for transit, as a percentage of total public funding for transit from Federal, State, and local sources combined, reached a peak of 42.9 percent in the early 1980s, as shown in Exhibit 6-29. However, by 1990, the Federal government share had fallen to 26.0 percent because the growth in State and local funding for transit greatly exceeded the growth of Federal funding during the 1980s. Since 1990, the Federal government has provided between 27.0 and 21.0 percent of total public funding for transit; in 2006, it provided 26.1 percent of these funds.
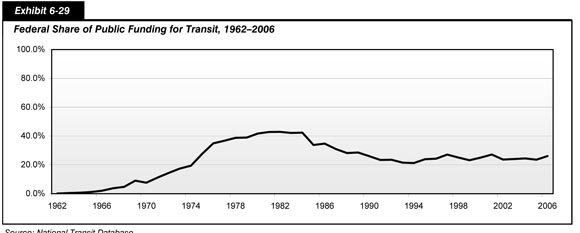
Funding in Current and Constant Dollars
Total public funding for transit in current dollars reached its highest level of $30.9 billion in 2006, compared with $28.4 billion in 2004. Federal funding in current dollars was 16.1 percent higher in 2006 than in 2004, increasing from $7.0 billion in 2004 to $8.1 billion in 2006; and State and local funding in current dollars was 5.6 percent higher, increasing from $21.5 billion in 2004 to $22.8 billion in 2006. Total public funding for transit in constant dollars increased by an annual average rate of change of 0.7 percent from 2004 to 2006; funding in constant dollars from Federal sources increased by 8.8 percent over this period (updated per the Consumer Price Index). Funding from State and local sources decreased by 1.1 percent. These data are presented in summary in Exhibit 6-30.
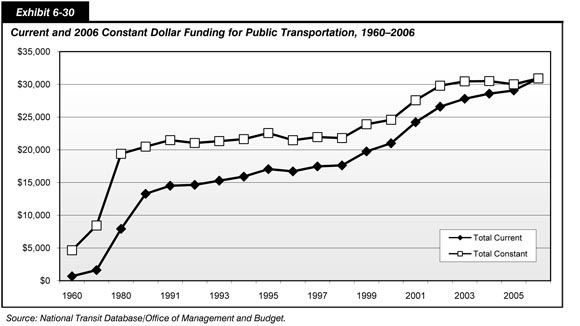
Capital Funding and Expenditures
Funding for capital investments by transit operators in the United States comes primarily from public sources. Capital investment funds for transit are also generated through innovative finance programs.
Capital investments include the design and construction of new transit systems, extensions of existing systems ("New Starts"), and the modernization of existing fixed assets. Fixed assets include fixed guideway systems (e.g., rail tracks), terminals, and stations, as well as maintenance and administrative facilities. Capital investment expenditures also include the acquisition, renovation, and repair of rolling stock (i.e., buses, railcars, locomotives, and service vehicles).
In 2006, total public transit agency expenditures for capital investment were $12.8 billion in current dollars and accounted for 29.4 percent of total available funds, a slight decline from total public transit agency expenditures in 2004, which allocated 32.0 percent of expenditures for capital investment. Federal funds were $5.6 billion in 2006 (43.5 percent of total transit agency capital expenditures), State funds were $1.7 billion (13.3 percent of total transit agency capital expenditures), and local funds were $5.5 billion (43.1 percent of total transit agency capital expenditures).
While the share of these funding sources shifted slightly in 2006, as shown in Exhibit 6-31, Federal funds increased to 43.5 percent after declining between 2002 and 2005, with the lowest point at 39.0 percent in 2004.
| (Millions of Dollars) | Average Annual Growth | |||||||||||
|---|---|---|---|---|---|---|---|---|---|---|---|---|
| 1997 | 1998 | 1999 | 2000 | 2001 | 2002 | 2003 | 2004 | 2005 | 2006 | 2006/ 1997 | 2006/ 2004 | |
| Federal | $4,137.5 | $3,679.5 | $3,725.9 | $4,274.9 | $5,468.4 | $4,993.7 | $5,091.8 | $4,930.2 | $4,611.8 | $5,552.2 | 3.3% | 6.1% |
| Share | 54.2% | 49.7% | 44.1% | 47.2% | 50.5% | 40.6% | 39.9% | 39.0% | 39.2% | 43.5% | ||
| State | $1,006.7 | $875.3 | $857.5 | $973.3 | $1,011.1 | $1,432.9 | $1,622.7 | $1,756.1 | $1,494.2 | $1,698.2 | 6.0% | -1.7% |
| Share | 13.2% | 11.8% | 10.2% | 10.7% | 9.3% | 11.6% | 12.7% | 13.9% | 12.7% | 13.3% | ||
| Local | $2,492.0 | $2,855.7 | $3,859.9 | $3,807.7 | $4,345.1 | $5,874.3 | $6,060.5 | $5,942.7 | $5,653.6 | $5,501.7 | 9.2% | -3.8% |
| Share | 32.6% | 38.5% | 45.7% | 42.0% | 40.1% | 47.8% | 47.4% | 47.1% | 48.1% | 43.1% | ||
| Total | $7,636.2 | $7,410.5 | $8,443.3 | $9,055.9 | $10,824.6 | $12,300.9 | $12,775.0 | $12,629.1 | $11,759.6 | $12,752.1 | 5.9% | 0.5% |
As shown in Exhibit 6-32, rail modes require a higher percentage of total capital investment than bus modes because of the higher cost of building fixed guideways and rail stations. In 2006, $9.2 billion, or 72.3 percent of total transit capital expenditures, was invested in rail modes of transportation, compared with $3.5 billion, or 27.7 percent of the total, which was invested in nonrail modes. This investment distribution was consistent with 2002 and 2004 distributions.
| (Millions of Dollars) | |||||||||||
|---|---|---|---|---|---|---|---|---|---|---|---|
| Mode | Guideway | Rolling Stock | Systems | Maintenance Facilities | Stations | Fare Revenue Collection Equipment | Adminis- trative Buildings | Other Vehicles | Other Capital Expendi- tures1 | Total | Percent of Total |
| Rail | $4,170.5 | $1,420.3 | $581.2 | $806.1 | $1,738.0 | $135.0 | $47.9 | $48.0 | $274.4 | $9,221.4 | 72.3% |
| Commuter Rail | $1,042.9 | $712.3 | $64.1 | $188.4 | $343.3 | $5.1 | $4.3 | $7.6 | $111.2 | $2,479.2 | 19.4% |
| Heavy Rail | $1,095.1 | $419.3 | $444.4 | $373.1 | $1,083.5 | $109.5 | $15.0 | $37.7 | $114.8 | $3,692.4 | 29.0% |
| Light Rail | $2,026.1 | $250.7 | $71.3 | $243.8 | $308.5 | $20.3 | $28.6 | $2.6 | $47.6 | $2,999.6 | 23.5% |
| Other Rail 2 | $6.4 | $37.9 | $1.4 | $0.8 | $2.6 | $0.1 | $0.0 | $0.1 | $0.8 | $50.2 | 0.4% |
| Nonrail | $328.9 | $1,677.4 | $214.4 | $481.2 | $455.2 | $72.8 | $113.5 | $23.7 | $163.6 | $3,530.7 | 27.7% |
| Motor Bus | $318.0 | $1,484.1 | $198.2 | $447.7 | $375.0 | $71.3 | $105.7 | $22.3 | $144.8 | $3,167.0 | 24.8% |
| Demand Response | $0.0 | $105.8 | $13.7 | $17.1 | $1.5 | $0.9 | $7.5 | $0.8 | $6.1 | $153.5 | 1.2% |
| Ferryboat | $0.0 | $50.0 | $1.4 | $10.9 | $62.7 | $0.0 | $0.0 | $0.0 | $11.1 | $136.2 | 1.1% |
| Trolley Bus | $10.9 | $9.3 | $0.8 | $5.4 | $15.3 | $0.6 | $0.1 | $0.4 | $0.9 | $43.8 | 0.3% |
| Other Nonrail 3 | $0.0 | $28.2 | $0.3 | $0.0 | $0.7 | $0.0 | $0.1 | $0.2 | $0.6 | $30.2 | 0.2% |
| Total | $4,499.4 | $3,097.7 | $795.6 | $1,287.4 | $2,193.2 | $207.8 | $161.4 | $71.7 | $438.0 | $12,752.1 | 100% |
| Percent of Total | 35.3% | 24.3% | 6.2% | 10.1% | 17.2% | 1.6% | 1.3% | 0.6% | 3.4% | 100.0% | |
2 Automated rail, Alaska rail, cable car, inclined plane, monorail.
3 Jitney, Público, and vanpool.
Exhibit 6-32 shows the capital investment expenditures by asset type in 2006. Fluctuations in the levels of capital investment in different types of transit assets reflect normal rehabilitation and replacement cycles, as well as new investment. Capital investment expenditures have only been reported to the NTD at the level of detail in Exhibit 6-32 since 2002.
Guideway investment was $4.5 billion in 2006; investment in systems in 2006 was $795.6 million. Guideway includes at-grade rail, elevated and subway structures, tunnels, bridges, track and power systems for all rail modes, and paved highway lanes dedicated to buses. Investment in systems by transit operators includes groups of devices or objects forming a network, especially for distributing something or serving a common purpose (e.g., telephone systems).
Investment in rolling stock in 2006 was $3.1 billion, investment in stations was $2.2 billion, and investment in maintenance facilities was $1.3 billion. Rolling stock includes the bodies and chassis of transit vehicles and their attached fixtures and appliances, but does not include fare collection equipment and revenue vehicle movement control equipment such as radios. Stations include station buildings, platforms, shelters, parking and other forms of access, and crime prevention and security equipment at stations. Facilities include the purchase, construction, and rehabilitation of administrative and all types of maintenance facilities. Facilities also include investment in building structures, climate control, parking, yard track, vehicle and facilities maintenance equipment, furniture, office equipment, and computer systems. (Note that facilities include guideway and rail systems reported separately in Chapters 3 and 7.) In 2006, $438.0 million was invested in other capital.
Other vehicles and revenue collection equipment, which were included in other capital in 2002, were reported separately in 2004 and 2006. Other capital, as defined in 2004, includes the construction of general administration facilities, furniture, equipment that is not an integral part of buildings and structures, data processing equipment (including computers and peripheral devices whose sole use is in data processing operations), revenue vehicle movement control equipment, and shelters located at on-street bus stops.
| What are "New Starts"? | |
|
Projects involving the construction of new fixed guideway systems are known as "New Starts." Title 49 USC Section 5309 provides for the allocation of funds for the design and construction of new transit systems and extensions to current systems ("New Starts") among other purposes. To receive FTA capital investment funds for a New Starts project, the proposed project must emerge from the metropolitan and/or Statewide planning process. A rigorous series of planning and project development requirements must be completed in order to qualify for this funding. Local officials are required to analyze the benefits, costs, and other impacts of alternative transportation strategies before deciding upon a locally preferred alternative. FTA evaluates proposed projects on the basis of financial criteria and project justification criteria as prescribed by statute. Initial planning efforts are not funded through the Section 5309 program, but may be funded through Section 5303 Metropolitan Planning, Section 5339 Alternatives Analysis, or Section 5307 Urbanized Area Formula Grants programs.
Under current law, Federal funding may account for up to 80 percent of a New Starts funding requirement. Generally, the Federal share of such projects now averages about 50 percent of the total project cost. SAFETEA-LU authorized $7.4 billion in Federal funding for New Starts from 2005 through 2009; TEA-21 authorized $6.1 billion in Federal funding for New Starts from 1998 to 2003. Authorization for New Starts from 2004 to 2006 has increased from $1.3 billion in 2004, to $1.44 billion in 2005, and $1.5 billion in 2006.
|
|
Operating Expenditures
Transit operating expenditures include wages, salaries, fuel, spare parts, preventive maintenance, support services, and leases used in providing transit service. In 2006, $30.6 billion was available for operating expenses and accounted for 70.6 percent of total available funds. Of this amount, $2.5 billion was provided by the Federal government (8.2 percent of total transit agency operating expenditures), $6.9 billion was provided by State governments (22.5 percent of total transit agency operating expenditures), $8.9 billion by local governments (29.0 percent of total transit agency operating expenditures), and $12.3 billion by system-generated revenues (40.3 percent of total transit agency operating expenditures). These data are given in Exhibit 6-33. The Federal share of operating expenditures was higher in 2006, at 8.2 percent, than in any other year during the 1997 to 2006 period, up from a 7.5 percent share in 2004; the State share of operating expenditures of 22.5 percent in 2006 was consistent with 2004 expenditures. The share of operating expenditures provided by local governments and system-generated revenues decreased slightly from 29.4 percent to 29.0 percent from 2004 to 2006.
| (Millions of Dollars) | Average Annual Growth | |||||||||||
|---|---|---|---|---|---|---|---|---|---|---|---|---|
| 1997 | 1998 | 1999 | 2000 | 2001 | 2002 | 2003 | 2004 | 2005 | 2006 | 2006/ 1997 | 2006/ 2004 | |
| Federal | $604.5 | $741.3 | $860.3 | $984.4 | $1,117.3 | $1,302.2 | $1,596.1 | $2,024.2 | $2,243.1 | $2,524.2 | 17.2% | 11.7% |
| Share | 3.3% | 4.0% | 3.9% | 4.5% | 4.8% | 5.4% | 6.3% | 7.5% | 7.8% | 8.2% | ||
| State | $3,661.4 | $3,819.1 | $3,819.1 | $4,351.3 | $5,127.3 | $6,112.7 | $6,042.8 | $6,036.1 | $6,703.0 | $6,874.7 | 7.3% | 6.7% |
| Share | 20.0% | 20.5% | 17.4% | 20.1% | 21.8% | 25.3% | 23.8% | 22.5% | 23.3% | 22.5% | ||
| Local | $5,567.7 | $5,649.4 | $6,097.4 | $6,513.2 | $7,147.3 | $6,873.8 | $7,381.5 | $7,887.0 | $8,363.8 | $8,867.2 | 5.3% | 6.0% |
| Share | 30.4% | 30.3% | 27.8% | 30.0% | 30.4% | 28.4% | 29.1% | 29.4% | 29.1% | 29.0% | ||
| System-Generated Revenues | $8,476.6 | $8,437.6 | $11,128.2 | $9,831.6 | $10,111.5 | $9,890.2 | $10,355.3 | $10,922.3 | $11,451.1 | $12,345.8 | 4.3% | 6.3% |
| Share | 46.3% | 45.2% | 50.8% | 45.3% | 43.0% | 40.9% | 40.8% | 40.6% | 39.8% | 40.3% | ||
| Total | $18,310.2 | $18,647.4 | $21,904.9 | $21,680.5 | $23,503.4 | $24,178.9 | $25,375.7 | $26,869.6 | $28,761.0 | $30,612.5 | 5.9% | 13.9% |
TEA-21 mandated that Federal funding to transit systems in urbanized areas with populations over 200,000 be used only for capital expenses and operating expenses for preventive maintenance, and not for other types of operating expenses. Formula grant funds to urbanized areas with populations of less than 200,000 were still allowed to be used for operating expenses. As a result of the 2000 census, 56 areas were reclassified as urbanized areas with populations of more than 200,000. (These reclassifications were announced by the Census Department in May 2002.) Transit agencies operating in these areas were slated to lose their eligibility to use Federal formula funding to finance transit operations starting in FY 2003. The Transit Operating Flexibility Act of 2002 amended Section 5307 of 49 USC to allow transit systems that were in these areas to continue to use their formula funds for operating expenses as well as for capital expenses in FY 2003, despite their change in status. This change was extended by the Surface Transportation Extension Act of 2003. Under SAFETEA-LU these transit agencies may continue to use formula funds for operating expenses in FY 2005 at 100 percent of their FY 2002 apportionment, in FY 2006 at 50 percent of their FY 2002 apportionment, and in FY 2007 at 25 percent of their FY 2002 apportionment.
Operating Expenditures by Transit Mode
As shown in Exhibit 6-34, transit operators' actual operating expenditures were $29.0 billion in 2006, compared with $25.4 billion in 2004. These expenditures increased at an average annual rate of 5.8 percent between 1997 and 2006. Light rail systems and demand response experienced the largest percentage increase in operating expenditures among the modes shown during the 1997 to 2006 period, rising at an average annual rate of 9.5 percent. This is due to investment in new light rail and demand response capacity increasing at a higher rate over the past ten years in comparison to the other modes. Operating expenditures for heavy rail increased at a lesser rate than light rail and demand response between 1997 and 2006 at an average annual rate of 4.8 percent. In contrast, the operating expenditures for commuter rail increased at an average annual rate of 5.7 percent over the 1997 to 2006 period. Operating expenditures for buses increased at an average annual rate of 5.5 percent between 1997 and 2006. Operating expenditures for the remaining modes combined as "Other" increased at an average annual rate of 6.8 percent between 1997 and 2006.
| (Millions of Dollars) | |||||||||||
|---|---|---|---|---|---|---|---|---|---|---|---|
| Year | Motor Bus | Heavy Rail | Commuter Rail | Light Rail | Demand Response | Other | Total | ||||
| 1997 | $9,776.8 | $3,473.7 | $2,278.0 | $471.4 | $1,009.0 | $453.5 | $17,462.4 | ||||
| 1998 | $10,119.9 | $3,529.6 | $2,360.0 | $493.0 | $1,134.2 | $498.5 | $18,135.2 | ||||
| 1999 | $10,840.6 | $3,693.4 | $2,574.3 | $536.2 | $1,274.7 | $540.3 | $19,459.6 | ||||
| 2000 | $11,026.4 | $3,930.8 | $2,679.0 | $592.1 | $1,225.4 | $549.3 | $20,003.1 | ||||
| 2001 | $11,814.0 | $4,180.1 | $2,853.7 | $676.5 | $1,409.9 | $594.7 | $21,528.8 | ||||
| 2002 | $12,585.7 | $4,267.5 | $2,994.7 | $778.3 | $1,635.7 | $643.4 | $22,905.1 | ||||
| 2003 | $13,315.8 | $4,446.2 | $3,172.7 | $753.7 | $1,778.7 | $718.0 | $24,185.2 | ||||
| 2004 | $13,789.5 | $4,734.2 | $3,436.4 | $826.1 | $1,902.0 | $738.6 | $25,426.8 | ||||
| 2005 | $14,665.8 | $5,144.8 | $3,657.1 | $978.1 | $2,071.2 | $720.8 | $27,237.8 | ||||
| 2006 | $15,796.5 | $5,287.5 | $3,764.9 | $1,070.1 | $2,285.9 | $819.7 | $29,024.6 | ||||
| Percent of Total | |||||||||||
| 1997 | 56.0% | 19.9% | 13.0% | 2.7% | 5.8% | 2.6% | 100.0% | ||||
| 2006 | 54.4% | 18.2% | 13.0% | 3.7% | 7.9% | 2.8% | 100.0% | ||||
| Average Annual Growth Rate | |||||||||||
| 2006/1997 | 5.5% | 4.8% | 5.7% | 9.5% | 9.5% | 6.8% | 5.8% | ||||
Buses accounted for the largest percentage of transit operating expenditures, with 54.4 percent of the operating expenditure total, at $15.8 billion, in 2006. Operating expenditures for heavy rail in 2006 were $5.3 billion, or 18.2 percent of the total; operating expenditures for commuter rail were $3.8 billion, or 13.0 percent of the total; and operating expenditures for demand response systems were $2.3 billion, or 7.9 percent of the total. Operating expenditures for light rail were $1.1 billion, and operating expenditures for the remaining modes were $0.8 billion, accounting for 3.7 percent and 2.8 percent of the total, respectively. These data are shown in Exhibit 6-34.
Operating Expenditures by Type of Cost
In 2006, $15.6 billion, or 53.7 percent of total transit operating expenditures, were for vehicle operations. Expenditures on vehicle maintenance were $5.7 billion, or 19.8 percent of the total; expenditures on nonvehicle maintenance were $3.0 billion, or 10.4 percent of the total; and expenditures on general administration were $4.7 billion, or 16.2 percent of the total. The distribution of these expenses across cost categories for 2006 is virtually the same as in 2004. These data are shown in Exhibit 6-35.
| (Millions of Dollars) | ||||||||||
|---|---|---|---|---|---|---|---|---|---|---|
| Mode | Vehicle Operations | Vehicle Maintenance | Nonvehicle Maintenance | General Administration | Total | |||||
| Motor Bus | $9,277.5 | 59.6% | $3,284.5 | 57.3% | $717.2 | 23.8% | $2,517.2 | 53.5% | $15,796.5 | 54.4% |
| Heavy Rail | $2,313.1 | 14.8% | $929.7 | 16.2% | $1,358.3 | 45.1% | $686.4 | 14.6% | $5,287.5 | 18.2% |
| Commuter Rail | $1,542.0 | 9.9% | $883.7 | 15.4% | $640.4 | 21.3% | $698.8 | 14.9% | $3,764.9 | 13.0% |
| Light Rail | $453.8 | 2.9% | $244.2 | 4.3% | $184.9 | 6.1% | $187.2 | 4.0% | $1,070.1 | 3.7% |
| Demand Response | $1,522.1 | 9.8% | $267.4 | 4.7% | $44.5 | 1.5% | $451.9 | 9.6% | $2,285.9 | 7.9% |
| Other | $469.5 | 3.0% | $123.6 | 2.2% | $63.4 | 2.1% | $163.2 | 3.5% | $819.7 | 2.8% |
| Total | $15,578.0 | 100.0% | $5,733.1 | 100.0% | $3,008.8 | 100.0% | $4,704.6 | 100.0% | $29,024.6 | 100.0% |
| Percent of All Modes | 53.7% | 19.8% | 10.4% | 16.2% | 100.0% | |||||
Bus and rail operations have inherently different cost structures. Although 66.6 percent of total operations expenditures for demand response transit (e.g., demand response operating expenses of $1.5 million as a percentage of demand response total operating expenses of $2.3 million) and 58.7 percent of total operations expenditures for buses were spent for actual operation of the vehicles, only 42.6 percent of rail operations expenditures were spent on the operation of rail vehicles. A significantly higher percentage of expenditures for rail modes of transportation is classified as nonvehicle maintenance for the repair and maintenance of fixed guideway systems.
Operating Expenditures per Vehicle Revenue Mile
Operating expenditures per vehicle revenue mile (VRM) is one measure of financial or cost efficiency. It shows the expense of operating a transit vehicle in revenue service. As shown in Exhibit 6-36, in 2006, operating expenditures per VRM for all transit modes combined was $7.31. The average annual increase in operating expenditures per VRM for all modes combined was 2.0 percent between 1997 and 2006.
| Year | Motor Bus | Heavy Rail | Commuter Rail | Light Rail | Demand Response | Other * | Total |
|---|---|---|---|---|---|---|---|
| 1997 | $6.09 | $6.44 | $9.92 | $11.84 | $2.88 | $5.13 | $6.12 |
| 1998 | $6.12 | $6.43 | $9.91 | $11.65 | $2.92 | $5.00 | $6.11 |
| 1999 | $6.31 | $6.58 | $10.58 | $11.37 | $3.05 | $4.42 | $6.25 |
| 2000 | $6.25 | $6.80 | $10.81 | $11.51 | $2.71 | $5.05 | $6.25 |
| 2001 | $6.49 | $7.07 | $11.28 | $12.72 | $2.88 | $5.41 | $6.49 |
| 2002 | $6.75 | $7.07 | $11.56 | $12.98 | $3.11 | $5.59 | $6.68 |
| 2003 | $7.08 | $7.27 | $12.11 | $12.25 | $3.27 | $6.37 | $6.96 |
| 2004 | $7.32 | $7.58 | $12.79 | $12.40 | $3.39 | $5.21 | $7.17 |
| 2005 | $7.78 | $8.20 | $13.20 | $14.40 | $3.50 | $4.66 | $7.56 |
| 2006 | $8.27 | $8.34 | $13.12 | $14.66 | $3.77 | $5.13 | $7.31 |
| Average (1997–2006) | $6.85 | $7.18 | $11.53 | $12.58 | $3.15 | $5.20 | $6.69 |
| Average Annual Rate of Change | |||||||
| 2006/1997 | 3.5% | 2.9% | 3.2% | 2.4% | 3.0% | 0.0% | 2.0% |
Operating expenditures per capacity-equivalent VRM is a better measure of comparing cost efficiency among modes than operating expenditures per VRM because it adjusts for passenger-carrying capacities. As demonstrated by the data in Exhibit 6-37, rail systems are more cost efficient in providing service than nonrail systems, once investment in rail infrastructure has been completed. Based on operating costs alone, heavy rail is the most efficient at providing transit service, and demand response systems are the least efficient. (Note that annual changes in operating expense per capacity-equivalent VRM and unadjusted motor bus operating expenditures are consistent between Exhibits 6-36 and 6-37 because they provide the basis for capacity-equivalent factors. Annual changes in operating expense per capacity-equivalent VRM and unadjusted VRM are not the same for the remaining modes because VRMs in each year have been adjusted by the vehicle carrying capacity in that year.)
| Year | Motor Bus | Heavy Rail | Commuter Rail | Light Rail | Demand Response | Other * | Total |
|---|---|---|---|---|---|---|---|
| 1997 | $6.09 | $2.94 | $4.36 | $5.14 | $18.04 | $7.26 | $4.96 |
| 1998 | $6.12 | $2.93 | $4.23 | $4.98 | $17.80 | $7.61 | $4.98 |
| 1999 | $6.31 | $2.92 | $5.72 | $4.54 | $21.85 | $7.43 | $5.28 |
| 2000 | $6.25 | $2.94 | $5.29 | $4.55 | $16.60 | $7.71 | $5.15 |
| 2001 | $6.49 | $3.03 | $4.65 | $5.01 | $16.21 | $8.53 | $5.24 |
| 2002 | $6.75 | $2.91 | $4.59 | $5.20 | $16.31 | $8.43 | $5.31 |
| 2003 | $7.08 | $2.94 | $4.78 | $4.44 | $17.27 | $9.57 | $5.49 |
| 2004 | $7.32 | $3.06 | $5.02 | $4.61 | $18.79 | $9.10 | $5.68 |
| 2005 | $7.78 | $3.27 | $5.28 | $5.32 | $17.56 | $8.66 | $6.01 |
| 2006 | $8.27 | $3.34 | $5.25 | $5.43 | $18.83 | $9.91 | $6.29 |
| Average (1997–2006) | $6.85 | $3.03 | $4.92 | $4.92 | $17.93 | $8.42 | $5.44 |
| Average Annual Rate of Change | |||||||
| 2006/1997 | 3.5% | 1.4% | 2.1% | 0.6% | 0.5% | 3.5% | 2.7% |
Operating Expenditures per Passenger Mile
Operating expenditures per passenger mile is an indicator of the cost effectiveness of providing a transit service. It shows the relationship between service inputs as expressed by operating expenses and service consumption as expressed by passenger miles traveled. Operating expenditures per passenger mile for all transit modes combined increased at an average annual rate of 3.4 percent between 1997 and 2006 (from $0.43 to $0.59. Operating expenditures per passenger mile for buses increased at an average annual rate of 3.7 percent between 1997 and 2006. Operating expenditures per passenger mile for commuter rail increased at an average annual rate of 2.8 percent over this period. Operating expenditures per passenger mile for demand response systems, heavy rail, and light rail increased over the 1997 to 2006 period at average annual rates of 5.3 percent, 2.5 percent, and 2.5 percent, respectively. These data are shown in Exhibit 6-38.
| Year | Motor Bus | Heavy Rail | Commuter Rail | Light Rail | Demand Response | Other * | Total |
|---|---|---|---|---|---|---|---|
| 1997 | $0.56 | $0.29 | $0.28 | $0.46 | $1.90 | $0.44 | $0.43 |
| 1998 | $0.57 | $0.29 | $0.27 | $0.44 | $2.21 | $0.45 | $0.44 |
| 1999 | $0.58 | $0.29 | $0.29 | $0.45 | $2.28 | $0.46 | $0.45 |
| 2000 | $0.59 | $0.28 | $0.29 | $0.44 | $2.09 | $0.49 | $0.44 |
| 2001 | $0.60 | $0.29 | $0.30 | $0.47 | $2.25 | $0.52 | $0.46 |
| 2002 | $0.64 | $0.31 | $0.32 | $0.54 | $2.51 | $0.55 | $0.50 |
| 2003 | $0.69 | $0.33 | $0.33 | $0.55 | $2.58 | $0.56 | $0.53 |
| 2004 | $0.73 | $0.33 | $0.35 | $0.56 | $2.70 | $0.53 | $0.55 |
| 2005 | $0.76 | $0.36 | $0.39 | $0.58 | $2.80 | $0.52 | $0.58 |
| 2006 | $0.77 | $0.36 | $0.36 | $0.57 | $3.03 | $0.58 | $0.59 |
| Average (1997-2006) | $0.65 | $0.31 | $0.32 | $0.51 | $2.44 | $0.51 | $0.50 |
| Average Annual Rate of Change | |||||||
| 2006/1997 | 3.7% | 2.5% | 2.8% | 2.5% | 5.3% | 3.0% | 3.4% |
Farebox Recovery Ratios
The farebox recovery ratio represents farebox revenues as a percentage of total transit operating costs. It measures users' contributions to the variable cost of providing transit services and is influenced by the number of riders, fare structure, and rider profile. Low regular fares, the high availability and use of discounted fares, and high transfer rates tend to result in lower farebox recovery ratios. Farebox recovery ratios for 2004 to 2006 are provided in Exhibit 6-39. The average farebox recovery ratio over this period for all transit modes combined was 36.1 percent; heavy rail had the highest average farebox recovery ratio (59.7 percent), followed by commuter rail (48.0 percent), bus (29.4 percent), light rail (27.1 percent), and demand response (10.0 percent). The farebox recovery ratios for the remaining "Other" modes averaged 33.7 percent. Farebox recovery ratios for total costs are not provided because capital investment costs are not spread evenly across years. Rail modes have farebox recovery ratios for total costs that are significantly lower than for operating costs alone because of these modes' high level of capital costs.
| Year | Motor Bus | Heavy Rail | Commuter Rail | Light Rail | Demand Response | Other * | Total |
|---|---|---|---|---|---|---|---|
| 2002 | 27.9% | 58.4% | 48.3% | 29.0% | 11.3% | 29.8% | 34.9% |
| 2003 | 26.5% | 59.7% | 48.9% | 28.1% | 9.1% | 31.8% | 34.6% |
| 2004 | 26.7% | 61.3% | 47.0% | 26.2% | 9.4% | 36.0% | 34.9% |
| 2005 | 28.0% | 58.0% | 47.0% | 25.0% | 10.0% | 35.0% | 35.0% |
| 2006 | 38.0% | 61.0% | 49.0% | 27.0% | 10.0% | 36.0% | 41.0% |
| Average (2002–2006) | 29.4% | 59.7% | 48.0% | 27.1% | 10.0% | 33.7% | 36.1% |
Rural Transit
Since 1978, the Federal Government has contributed to the financing of transit in rural areas (i.e., areas with populations of less than 50,000). These rural areas are estimated to account for approximately 36 percent of the U.S. population and 38 percent of the transit-dependent population.
Funding for rural transit is currently provided through 49 USC Section 5311, which, in 1994, replaced Section 18 of the Urban Mass Transit Act. Rural transit funding was increased substantially with passage of TEA-21. Federal funding for rural transit was $224 million in FY 2002 and $240 million in FY 2003, the end of the TEA-21 authorization period. States may transfer additional funds to rural transit from highway projects, transit projects, or formula transit funds for small, urbanized areas.
As shown in Exhibit 6-40, 28.5 percent of rural transit authorities' operating budgets come from Federal Assistance funds. State and local governments cover 46.7 percent of their rural transit operating budgets through a combination of dedicated State and local taxes, appropriations from State general revenues, and allocations from other city and county funds. Contract revenue, defined as reimbursements from a private entity (profit or non-profit) for the provision of transit service, accounts for 17.1 percent of rural transit operating budgets. In 2006, total State and local contributions to rural transit operating budgets increased to a total of $496.9 million, up from $431 million in 2000 and $145 million in 1994.
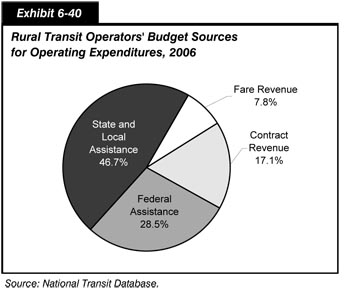
Comparison
Exhibit 6-41 compares the key highway and transit statistics discussed in this chapter with the values shown in the last version of the C&P report. The first data column contains the values reported in the 2006 C&P Report, which were based on 2004 data. Where the 2004 data have been revised, updated values are shown in the second column. The third column contains comparable values based on 2006 data.
| Statistic | 2004 Data | 2006 Data | |
|---|---|---|---|
| 2006 C&P Report | Revised | ||
| Total Funding for Highways (all governments) | $145.3 billion | $166.0 billion | |
| Total Funding for Transit | $39.5 billion | $43.4 billion | |
| Total Public Funding for Transit | $28.4 billion | $30.9 billion | |
| Percent of Public Funding for Transit Funded by Federal Government | 24.3% | 24.5% | 26.0% |
| Total Highway-User Revenues (motor-fuel and vehicle taxes and tolls) | $106.8 billion | $105.8 billion | $117.1 billion |
| Highway-User Revenues Used for Roads | $83.0 billion | $93.4 billion | |
| Total Transit Fares and Other System-Generated Revenue | $9.1 billion | $11.1 billion | $12.5 billion |
| Total Highway Expenditures (all govts.) | $147.5 billion | $161.1 billion | |
| Percent of Total Highway Expenditures Funded by Federal Government | 22.6% | 22.4% | |
| Total Highway Capital Outlay (all govts.) | $70.3 billion | $78.7 billion | |
| Percent of Total Highway Capital Outlay Funded by Federal Government | 43.8% | 44.0% | |
| Percent of Total Highway Capital Outlay Used for System Rehabilitation | 51.8% | 51.7% | 51.3% |
| Total Transit Capital Outlay | $12.6 billion | $12.8 billion | |
| Percent of Total Transit Capital Outlay Funded by Federal Government | 39.0% | 43.5% | |
| Percent of Total Transit Capital Outlay Used for Rail | 70% | 72.3% | |
Highways and Bridges
All levels of government generated $166.0 billion in 2006 to be used for highways and bridges. Of this amount, $5.0 billion was placed in reserves, so cash outlays for highways and bridges in 2006 totaled about $161.1 billion, a 14.2-percent increase compared to 2004. The percentage of total highway funding provided by the Federal government dipped slightly from 22.6 to 22.4 percent, which means that State and local agencies provided a greater share of overall highway investment. This estimate includes funding not only for capital outlay, but also noncapital expenditures.
Highway user fees generated $117.1 billion in 2006, a 10.7 percent increase since 2004. About $93.4 billion of this revenue was used for roads and bridges.
In terms of capital outlay only, investment at all levels of government grew by 11.0 percent between 2004 and 2006, from $70.3 billion to $78.7 billion. The Federal share remained relatively constant, growing from 43.8 percent to 44.0 percent.
Inflation has greatly reduced the relative purchasing power of transportation dollars. Between 1997 and 2006, highway capital outlay expenditures declined by 4.0 percent in constant dollar terms, reflecting the increased cost of materials. Much of this increase is due to the rapid growth of Asian economies such as China and India, which have consumed higher levels of petroleum, steel, and other materials.
The portion of overall capital outlay used for rehabilitation in 2004 was re-estimated from the 51.8-percent figure cited in the 2006 C&P Report to 51.7 percent. This revision reflects data corrections, as well as the adoption of new procedures for estimating the distribution of capital expenditure types on roads functionally classified as rural local or urban local. In 2006, the share of capital investment used for system rehabilitation fell to 51.3 percent.
Transit
In 2006, $43.4 billion was available from all sources to finance transit investment and operations compared with $39.5 billion in 2004. Transit funding comes from two major sources: public funds allocated by Federal, State, and local governments; and system-generated revenues earned for the provision of transit services. In 2006 Federal funding was $8.1 billion (18.6 percent of total transit funds), State funding was $8.6 billion (19.8 percent of total transit funds), local funding was $14.3 billion (32.9 percent of total transit funds), and system-generated revenues were $12.5 billion (28.7 percent of total transit funds). Between 2004 and 2006, total Federal funding increased by 16.1 percent, total State and local funding increased by 5.6 percent, and total system-generated revenues increased by 12.6 percent.
While funding for transit increased from 2004 to 2006, it is important to note that the real value of money declined over that period, causing a loss of purchasing power among the Nation's transit agencies. In fact public funding for transit, measured in 2006 constant dollars, increased by 1.3% between 2004 and 2006.
Funding for capital investments by transit operators in the United States comes principally from public sources. Capital investments include the design and construction of new transit systems and extensions to current systems (also know as "New Starts") and the modernization of existing fixed assets. In 2006, total public transit agency expenditures for capital investment were $12.8 billion in current dollars (compared with $12.6 billion in current dollars in 2004) and accounted for 30 percent of total available funds. Federal funds were $5.6 billion (compared with $4.9 billion in 2004), State funds were $1.7 billion (compared with $1.8 billion in 2004), and local funds were $5.5 billion (compared with $5.9 billion in 2004). The share of capital funds from Federal sources rose from 39.0 percent in 2004 to 43.5 percent in 2006.
Transit operating expenditures include wages, salaries, fuel, spare parts, preventive maintenance, support services, and leases used in providing transit service. In 2006, $30.6 billion was available for operating expenses (compared with $26.9 billion in 2004) and accounted for 70 percent of total available funds. Of this amount, $2.5 billion was provided by the Federal government (compared with $2.0 billion in 2004), $6.9 billion was provided by State governments (compared with $6.0 billion in 2004), $8.9 billion by local governments (compared with $7.9 billion in 2004), and $12.3 billion by system-generated revenues (compared with $10.9 billion in 2004). In 2006, transit operators' actual operating expenditures were $29.0 billion compared with $25.4 billion in 2004, a total increase of 14.1 percent.
The Federal share of funds for operating expenses increased from 7.5 percent in 2004 to 8.2 percent in 2006. Transit agencies in 56 urbanized areas that were slated to lose their eligibility to use Federal formula funding to finance transit operations starting in FY 2002 (as a result of being reclassified as urbanized areas with populations over 200,000) were allowed to continue as a result of the Transit Operating Flexibility Act passed in September 2002. Under the Safe, Accountable, Flexible, Efficient Transportation Equity Act: A Legacy for Users, these transit agencies may continue to use formula funds for operating expenses in FY 2005 at 100 percent of their FY 2002 apportionment, in FY 2006 at 50 percent of their FY 2002 apportionment, and in FY 2007 at 25 percent of their FY 2002 apportionment.