

- Introduction
- The Economic Approach to Transportation Investment Analysis
- Background
- Economic Focus vs. Engineering Focus
- Financing Mechanisms and Investment Analysis
- Congestion Pricing
- Fixed Rate User Financing and Non-User Financing
- Multimodal Analysis
- Uncertainty in Transportation Investment Modeling
- Capital Investment Scenarios
- Transit Investment Scenarios
- Comparisons Between Report Editions
- Chapter 7: Potential Impacts of Capital Investment
- Chapter 8: Selected Capital Investment Scenarios
- Chapter 9: Scenario Implications
- Chapter 10: Sensitivity Analysis
Introduction
Chapters 7 through 10 present and analyze future capital investment scenario estimates for highways, bridges, and transit. These chapters provide general investment benchmarks as a basis for the development and evaluation of transportation policy and program options. The 20-year investment scenario estimates shown in these chapters reflect the total capital investment from all sources that is projected to be required to achieve certain levels of performance. They do not directly address specific public or private revenue sources that might be used to finance the investment under each scenario, nor do they identify how much might be contributed by each level of government.
These four investment-related chapters include the following analyses:
Chapter 7, Potential Capital Investment Impacts, analyzes the projected impacts of different future levels of investment on measures of physical condition, operational performance, and other benefits to system users. These levels are based on alternative annual rates of increase or decrease in constant dollar investment over 20 years. The chapter also includes analyses of alternative highway funding mechanisms and their potential impacts on the performance of both highways and transit systems.
Chapter 8, Selected Capital Investment Scenarios, draws upon the information presented in Chapter 7, providing additional details on the mix of investment suggested by the models for different funding levels, and comparing this mix to the current distribution of capital spending by type of improvement (especially rehabilitation and expansion). Some of these scenarios are oriented around maintaining different aspects of system condition and performance, while others link to broader measures of system user benefits. The scenarios included in this chapter are intended to be illustrative and do not represent comprehensive alternative transportation policies; the Department does not endorse any of these scenarios as a target level of investment.
Chapter 9, Scenario Implications, provides supplemental analyses and discussion aimed at putting the scenarios presented in Chapter 8 into their proper context. It includes comparisons of historic capital funding levels to recent condition and performance trends, and of historic system use patterns to the State and MPO forecasts of future system use that underlie the scenarios. The chapter also discusses other implications of the material presented in Chapters 7 and 8.
Chapter 10, Sensitivity Analysis, explores the impact that changing some of the key assumptions underlying the analyses presented in Chapters 7 and 8 would have on the projected impacts of alternative levels of capital investment. The investment scenario projections in this report are developed using models that evaluate current system condition and operational performance and make 20-year projections based on certain assumptions about the life spans of system elements, future travel growth, and other model parameters. The accuracy of these projections depends, in large part, on the underlying assumptions used in the analysis. The uncertainty inherent in the estimates is further discussed below.
Unlike Chapters 1 through 6, which largely include highway and transit statistics drawn from other sources, the investment scenario projections presented in these chapters (and the models used to create the projections) were developed exclusively for the C&P report. The procedures for developing the investment scenario estimates have evolved over time to incorporate new research, new data sources, and improved estimation techniques relying on economic principles. The methodologies used to analyze investment for highways, bridges, and transit are discussed in greater detail in Appendices A, B, and C.
The combination of engineering and economic analysis in this part of the report is consistent with the movement of transportation agencies toward asset management, value engineering, and greater consideration of cost effectiveness in decision making. The economic approach to transportation investment is discussed in greater detail below.
The Economic Approach to Transportation Investment Analysis
Background
The methods and assumptions used to analyze future highway, bridge, and transit investment scenarios are continuously evolving. Since the beginning of the highway report series in 1968, innovations in analytical methods, new empirical evidence, and changes in transportation planning objectives have combined to encourage the development and application of improved data and analytical techniques. Estimates of future highway investment requirements, as reported in the 1968 National Highway Needs Report to Congress, began as a combined "wish list" of State highway "needs." As the focus of national highway investment changed from system expansion to management of the existing system during the 1970s, national engineering standards were defined and applied to identify system deficiencies, and the investments necessary to remedy these deficiencies were estimated. By the end of the decade, a comprehensive database, the Highway Performance Monitoring System (HPMS), had been developed to monitor highway system conditions and performance nationwide.
By the early 1980s, a sophisticated simulation model, the HPMS Analytical Process (HPMS-AP), was available to evaluate the impact of alternative investment strategies on system conditions and performance. The procedures used in the HPMS-AP were founded on engineering principles. Engineering standards were applied to determine which system attributes were considered deficient, and improvement option packages were developed using standard engineering practices to potentially correct given deficiencies, but without consideration of comparative economic benefits and costs.
In 1988, the Federal Highway Administration embarked on a long-term research and development effort to produce an alternative simulation procedure combining engineering principles with economic analysis, culminating with the development of the Highway Economic Requirements System (HERS). The HERS model was first utilized to develop one of the two highway investment scenarios presented in the 1995 C&P Report. In subsequent reports, HERS has been used to develop all of the highway investment scenarios.
Executive Order 12893, Principles for Federal Infrastructure Investments, issued on January 26, 1994, directs that Federal infrastructure investments be selected on the basis of a systematic analysis of expected benefits and costs. This order provided additional momentum for the shift toward developing analytical tools that incorporate economic analysis into the evaluation of investment requirements.
In the 1997 C&P Report, the Federal Transit Administration introduced the Transit Economic Requirements Model (TERM), which was used to develop both of the transit investment scenarios. TERM incorporates benefit-cost analysis into its determination of transit investment levels.
The 2002 C&P Report introduced the National Bridge Investment Analysis System (NBIAS), incorporating economic analysis into bridge investment modeling for the first time.
Economic Focus vs. Engineering Focus
The economic approach to transportation investment relies fundamentally upon an analysis and comparison of the economic benefits and costs of potential investments. By providing benefits whose economic value exceeds their costs, projects that offer "net benefits" have the potential to increase societal welfare and are thus considered to be "good" investments from a public perspective. The cost of an investment in transportation infrastructure is simply the straightforward cost of implementing an improvement project.
The benefits of transportation capital investments are generally characterized as the attendant reductions in costs faced by transportation agencies (such as for maintenance), users of the transportation system (such as savings in travel time and vehicle operating costs), and others who are affected by the operation of the transportation system (such as reductions in health or property damage costs).
Traditional engineering-based analytical tools focus mainly on estimating transportation agency costs and the value of resources required to maintain or improve the condition and performance of infrastructure. This type of analytical approach can provide valuable information about the cost effectiveness of transportation system investments from the public agency perspective, including the optimal pattern of investment to minimize life-cycle costs. However, this approach does not fully consider the potential benefits to users of transportation services from maintaining or improving the condition and performance of transportation infrastructure.
By incorporating the value of services that transportation infrastructure provides to its users, the HERS, TERM, and NBIAS models each have a broader focus than traditional engineering-based models. They also attempt to take into account some of the impacts that transportation activity has on non-users and recognize how investments in transportation infrastructure can alter the economic costs of these impacts. By expanding the scope of benefits considered in their analysis, these models are able to yield an improved understanding of existing and future investment needs for the Nation's surface transportation system.
Using this economics-based approach to analyze potential transportation investment is likely to result in different decisions about the catalog of desirable improvements than would be made using a purely engineering-based approach. For example, if a highway segment, bridge, or transit system is greatly underutilized, benefit-cost analysis might suggest that it would not be worthwhile to fully preserve its condition or to address its engineering deficiencies. Conversely, a model based on economic analysis might recommend additional investments to expand capacity or improve travel conditions above and beyond the levels dictated by an analysis that simply minimized engineering life-cycle costs, if doing so would provide substantial benefits to the users of the system.
The economics-based approach also provides a more sophisticated method for prioritizing potential improvement options when funding is constrained. By identifying investment opportunities according to the net benefits they offer, economic analysis helps to provide guidance in directing limited transportation capital investment resources toward the types of system improvements that can together provide the largest benefits to transportation system users. Such an approach, which is applied in HERS, is illustrated in Exhibit II-1. Projects are ranked in order by their benefit-cost ratios, and are then successively implemented until the funding constraint is reached. Projects that would produce lesser net benefits would be deferred for reconsideration in the future.
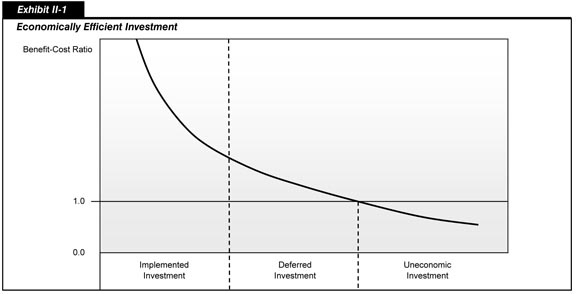
One implication of prioritizing potential projects in this manner is that the marginal and average benefit-cost ratios associated with a program of improvements will decline as the overall level of investment rises. As the relative returns on potential highway, bridge, and transit investments decline, it becomes more likely that competing potential public or private sector investments will yield more net benefits to society.
Theoretically, if the level of available funding were great enough, it would be possible to implement all cost-beneficial projects. Projects that do not meet this threshold of economic viability (because they do not offer positive net benefits and thus cannot increase total net benefits provided by transportation system infrastructure) should not be selected or implemented, even if sufficient funding were available.
Financing Mechanisms and Investment Analysis
As discussed in Chapter 6, highway user revenues (including fuel taxes, motor-vehicle fees, and tolls) are one of the primary sources of funding for highway-related expenditures in the United States. This is particularly true for expenditures funded by the Federal government, which are predominantly drawn from user charges and are devoted primarily to capital outlay, but it is also a significant factor for State and local government expenditures. Private sector investment in highways is also dependent on revenue streams (primarily tolls) from users of the privately financed facilities. By raising the out-of-pocket costs of highway travel to users, highway user charges tend to reduce the demand for use of the system, and thereby reduce the amount of investment that would be required to achieve a given level of condition and performance, or to exhaust all cost-beneficial investments. While user charges levied on a fixed rate per-mile or per-gallon basis have an impact on traveler behavior, variable rate user charges with rates tied to the time of day or real-time congestion levels have the potential to have much larger impacts on peak-period travel.
The HERS model has been adapted to support analyses of the link between broad types of alternative financing mechanisms and projected future investment/performance relationships. The analyses presented in Chapter 7 of this report assume that any increases in highway and bridge capital investment above 2006 levels would be funded from non-user sources, user charges imposed on a fixed rate per-mile basis (such as a vehicle mile travelled [VMT] charge), or user charges imposed on variable rate basis (such as congestion pricing). Any excess revenues stemming from decreases in highway and bridge investment below 2006 levels were assumed to be rebated to users in the form of reductions to existing fixed rate user charges. For each of the selected highway capital investment scenarios described in Chapter 8, two versions are presented, one assuming fixed rate user financing and the other assuming variable rate user financing.
Recent editions of this report have used changes in average highway user costs as a proxy for changes in the underlying physical conditions and operational performance of highway systems. In this context, highway-user costs would not include existing or potential future fixed rate or variable rate user charges, as such charges have nothing to do with the actual state of the highway system.
The sources of funding for transit-related expenditures have traditionally been more diverse that those for highways because passenger fares, fuel taxes, sales taxes, and other public funding mechanisms all play a significant role in financing transit. Consequently, the linkages between financing mechanisms and future investment/performance relationships discussed above for highways are less critical from the transit perspective, and are not directly modeled in the transit investment analyses presented in this report. The analyses of potential bridge investment relationships also do not directly consider such linkages.
Congestion Pricing
When highway users make decisions about whether, when, and where to travel, they consider both the implicit costs (such as travel time and safety risk) and explicit, out-of-pocket costs (such as fuel costs and tolls) of the trip. Under normal operating conditions, their use of the road will not have an appreciable effect on the costs faced by other users. As traffic volumes begin to approach the carrying capacity of the road, however, traffic congestion and delays begin to set in and travel times for all users begin to rise, with each additional vehicle making the situation progressively worse. However, individual travelers do not take into account the delays and additional costs that their use of the facility imposes on other travelers, focusing instead only on the costs that they bear themselves. Economists refer to this divergence between the costs an individual user bears and the total added costs each additional user imposes as a congestion externality. Ignoring this externality is likely to result in an inefficiently high level of use of congested facilities, resulting in a loss of some of their potential benefits to users.
To maximize net societal benefits, users of congested facilities would be levied charges precisely corresponding to the economic cost of the delay they impose on one another, thereby "internalizing" the congestion externality, spreading peak traffic volumes more efficiently (but not necessarily eliminating all congestion delay), and increasing net benefits to users. In such a case, the economically efficient level of investment in highways would depend on the cost of building, preserving, and operating highways; valuations of travel time, vehicle operating costs, and safety; and interest rates. The price signals that such an arrangement would produce would also help guide the location of future investment in capacity expansion toward those areas where it would produce the greatest benefits.
The HERS model has been adapted to provide quantitative estimates of the impact that more efficient pricing could have on the future highway investment/performance relationships. These analytical procedures assume congestion pricing would be implemented universally on all congested roads, with variable rates set for individual facilities based on the marginal cost that each user of the facility imposes on all others during the peak travel period. While these charges would be applied for the principal purpose of congestion mitigation, they would be expected to generate significant amounts of revenue. The analyses in this report assume that such revenues would be available to support any additional investment assumed for a particular highway investment scenario, and would be supplemented by additional fixed rate user charges if necessary. To the extent that the revenues from variable rate user charges would exceed the amount needed to support a given highway investment scenario, the excess revenues were assumed to be rebated to users in the form of reductions to existing fixed rate user charges. It should be noted, however, that the actual disposition of such revenues would be at the discretion of the entity that imposes the charges, and that such revenues could instead be used to support additional investment in transit systems to accommodate travelers that might opt to change transportation modes in response to the adoption of congestion pricing, or for a variety of other transportation or nontransportation purposes.
For this report, the TERM model was utilized to predict the impact that the widespread adoption of highway congestion pricing might be expected to have on transit systems. These analyses assumed that a portion of the peak-period highway travel reductions predicted by HERS would translate into higher transit passenger growth, which would in turn affect projected future investment/performance relationships for transit systems. Chapter 8 includes some transit capital investment scenarios assuming higher passenger growth rates that are linked to specific highway congestion pricing scenarios.
While most transit routes have excess capacity (measured either in terms of passengers per vehicle or vehicles per route mile), some heavily used lines in major metropolitan areas do approach their passenger-carrying capacities during peak travel hours, with commensurate deterioration in the quality of service. As with highways, some of this overcrowding relates to the underpricing of transit service during rush hours. These overcrowded transit lines are often in corridors with heavily congested highway service, making a joint solution to the pricing problems on both highways and transit not only more important to impose, but also more complicated to analyze, devise, and implement.
The analyses of congestion pricing presented in this report focus mainly on their potential impacts on future investment/performance relationships, particularly in regards to the amount of combined public and private investment that might be needed to achieve particular outcomes in terms of future system performance. This report does not address social equity issues associated with congestion pricing, or the mechanics of how economically optimal rates would be computed or assessed on a real time basis. Some of these concerns could be addressed by directing a portion of the revenues generated by congestion pricing to compensate groups of individuals that would be negatively impacted, or to invest in technological improvements to improve the efficiency and operation of the tolling system. Significant advances in tolling technology have been made in recent years that have reduced both the operating costs of toll collection and the delays experienced by users from stopping or slowing down at collection points. Other advances have made it possible to charge different toll rates during different time periods, in some cases varying the price dynamically with real-time traffic conditions. While some of these technologies require extensive roadway infrastructure (and would thus likely be deployed only on high-volume, limited access roads), other in-vehicle technologies utilizing global positioning system devices are being developed that could make it possible to assess fees on virtually any roadway.
The HERS methodology for estimating the impacts of congestion pricing is presented in greater detail in Appendix A. The current approach has some technical limitations, and does not fully address the network effects associated with drivers diverting to other roads. Consequently, this report does not include any analyses of the potential impacts of partial implementation of congestion pricing on selected facilities. The baseline analyses of the impacts of variable rate user financing mechanisms presented in Chapters 7 and 8 assume the immediate universal implementation of efficient pricing. While this is not technically feasible, it would be consistent with an investment philosophy that if one believes that congestion pricing will ultimately be adopted on a widespread basis, then one's shorter term investment decisions should be made with that in mind, to avoid overbuilding today. Chapter 9 includes an analysis of the implications of delaying the implementation of pricing for 10 years. New analytical procedures are currently being developed for use in HERS that will improve its ability to analyze alternative congestion pricing strategies; these research efforts are discussed in the "Pricing Effects" section in Part IV of this report.
Fixed Rate User Financing and Non-User Financing
The highway investment analyses presented in Chapter 7 and 8 based on fixed rate user financing effectively assume a future in which variable-rate user charges will not be widely adopted. In the absence of efficient pricing, options for reducing congestion externalities and increasing societal benefits are limited. One possibility would be to invest in additional roadway capacity beyond the level that would be optimal under efficient pricing, thereby reducing congestion generally and the attendant costs that highway users impose on one another. This is sometimes referred to as a "second-best" solution to the problem of optimal highway investment. One implication of this is that the maximum efficient level of investment in highway capacity would likely be larger under the current system of highway user charges (primarily fees such as fuel taxes that do not vary with congestion levels) than would be the case with efficient, marginal cost pricing of highway use.
While the HERS model is equipped to analyze the impacts of imposing fixed rate user charges to cover any specified percentage of any assumed increase in highway investment levels, the analyses presented in this report consider only two alternatives. The non-user funding alternative assumes that 0 percent of increased investment would come from highway users, while the fixed user funding options assumes that 100 percent of increased investment would come from user charges imposed on a per-VMT basis. This approach differs from that used in the 2006 C&P Report, which assumed charges on a per-gallon basis, but is considered more appropriate for long term analysis, given current trends towards alternative fueled vehicles.
As noted above, TERM does not specifically model the linkage between future investment levels and financing mechanisms, which implicitly assumes non-user financing of future improvements, except to the extent that an increase in passenger miles travelled would translate into additional farebox revenues.
Multimodal Analysis
The HERS, TERM, and NBIAS all use a consistent approach for determining the value of travel time and the value of reducing transportation injuries and fatalities, which are key variables in any economic analysis of transportation investment. While HERS, TERM, and NBIAS all utilize benefit-cost analysis, their methods for implementing this analysis are very different. The highway, transit, and bridge models each rely on separate databases, making use of the specific data available for each mode of the transportation system and addressing issues unique to that mode.
These three models have not yet evolved to the point where direct multimodal analysis would be possible. For example, HERS assumes that, when lanes are added to a highway, this causes highway user costs to fall, resulting in additional highway travel. Some of the increased use of the expanded facility would result from newly generated travel, while some would be the result of travel shifting from transit to highways. However, HERS is unable to distinguish between these different sources of additional highway travel. At present, there is no direct way to analyze the impact that a given level of highway investment in a particular location would have on the transit investment in that vicinity (or vice versa). Opportunities for future development of HERS, TERM, and NBIAS, including efforts to allow feedback between the models, are discussed in Part IV.
This report does include some indirect multimodal analysis on a systemwide basis. As noted above, TERM was used to analyze the potential impacts of the diversion of highway travelers to transit alternatives in conjunction with the adoption of widespread highway congestion pricing.
Uncertainty in Transportation Investment Modeling
The three investment analysis models used in this report are deterministic rather than probabilistic, meaning that they provide a single projected value of total investment for a given scenario rather than a range of likely values. As a result, it is only possible to make general statements about the limitations of these projections, based on the characteristics of the process used to develop them, rather than giving specific information about confidence intervals.
As in any modeling process, simplifying assumptions have been made to make analysis practical and to meet the limitations of available data. While potential highway improvements are evaluated based on benefit-cost analysis, not all external costs (such as noise pollution) or external benefits (such as the net favorable impacts of highway improvements on productivity and competition in the economy) that may be considered in the actual selection process for individual projects are reflected in the investment models. Across a broad program of investment projects, such external effects may fully or partially cancel each other out, but to the extent that they do not, the "true" level of investment required to achieve a particular goal may be either higher or lower than those predicted by the model. Some projects that HERS, TERM, or NBIAS view as economically justifiable may not be after more careful scrutiny, while other projects that the models would reject might actually be justifiable if these other factors were considered.
While it is not possible to present precise confidence ranges for the estimates found in this report, it is possible to examine the sensitivity of the estimates to changes in some of the key parameters underlying the models. Such an analysis is presented in Chapter 10.
Capital Investment Scenarios
The 20-year capital investment scenario projections shown in this report reflect complex technical analyses that attempt to predict the impact that capital investment may have on the future conditions and performance of the transportation system. These scenarios are intended to be illustrative, and the U.S. Department of Transportation does not endorse any of them as a target level of investment. Where practical, supplemental information has been included to describe the impacts of other possible investment levels.
This report does not attempt to address issues of cost responsibility. The investment scenarios predict the impact that particular levels of combined Federal, State, local, and private investment might have on the overall conditions and performance of highways, bridges, and transit. While Chapter 6 provides information on what portion of highway investment has come from different revenue sources in the past, the report does not make specific recommendations about how much could or should be contributed by each level of government or the private sector in the future.
All of the capital investment scenarios are stated in constant 2006 dollars, and cover the period from 2007 through 2026.
Highway and Bridge Investment Scenarios
Future investments in highways and bridges are analyzed independently by separate models and techniques for a variety of alternative funding levels in Chapter 7, and the results are combined for the selected investment scenarios in Chapter 8. The NBIAS considers investments related to bridge repair, rehabilitation, and replacement. Investments for capacity expansion and the highway resurfacing and reconstruction component of system rehabilitation are modeled by HERS. While this model was primarily designed to analyze highway segments, HERS also factors in the costs of expanding bridges and other structures when deciding whether to add lanes to a highway segment. The costs reported for the investment scenarios also include adjustments made using external procedures, allowing elements of system rehabilitation, system expansion, and system enhancement that are not modeled in NBIAS or HERS to be reflected in the estimates. The investment scenario estimates shown should thus reflect the realistic size of the total highway capital investment program that is projected to be required in order to meet the performance goals specified in the scenarios.
Five selected scenarios are presented in Chapter 8 for the Interstate System, National Highway System, and the overall highway and bridge system; additional supplementary scenarios are shown for the systemwide analysis only. For each of these scenarios, two versions are presented, one assuming fixed rate user financing, and the other assuming variable rate user financing.
The Sustain Current Spending scenario projects the potential impacts of maintaining capital spending at base year 2006 levels in constant dollar terms over the 20-year period 2007 through 2026. The Sustain Conditions and Performance scenario assumes that combined public and private capital investment gradually changes in constant dollar terms over 20 years to the point at which two key performance indicators in 2026 are maintained at their base year 2006 levels. These indicators are adjusted average user costs (as computed by HERS) and the backlog of potential cost-beneficial bridge investments (as computed by NBIAS), which are intended to serve as summary measures of the overall conditions and performance of highways and bridges.
Three additional scenarios focus on the impacts of increasing combined public and private investment up to the point at which all potential capital improvements meeting a target benefit-cost ratio would be funded by 2026. These target benefit-cost ratios apply to the types of improvements modeled in HERS, and are set at 1.5, 1.2, and 1.0, respectively, in the MinBCR=1.5, MinBCR=1.2, and MinBCR=1.0 scenarios. The MinBCR=1.0 scenario represents an "investment ceiling" above which it would not be cost-beneficial to invest, even if available funding was unlimited. The version of this scenario assuming the widespread adoption of variable-rate user charges is also described as the "Maximum Economic Investment" level, as it reflects conditions under which users would be charged an economically rational price to travel on facilities that would be improved only to the extent that such investment was cost-beneficial. As the economic procedures in NBIAS are not as refined as those in HERS, comparable analyses are not currently feasible; consequently, the NBIAS component of each of these scenarios is identical, and is computed as the level of investment that would eliminate the total economic backlog of cost-beneficial investments to address bridge deficiencies by the end of the 20-year analysis period.
Two supplemental scenarios are presented at the systemwide level only. The Sustain Conditions and Performance of System Components scenario focuses on maintaining specific performance indicators for individual highway functional systems rather than more general indicators for the system as a whole. This scenario combines three elements: (1) the level of system expansion expenditures associated with maintaining average delay per VMT, (2) the level of system rehabilitation expenditures associated with maintaining average pavement roughness, and (3) the level of system rehabilitation expenditures associated with maintaining the economic investment backlog for bridges. The Sustain Conditions and Improve Performance scenario is a hybrid, combining the system rehabilitation expenditures from the Sustain Conditions and Performance of System Components scenario with the system expansion expenditures from the MinBCR=1.0 scenario.
In considering the future system performance impacts identified for each of these scenarios, it is important to note that they represent what could be achievable assuming a particular level of investment, rather than what would be achieved. While the models focus on engineering impacts and economic benefits and assume that projects would be carried out strictly in descending order of benefit-cost ratio, other factors do in fact influence project selection in actual practice. If some projects with lower benefit-cost ratios were carried out instead of projects with higher ratios, then the actual amount necessary to achieve any specific performance objective would be higher. Consequently, the level of investment identified as the amount sufficient to sustain a certain performance level should be viewed as the minimum amount that would be sufficient, if all other modeling assumptions prove to be accurate. This issue is discussed in more detail in Chapter 7, in a Q&A box titled "How closely does the HERS model simulate the actual project selection process of State and local highway agencies?"
Simply increasing the combined public and private spending to the Maximum Economic Investment level would not in itself guarantee that these funds would be expended in a cost-beneficial manner. Achieving the projected results for this scenario would require a combination of increasing spending and modifying Federal highway program requirements and State and local government practices to ensure that no project would be implemented unless its estimated benefits exceeded its estimated costs. There may also be some projects selected by the models, that, regardless of their economic merits or impact on conditions and performance, may simply be infeasible for political or other reasons. As a result, the supply of feasible cost-beneficial projects could possibly be exhausted at a lower level of investment than is indicated by this scenario. It is important to note that simple benefit-cost analysis is not a commonly utilized capital investment model in the private sector. Instead, firms utilize a rate of return approach and compare various investment options and their corresponding risk. In other words, a project that is barely cost-beneficial would almost certainly not be undertaken by the private sector when compared with an array of investment options that potentially produce higher return at equivalent or lower risk.
Transit Investment Scenarios
The transit section of Chapter 7 evaluates the impact of varying levels of capital investment on various measures of condition and performance, while the transit section of Chapter 8 provides a more in-depth analysis of specific investment scenarios. TERM uses separate modules to analyze different types of investments: those aimed at the physical condition of existing assets, those intended to maintain current operating performance, and those that would improve operating performance. TERM projects estimated capital investment to achieve the following benchmarks which are then combined to form the four primary investment scenarios:
Maintain Asset Conditions: Transit assets are replaced and rehabilitated over the 20-year period such that the average condition of the assets existing at the beginning of the period remains the same at the end of the period.
Maintain Performance: New transit vehicles and infrastructure investments are undertaken to accommodate increases in transit ridership so that the vehicle utilization rate existing at the beginning of the period remains the same at the end of the period.
Improve Conditions: Transit asset rehabilitation and replacement is accelerated to improve the average condition of all transit assets to a "good" level at the end of the 20-year period (2026). However, if an average condition of good can be reached only by replacing assets that are still in operationally acceptable condition, then the "Improve Conditions" scenario instead targets a slightly lower condition level.
Improve Performance: The performance of the Nation's transit system is improved as additional investments in bus rapid transit, light rail, or heavy rail are undertaken in urbanized areas with the most crowded vehicles and the systems with the slowest speeds to reduce vehicle utilization rates (and crowding) and increase average transit operating speeds.
The Maintain Conditions and Performance scenario identifies the level of investment needed to meet the Maintain Asset Conditions and Maintain Performance benchmarks. The Improve Conditions and Maintain Performance scenario reflects the investment needed to achieve the Improve Conditions and Maintain Performance benchmarks, while the Maintain Conditions and Improve Performance scenario reflects the Maintain Asset Conditions and Improve Performance benchmarks. The Improve Conditions and Performance scenario identifies the level of investment needed to meet the Improve Conditions and Improve Performance benchmarks. For each of these four primary scenarios, transit investments are disaggregated by type of improvement, type of asset, and urbanized area size. A fifth scenario, the Maintain Current Funding scenario, identifies the potential impacts on selected measures of conditions and performance of sustaining 2006 transit capital spending levels in constant dollar terms over the 2007 to 2026 period.
For Chapter 7 select analyses, a Replace at Condition 2.5 threshold was incorporated as an additional scenario to assess the impact of this investment strategy. This condition rating is defined within the parameters of TERM's transit asset condition rating system of 1 to 5 (poor to excellent). The Rail Modernization Study, released by FTA in April 2009, considered an asset to be in a state of good repair when the physical condition of that asset is at or above a threshold condition rating value of 2.5 (the mid-point between adequate and marginal). Similarly, an entire transit system would be in a state of good repair if all of its assets all have a condition value of 2.5 or higher. The level of investment required to attain and maintain a state of good repair is therefore that amount required to rehabilitate and replace all assets with estimated condition ratings that are less than 2.5.
For each of the four primary scenarios, two versions are presented in Chapter 8, one reflecting a minimum benefit-cost ratio of 1.0, and one reflecting a minimum benefit-cost ratio of 1.2. TERM has two benefit-cost tests. One test is applied to all potential investments to maintain conditions, improve conditions, and maintain performance and compares the benefits to riders and society of continuing to maintain each agency-mode with the costs of maintaining each agency-mode over a 20-year period. A separate test is applied on an urbanized area basis to investments proposed to improve performance; this test assesses whether the benefits to an urbanized area from the speed improvements would exceed the costs of these investments. Raising the benefit-cost ratio threshold from 1.0 to 1.2 reduces the number of agency-modes in which TERM will invest; each version of the scenario represents the investment level associated with meeting the scenarios objectives based on the set of agency modes being considered.
For both versions of the four primary scenarios, Chapter 8 also covers an additional set of analyses that consider the level of transit investment that could be needed to serve individuals diverted from autos due to the influence of the widespread adoption of congestion pricing on highways. These analyses are linked to the variable-rate user financing versions of the highway Sustain Current Spending and Maximum Economic Investment scenarios described above.
Comparisons Between Report Editions
The investment scenario estimates presented in Part II are intended to be comparable with previous editions of the C&P report. However, it is important to consider the following factors when making such comparisons.
Different Base Years: The future investment scenario estimates are calculated in constant base year dollars. However, since the base year changes between reports, inflation alone will cause the dollar estimates to tend to rise over time. Given the sharp increases in construction costs experienced in recent years, stating the investment requirements in 2006 dollars rather than 2004 dollars makes a big difference in the apparent size of the investment scenario levels.
Changes in Condition or Performance: Changes in the physical condition or operational performance of the highway or transit systems may affect the investment scenario estimates between reports. It is important to recognize that the conditions of "today" (i.e., 2006) in this report differ from the conditions of "today" (i.e., 2004, 2002, etc.) as presented in previous editions of the report. Hence, as the level of current system conditions and performance varies over time, the investment scenarios that are based on maintaining the status quo are effectively targeting something different each time.
If performance for a particular indicator has been deteriorating over time, this effectively results in a "lowered bar" for scenarios aimed at maintaining that indicator at baseline levels, which would tend to exert downward pressure on the level of investment associated with such scenarios. Conversely, if an indicator is improving over time, then the "Maintain" scenarios tied to that indicator would represent an increasing standard that is being maintained, which would tend to drive up the price tag associated with the scenarios.
The situation is somewhat the opposite for scenarios aimed at improving performance over time. If the conditions and performance of the underlying system deteriorate over time, then the models are likely to find more potential improvement projects to be cost-beneficial, or to find more improvements necessary to improve the conditions or performance of the system, which would tend to drive up the costs associated with the "Improve" scenarios. Conversely, if the system conditions and performance were to improve over time, this could reduce the pool of potential cost-beneficial investments.
Expansion of the Asset Base: As the Nation's highway and transit systems expand over time, the cost of maintaining this larger asset base will also tend to increase. For assets with useful lifetimes of less than 20 years, expansions of the infrastructure will also generate additional rehabilitation and replacement investment under the scenarios.
Changes in Technology: Changes in transportation technology may cause the price of capital assets to increase or decrease over time and thus affect the capital investment scenario estimates.
Changes in Scenario Definitions: Although the C&P report series has consistently reported investment levels for "Maintain" and "Improve" scenarios over time, the exact definition of these scenarios may change from one report to another. Such changes are explicitly noted and discussed in the text of the report when this occurs.
Changes in Analytical Techniques: The models and procedures used to generate the investment scenario estimates are subject to ongoing refinements and improvements, resulting in better estimates over time. The underlying data series used as inputs in the models may also be subject to changes in reporting requirements over time.