


- Environmental Sustainability
- Background
- Establishing Sustainability Goals
- Assessing Sustainability in the Transportation System
- Reducing Greenhouse Gas Emissions
- Total GHG From Transportation
- GHG Emissions per Passenger Mile or Ton Mile
- Improving System Efficiency and Reducing VMT Growth
- Integrated Land-Use Planning
- Transitioning to Fuel-Efficient Vehicles and Alternative Fuels
- Recycling in Transportation
- Recycled Materials
- Other Environmental Issues
- Other Sustainability Strategies
- Reducing Greenhouse Gas Emissions
- Sustainability in the Transportation Planning Process
- Context Sensitive Solutions
- Background
Environmental Sustainability
Transportation is crucial to our economy and quality of life; but the process of building, operating, and maintaining transportation systems has environmental consequences. The U.S. Department of Transportation's (U.S. DOT's) goal is to foster more sustainable approaches to transportation in order to avoid negative impacts now and to ensure that future generations will be able to enjoy the same or better standards of living and mobility as the current one. A sustainable transportation system is holistic, "one in which (a) current social and economic transportation needs are met in an environmentally conscious manner and (b) the ability of future generations to meet their needs is not compromised."1 Sustainable transportation focuses on environmental impacts such as improving energy efficiency, reducing dependence on oil, reducing greenhouse gas (GHG) emissions, and not harming the natural environment. A more extensive coverage of the definition of sustainability and sustainable transportation systems is provided in the Introduction to Part III, "Sustainable Transportation Systems."
Although the capital investment needs analyses presented in Part II of this report take increases in emissions (including GHG) into account as a societal cost (disbenefit) in their computation of the benefits and costs of infrastructure investment, they do not fully address the long-term societal benefits that could be obtained from more sustainable approaches to transportation services. The three chapters included in Part III of this report address the broader range of issues associated with moving toward more sustainable transportation systems. This chapter focuses on environmental sustainability issues, including GHG emissions attributable to the transportation sector. Chapter 12 examines issues pertaining to climate change adaptation, anticipating potential future changes in climate and the resulting impact on transportation infrastructure. Chapter 13 focuses on the livability of communities, addressing issues related to the human environment (in contrast with the focus on the natural environment in this chapter).
Given the impact of transportation on the natural environment and on society as a whole, it is important to measure the changing environmental, economic, and social impacts of the transportation system. This chapter provides a discussion of the goals and benefits of sustainability as it relates to transportation and looks at accomplishment made as well as the development of potential metrics for sustainable transportation trends. Given the range of issues related to environmental sustainability, this chapter does not attempt to explore all of them in depth.
Background
Chapter 2 describes the extent and use of the Nation's highway, bridge, and transit systems. In addition to these modes, travel by railroads, waterways, and air also play a key role in passenger and freight transportation, while pipelines move oil, gas, water, and other commodities. This transportation system has fostered new communities; connected cities, towns, and regions; and supported the growth of the national economy, but much of the movement on the system comes from the use of vehicles that rely on fossil fuels. From a sustainability perspective, the heavy reliance of the transportation system on such fuels is of significant concern, as they are non-renewable, generate air pollution, and contribute to the buildup of carbon dioxide (CO2) and other pollutants that cause global warming. The transportation sector consumes 29 percent of the total energy used in the United States, and almost all of it is in the form of petroleum. Of all the fossil fuels, petroleum is the largest contributor to CO2 emissions.2
The transportation sector was responsible for 29 percent of U.S. GHG emissions and 33 percent of U.S. CO2 emissions in 2008.3 CO2 is the most prominent GHG and contributor to global climate change by far. About 60 percent of the transportation emissions are from passenger cars and light-duty trucks, 20 percent from medium and heavy-duty trucks, and the remaining 20 percent from other modes of transportation, such as commercial aircraft and other non-road vehicles (ships, boats, rail, and pipelines).
Over the past four decades, progress has been made in reducing emissions of air pollutants both nationally and from the transportation sector in particular. Since 1970, transportation-sector emissions of carbon monoxide have been reduced by 67 percent, emissions of volatile organic compounds have been reduced by 68 percent, and emissions of nitrogen dioxide have been reduced by 38 percent.4 These reductions have been achieved, notwithstanding a 50 percent increase in the population, a tripling of real gross domestic product (GDP), and a 150 percent increase in passenger-miles traveled.5 Nonetheless, as of 2007, some 158.5 million Americans lived in regions that exceeded health-based national ambient-air-quality standards for at least one regulated air pollutant. Significant challenges remain, particularly as national ambient-air-quality standards are revised to be more protective of public health.
Sustainability in transportation should be addressed with the mindset that transportation is one part of a larger economic system, and represents an integral part of sustainable development. To seek more sustainable options, transportation programs will need to focus on integrating transportation decision-making with environmental considerations, including planning multimodal transportation systems in conjunction with land use in order to maximize efficiencies, reducing the environmental impact of construction and maintenance, and improving the operating efficiency of the system. Transportation agencies at all levels of government and their partners are uniquely positioned to work collaboratively in support of the Nation's environmental sustainability efforts.
Establishing Sustainability Goals
The U.S. DOT is collaborating with other Federal agencies, including HUD and EPA, to develop performance metrics that support the advance of environmentally sustainable polices in the transportation community. One area of focus is the development of performance metrics that will assist in GHG reduction. Determining the necessary research and data needed to develop these metrics is required. In some cases, data are not available or difficult to capture; as a starting point, the U.S. DOT is implementing metrics where data and information are readily available as a quantifiable measure. For example, information is readily available for States that have Climate Change Action plans, and one way to assist in GHG reduction is to encourage more States to implement them and to provide assistance in improving them, as needed. Work will continue to identify additional measures over time.
| What initial "Environmental Sustainability" performance measures have been identified by the FHWA and FTA? | |
|
The FHWA has established an initial target to increase the number of States with State Climate Action Plans that reduce greenhouse gas emissions from transportation from 35 in FY 2010 to between 38 and 40 in FY 2011.
Climate Action Plans can help States to determine the steps they can take to reduce greenhouse gas emissions and assess the vulnerability of various transportation assets to climate impacts. The FHWA provides technical and financial assistance to States in the form of workshops, webinars, and peer exchanges to assist in incorporating transportation elements into their Plans. The FHWA encourages its Division offices to review the transportation-related sections of the report as part of the assistance efforts. The FHWA is preparing a template that can be used to collect information on State climate activities, which will be useful in tracking progress.
The FTA has established three sustainability performance metrics:
These metrics are to support the outcomes of:
The FHWA and FTA continue to analyze and assess options for developing additional performance measures.
|
|
A March 2010 report prepared for the FHWA entitled "Criteria and Tools for Sustainable Highways" explores additional performance measures for sustainability. One of the struggles in creating sustainability performance measures is the need for shifting from automobile-centric (and operations-focused) measures to more holistic indicators, even if they are more difficult to measure.6 The report also notes the paradigm shift required to capture sustainability concerns, moving from measuring mobility to accessibility, and from assessing outputs to outcomes.7
At the Federal level, environmental sustainability has been adopted as a strategic planning goal in the U.S. DOT Strategic Plan FY 2010–2015. The goal is to: "Advance environmentally sustainable polices and investments that reduce carbon and other harmful emissions from transportation sources."
At the State level, transportation agencies are in various stages of developing performance metrics that address sustainability criteria and monitor progress toward the goal of more sustainable roadways. Many State transportation agencies have increasingly integrated the concept of sustainability into their activities. In the United States, over 40 percent of State transportation agencies have incorporated sustainability into their vision or mission statements.8 Some are also developing specific sustainability goals and performance measures to assess their progress toward these goals. Sixty-eight public transportation agencies and private-sector transit industry members have signed the American Public Transportation Association Sustainability Commitment. Under this commitment, signatories commit to a core set of actions on sustainability, measure environmental impacts in key areas, and meet reduction targets.9 By quantifying outcomes, a transportation sustainability performance metric can encourage more sustainable practices, allow informed decisions and trade-offs regarding roadway sustainability, enable transportation organizations to confer benefits on sustainable road projects and programs, and communicate roadway sustainability to stakeholders.
Assessing Sustainability of the Transportation System
Developing performance measures to evaluate sustainability is important in order to assess the progress of States, localities, and the Nation as a whole in meeting the goal. It involves looking through different lenses in order to ensure that all aspects of the concept are represented. In this section, some of the categories of measures that could be used to evaluate sustainability are explored. These categories include reducing GHG emissions, improving system efficiency and reducing the growth of VMT, transitioning to fuel-efficient vehicles and alternative fuels, and increasing the use of recycled materials in transportation. A list of some additional metrics for consideration is provided at the end of this section. Selected initiatives relating to the issues discussed in this section are presented in callout boxes, which include references to where more information is available.
|
Infrastructure Voluntary Evaluation Sustainability Tool (INVEST) The FHWA has launched an initiative to support transportation agencies in making highway projects more sustainable. This new initiative provides a practical tool, called the Infrastructure Voluntary Evaluation Sustainability Tool (INVEST), for integrating sustainability best practices into transportation projects and programs. The tool is innovative in that it is a self-evaluation tool that allows users to assess for themselves how sustainable their programs or projects may be. Participation in the initiative and application of the tool are voluntary, allowing users to determine for themselves how best to achieve a desired level of sustainability in their programs and projects. |
Reducing Greenhouse Gas Emissions
Metropolitan planning organizations (MPOs), State departments of transportation (DOTs), and transit agencies have recently begun to consider strategies available for immediate and future implementation, and some are implementing them. Ultimately, mitigation of GHG emissions reduces the extent of climate change experienced by current and future generations; but, given the large increases in concentrations of GHG over the last two centuries, some level of climate change is inevitable and is in fact already occurring.10 GHGs, such as CO2, trap heat in the Earth's atmosphere. According to the Intergovernmental Panel on Climate Change (IPCC), GHG emissions from human activities, principally the burning of fossil fuels, are the primary cause of global warming with projected impacts including sea level rise, more intense storms and droughts, biodiversity loss, reduced agricultural yields, and stress on the water supply. An IPCC report finds that GHG emissions must be reduced by 50 to 85 percent by 2050 in order to limit global warming to 4 degrees Fahrenheit, avoiding many of the worst impacts of climate change.11 While widespread climate impacts are occurring now and are expected to increase, the extent of climate change and its impacts depend on choices made today to mitigate human-caused emissions of GHGs.12 CO2 makes up 96 percent of all transportation GHG emissions. Other human-induced GHG emissions created by transportation and other sectors are methane (CH4), nitrous oxide (N2O), chlorofluorocarbons (CFCs), hydrofluorocarbons (HFCs), perfluorocarbons (PFCs), and sulfur hexafluoride (SF6).
|
California Senate Bill 375 The State of California has enacted "The Sustainable Communities and Climate Protection Act of 2008" (SB 375), which is an example of how State governments are beginning to adopt strategies to promote more sustainable communities. A requirement of this act is to establish GHG emission reduction targets for passenger vehicles by 2020 and 2035, for each of the State's 18 MPOs. Each MPO will prepare a Sustainable Communities Strategy (SCS) that will demonstrate how the region will meet GHG reduction targets through integrated land use, housing, and transportation planning. SCSs will then be incorporated into each MPO's Regional Transportation Plan (RTP). More information on SB 375 can be found at http://www.arb.ca.gov/cc/sb375/sb375.cfm. |
Initial measures of environmental performance of the Nation's transportation system, specifically related to climate change outcomes, use metrics of total GHG emissions from transportation, GHG emissions per capita from transportation, and GHG emissions per passenger mile or ton mile.
Total GHG From Transportation
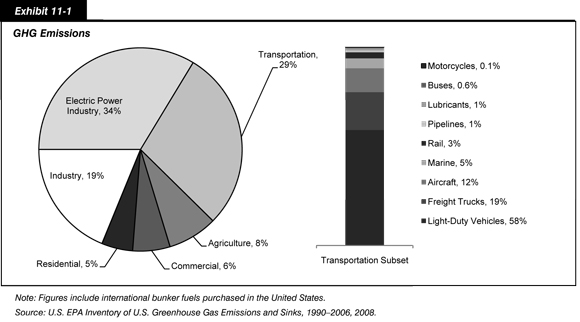
As shown in Exhibit 11-1, the transportation sector is a major contributor to GHG emissions. Burning fuel to power U.S. vehicles results in 2.1 billion metric tons of CO2 equivalent (CO2e), or 29 percent of all U.S. GHG emissions and 5 percent of global emissions (on-road vehicles comprise the largest share). The inclusion of life-cycle emissions—such as the production and distribution of fuel, the manufacture of vehicles, and the construction and maintenance of transportation infrastructure—increase transportation GHG emissions by around 50 percent.13 GHGs from the transportation sector grew 27 percent from 1990 to 2006. Freight-truck GHGs have grown faster than those of any other transportation mode, growing 77 percent between 1990 and 2006. Emissions from light-duty vehicles grew 24 percent over the same time period, due to increases in VMT of over twice the population growth and a stagnation of vehicle fuel economy. Although airline passenger miles increased 69 percent over the period, commercial aircraft emissions increased only 4 percent, due primarily to increased passenger loads.14
|
Green Building The FTA developed an action plan that promotes green building practices in transit facilities. Several transit agencies, including Santa Clara Transit and the Chicago Transit Authority, have obtained Leadership in Energy and Environmental Design (LEED) Gold certification from the Green Building Council. Additional information on the FTA Green Building Action Plan can be found at http://www.fta.dot.gov/12907_10318.cfml. |
The Energy Information Administration's (EIA's) Annual Energy Outlook (AEO) 2010 projects little growth in transportation GHG emissions through 2030. In the light-duty-vehicle sector, the AEO projects that increased Federal fuel-economy standards and the renewable-fuels standard will offset VMT growth and lead to a net 12 percent decline in light-duty-vehicle emissions. Freight trucks, on the other hand, show a 20 percent increase in emissions, while domestic aviation climbs 27 percent. AEO takes into account existing government legislation and regulations.15
GHG Emissions per Passenger Mile or Ton Mile
The fuel economy of light-duty vehicles increased with Corporate Average Fuel Economy (CAFE) standards in the 1970s and 1980s and had remained roughly stagnant until recently.16 The number of passengers per vehicle had declined since the 1970s to an average of 1.68 per trip and 1.10 for work trips.17 This has led to increased GHG per passenger mile traveled (PMT), with passenger cars at 261 grams CO2 equivalent per PMT and light-duty trucks at 301 grams CO2e per PMT in 2006.18 These estimates include vehicle operating emissions and not additional life-cycle components. With new fuel-economy standards promulgated by the U.S. DOT in 2010, fuel economy of new light-duty vehicles will average 35.5 mpg in 2016.
Freight-trucking GHG emissions per ton-mile carried increased almost 13 percent between 1990 and 2005, reflecting the stagnant fuel economy and decreased loads per truck resulting from structural changes in the economy that produced higher-value, lower-weight, time-sensitive shipments. The National Academy of Sciences completed a study in March 2010 of medium- and heavy-duty-vehicles' efficiency and found significant opportunities for cost-effective engine and aerodynamic improvements. In May 2010, it was announced that EPA and NHTSA would establish joint GHG and fuel-economy regulations for medium- and heavy-duty vehicles under existing statutory authority. This will improve the fuel efficiency of work trucks, delivery trucks, tractor trailers, buses, and other medium- and heavy-duty vehicles.
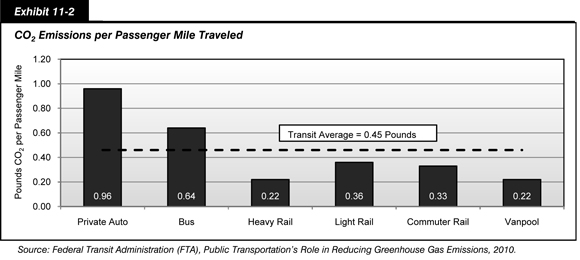
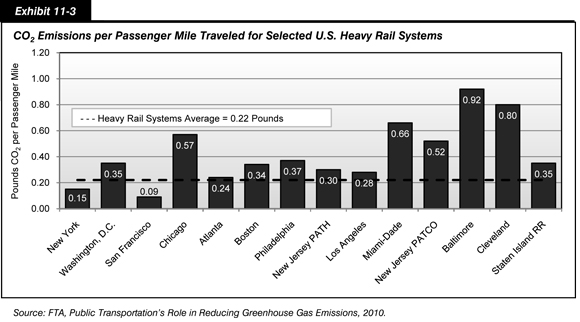
As shown in Exhibit 11-2, CO2 operating emissions for transit per passenger mile can be lower than that of automobiles with a single occupant, when ridership levels result in more people moving in fewer vehicles. Exhibit 11-3 shows that GHG efficiency for heavy rail systems varies greatly by region. One factor in this variation is typical vehicle occupancy for different transit systems; a full train has half as much emission per passenger mile as a half-full train. Differences in electricity sources in different regions also play a role; to the extent that electricity is produced by nuclear or hydroelectric plants versus coal-fired plants can have a significant impact on public transportation GHG efficiency. Differences in equipment, such as the weight and energy efficiencies of different types of trains, also play a role.
|
TIGGER Program Through the Transit Investment for Greenhouse Gas and Energy Reduction (TIGGER) Program, the FTA works directly with public transit agencies to implement new strategies for reducing GHG emissions and energy use in their operations. Examples of projects supported by the program include on-board vehicle energy management, electrification of accessories, bus design, rail transit energy management, and locomotive design. Additional information on this program can be found at http://www.fta.dot.gov/assistance/research_11424.cfml. |
Improving System Efficiency and Reducing VMT Growth
One of the primary indicators of system inefficiency is congestion. Congestion occurs when the demand for travel is greater than supply in the transportation system. As discussed in Chapter 4, the Texas Transportation Institute estimates drivers in large metropolitan areas experienced 4.2 billion hours of delay due to congestion in 2007, resulting in 2.8 billion gallons of wasted fuel and congestion costs of $87 billion. Traffic volume is expected to grow, with freight movement expected to double by 2020. Chapter 4 presents a number of potential congestion reduction strategies. While the strategic addition of road capacity can play a role, the traditional approach of building new routes or adding lanes to existing routes is not sustainable due to the effects of induced demand. The implementation of system management and operations strategies, including the deployment of intelligent transportation systems, provides opportunities to make more productive use of existing infrastructure assets. The use of congestion pricing can help create an efficient transportation market by addressing one of congestion's root causes, namely that most travelers do not pay the full cost of transportation services. Finally, building livable communities that consider the impacts of development on transportation demand can begin to reduce travel demands by providing more transportation choices and considering the impact of development and the transportation network.
Chapter 1 provides information on how households in America make trips. According to the 2009 NHTS, 94 percent of trips over 2 miles are made by vehicle and 60 percent of those trips shorter than one-half of a mile are walking trips. Most survey respondents reported that the greatest barriers to walking are the perception of too much traffic, not enough street lighting, or wide road crossings. People were also concerned about crime, had no nearby paths or sidewalks, and were too busy to walk more often. Improving access to pedestrian and biking infrastructure can encourage an increase in walking or riding a bike. To the extent travelers substitute car travel for travel by foot and bicycle, those travelers would experience improved health and lower travel costs. If total VMT by car falls as a consequence, then emissions and congestion will also fall. When biking or walking are not viable options, increased transit use and ride sharing are other means of reducing VMT.
|
Nonmotorized Transportation Pilot Program (NTPP) The NTPP encourages bicycling and walking by promoting and building a network of nonmotorized transportation infrastructure facilities—including sidewalks, bicycle lanes, and trails—that connect directly with transit stations, schools, residences, businesses, and recreation areas. Pilot programs have been started in four communities: Columbia, Missouri; Marin County, California; Minneapolis, Minnesota; and Sheboygan County, Wisconsin. For more information on the program, see www.fhwa.dot.gov/environment/bikeped/ntpp.cfm. |
|
New Starts Program New Starts provides Federal financial resources to locally planned, implemented, and operated transit "guideway" capital investment projects. The goal of the program is to improve mobility, reduce congestion, improve air quality, and foster livable communities. For more information on the program, see www.fta.dot.gov/planning/planning_environment_5221.cfml. |
|
Transit-Oriented Development (TOD) FTA promotes mixed-use development near transit facilities and access to transportation and housing for people of all ages and incomes. TOD activities that are eligible for Federal funding include walkways, open spaces, intermodal transfer facilities, and bicycle improvements. Through planning and land use, TOD activities can help decrease traffic congestion, improve air quality, and improve public health through increased walking. For more information on TOD, see http://www.fta.dot.gov/about_FTA_6932.cfml. |
Integrated Land-Use Planning
Coordinating land use with transportation planning and development helps to preserve and enhance natural and cultural resources and facilitates sustainable communities by fostering a balance of mixed-use space for housing, educational, employment, recreational, and service opportunities. The U.S. DOT encourages local and State governments to coordinate land use and development in their planning process through activities such as Transit Oriented Development and Brownfield Redevelopment. These options focus on increased infill development, smart growth, and a concentration of development around established activity centers—with increased multimodal access to transit, accessible roads, walkways, and bike paths. Additional information on integrated land-use planning can be found at www.fhwa.dot.gov/planning/landuse/index.cfm.
|
Brownfield Redevelopment Brownfields are abandoned or underused properties available for redevelopment but that may contain residual hazardous materials from the land's previous use. According to a study of the Brownfield Program, brownfield revitalization efforts have resulted in a 33- to 57-percent reduction in VMT due to compact development and transit expansion, and a 47- to 62-percent reduction in stormwater runoff in redeveloped project sites that were evaluated.i U.S. DOT encourages State and local transportation agencies to incorporate redevelopment sites into transportation improvement projects.ii For more information on this program see www.epa.gov/brownfields. i EPA, "The EPA Brownfields Program Produces Widespread Environmental and Economic Benefits," April 2010, http://www.epa.gov/brownfields/overview/Brownfields-Benefits-postcard.pdf. ii FHWA, "FHWA and FTA Policy and Information on the Brownfields Economic Redevelopment Initiative," https://www.fhwa.dot.gov/environment/bf_disc.cfm. |
Transitioning to Fuel-Efficient Vehicles and Alternative Fuels
The types of fuels commonly used today (primarily gasoline and diesel) together with vehicles with low fuel efficiency both negatively impact the environment. According to the EIA, as of 2007, there were 249 million vehicles (including cars, buses, and trucks) in the United States. Personal vehicles, such as cars and light trucks, comprised 60 percent of the total energy consumed in the transportation sector. Gasoline and diesel made up 84 percent of the total energy used in transportation.19 This has occurred while GHG emissions related to transportation grew 27 percent from 1990 to 2006. Emissions can be reduced by transitioning to more fuel-efficient vehicles and alternative fuels that decrease the use of high-emission fuels such as gasoline and diesel. As mentioned earlier, new U.S. DOT fuel economy standards for light-duty vehicles and heavy and medium-duty trucks will improve the fuel efficiency of the fleet.
|
Clean Fuels Grant Program This FTA program assists nonattainment and maintenance areas achieve or maintain the National Ambient Air Quality Standards for ozone and carbon monoxide. Funding is available to transit agencies for clean fuel buses, clean fuel bus facilities, and electrical recharging facilities, and to support other projects related to clean fuel, biodiesel, hybrid electric, or zero-emissions technology buses. For more information, see http://www.fta.dot.gov/funding/grants/grants_financing_3560.cfml. |
Over the past 30 years, numerous programs and projects have been established to decrease the transportation sector's energy consumption through the development of more fuel-efficient vehicles and the use of renewable energy to decrease fossil-fuel consumption. As of 2008, there were 1.5 million personal alternative-fuel vehicles and 2,565 alternative-fuel buses (transit, intercity, and school). Alternative fuels included types such as biodiesel, compressed natural gas, propane/liquefied petroleum, hydrogen, and liquefied natural gas. Obstacles to increasing the number of vehicles that use alternative fuels include the scarcity of fueling stations and other infrastructure necessities. Although the number of alternative-fuel stations in the United States has increased from 3,691 to 6,411 since 1992, these stations are not spread evenly across the country.
There are even fewer electric charging stations nationwide where users can charge a plug-in hybrid or electric vehicle. Most States do not have any of these stations or have fewer than 10. In 2008, only two States had more than 10 charging stations—Oregon had 34 and California had 420.20
| Has the number of alternative fuel and electric charging stations increased since 2008? | |
|
Yes. The Department of Energy Alternative Fuels and Advanced Vehicle Data Center provides the most current information on alternative fuel stations and electric charging stations on the website: http://www.afdc.energy.gov/afdc/fuels/stations.cfml.
By 2010, the number of alternative fuel stations increased nationwide from 6,411 in 2008 to around 9,000. Electric charging stations numbered around 2,400 by 2010 with over 500 in California; over 100 each in Texas and Washington; and over 50 each in Oregon and Florida. Approximately half of all States still have 10 or fewer stations.
|
|
Recycling in Transportation
Developing roads, bridges, transit systems, and other infrastructure by using materials and methods that reduce the negative impact on the environment is essential to sustainable transportation. This section describes where recycled materials are being used to reduce the adverse impact of transportation construction on the environment.
|
Every Day Counts In 2009, FHWA launched the Every Day Counts (EDC) initiative, designed to identify and deploy technologies that shorten project delivery time, enhance the safety of roadways, and protect the environment through the use of cost-effective techniques that help to reduce energy use and to increase recycling and greener transportation options. For more information on EDC, see https://www.fhwa.dot.gov/everydaycounts/. |
Recycled Materials
Aggregate is crushed rock or gravel used to produce concrete. The process of mining and transporting aggregate material creates environmental impacts in the form of GHG emissions, making the reprocessing or recycling of aggregate materials a more sustainable option. Currently, many State departments of transportation (DOTs) are using reclaimed asphalt pavement (RAP) and Warm Mix Asphalt (WMA) in highway construction to reduce energy consumption and GHG emissions and to preserve nonrenewable resources. In addition, recycled materials are expected to provide significant cost savings on transportation projects. Transit organizations also participate in recycling efforts. Cost savings and environmental benefits can also occur through reuse and rehabilitation of existing facilities where practical, especially non-renewable historic resources. The greenest bridge may be one that is already built, saving not only the energy that would be required to produce new materials, but also the energy that is embodied in the existing structure. This is consistent with practical design and minimizing the use of non-renewable resources.
|
Recycling in Transit There are numerous recycling initiatives in public transportation. Many transit agencies reuse and recycle oil, oil filters, paint and other chemicals, scrap metal, bus and train batteries, and bus and train wash water either on-site or off-site in order to reduce operation costs. Some agencies, such as in Los Angeles, have agreements in place with tire companies to send all used tires back to the company for recycling into crumb rubber, which can be used for mats or in asphalt. TriMet in Portland, Oregon, reuses plastic billboards in the paved portions of its train tracks and also uses recycled tires in its sound walls along tracks. |
|
Reclaimed Asphalt Pavement RAP is made using a recycling process that mixes removed or reprocessed pavement materials, including asphalt and aggregates, with virgin aggregate.i On average, State DOTs use 12 percent RAP in hot-mix asphalt (HMA) mixtures. Currently, 44 State DOTs allow 25 percent RAP in at least one layer of HMA, with 23 allowing it in all layers. Twenty-seven States have increased their use of RAP since 2007.ii i Audrey Copeland, Cecil Jones, and John Bukowski, "Reclaiming Roads," Public Roads, March/April 2010, Vol. 73, No.5; available at https://www.fhwa.dot.gov/publications/publicroads/10mar/06.cfm. ii Ibid. |
|
Warm Mix Asphalt (WMA) WMA is made using a process that allows pavement materials to be produced at lower temperatures than other mixes and that reduces energy consumption and emissions in the production process. It is estimated that increased use of WMA will reduce CO2 and sulfur dioxide emissions by 45 percent, nitrogen oxide by 60 percent, and use of organic material by 41 percent.i For more information on WMA go to www.fhwa.dot.gov/pavemenet/asphalt/wma.cfm. i FHWA, "Warm Mix Asphalt Technologies and Research," October 2008, https://www.fhwa.dot.gov/pavement/asphalt/wma.cfm. |
Other Environmental Issues
The U.S. DOT focuses on many issues concerning environmental protection and enhancement. As discussed earlier in this chapter, GHG emissions have gained much attention as a measure of the impacts of transportation. In addition to GHG, there are other environmental concerns surrounding air quality, water quality (including storm water and waste management), and wetlands preservation. The transportation planning and project development process must take these types of considerations into account.
|
Green Streets "Green Streets" is an approach that encourages the use of natural systems for stormwater management that mimic natural hydrology, such as using swells and protected boxes that contain trees, bushes, shrubs, and grasses to allow stormwater to funnel through. The approach protects ecologically sensitive areas, reduces or minimizes heat islands, improves air quality, reduces stormwater pollutants, and is aesthetically attractive. |
Transportation agencies must follow the requirements of the National Environmental Policy Act (NEPA), which provides guidelines for protection of the environment as part of the process for project planning and design. Through the use of NEPA, the U.S. DOT provides a balanced and streamlined approach to transportation decision-making that takes into account the impacts of human and natural resources and the public's need for safe and efficient transportation improvements. NEPA has not only served as the framework for the environmental process, but as a precursor for current sustainable transportation system efforts as well. Additional information about NEPA can be found at http://www.environment.fhwa.dot.gov/projdev/index.asp.
|
Stormwater Management Surfaces such as roads and sidewalks can collect a variety of pollutants from usage, maintenance, and natural conditions. These pollutants become a potential threat when they are washed away in stormwater runoff. Best practices for stormwater management include implementing rain gardens, landscapes that filter rainwater, and the use of permeable paving that absorbs rainwater into underground reservoirs.i i EPA, "EPA Headquarters Low Impact Development Program," April 2010, http://www.epa.gov/greeningepa/stormwater/hq_lid.cfm; and "Low Impact Development (LID)," August 2009, http://cfpub.epa.gov/npdes/greeninfrastructure/information.cfm#glossary. |
|
Limiting Wastewater Wastewater runoff associated with transportation projects can contain numerous pollutants that can be released into stormwater systems. Vehicle washing and steam cleaning can generate wastewater that contains oil, grease, and other detergents, which can wash into the sewer system. FTA is working with transit agencies on methods that limit wastewater runoff. New transit project proposals are now required to include methods of reducing runoff and preventing stormwater pollutants in their environmental documents. Existing transit facilities are encouraged to control the use of chemicals and detergents to prevent runoff. For more information on this issue, see http://www.fta.dot.gov/12347_2230.cfml. |
|
Wetlands Protection Wetlands protection is another environmental concern because wetland habitats shelter endangered plant and animal species.i Using a wetland-banking "credits" system, Federally funded transportation projects must "bank" 1.5 acres of healthy wetland for every 1.0 acre of wetlands impacted by projects. As of 2006, Federal-aid highway projects banked, on average, 2.6 acres of wetlands for every acre impactedii. i FHWA, "Wetlands and Highways: A Natural Approach," 1995, http://www.environment.fhwa.dot.gov/ecosystems/wet_wetlands.asp. ii DOT, Performance and Accountability Report FY 2006, http://www.dot.gov/perfacc2006/environstew.cfm. |
Other Sustainability Strategies
Because of the limitations in discussing all potential metrics and strategies fully, Exhibit 11-4 summarizes other sustainability strategies in transportation and briefly describes each.21
Transportation organizations are increasingly focusing on projects and programs that support the creation of a sustainable transportation system. Much has been accomplished, and much more is planned. Marking progress made in these endeavors is also in the works, although these efforts are still in the early phases for many transportation organizations. Efforts to collect information and data on best practices, select measures, and evaluate progress are in various phases of development among Federal, State, and local governments.
| Strategy | Description |
|---|---|
| Improving System Efficiency | |
| Transit Signal Priority | Uses sensors to detect approaching transit vehicles and alter signal timings. |
| Speed Limit Reductions | Reduces speed limits to 55 mph nationally. |
| Truck Idling Reduction | Equips sleeper cabs with on-board auxiliary power units for heating and cooling, truck stop electrification, and anti-idling ordinances. |
| Lane Control | Controls signs, supported by surveillance and detection technologies, allowing temporary lane closures to avoid incidents on freeways. |
| Reducing Growth in VMT | |
| Ridesharing | Promotes carpools, vanpools, and other ridesharing techniques. |
| Combining Trips | Promotes and makes it easier to link multiple trips into one or two. |
| Transitioning to Fuel-Efficient Vehicles and Alternative Fuels | |
| CAFE Standards | Increases CAFE standards to increase the number of highly fuel efficient vehicles. |
| National Fuel Cell Bus Program | Develops new fuel cell technologies that improve fuel efficiency of transit. |
| Alternative Fuel Infrastructure | Improves and increases alternative-fuel infrastructure through tax credits, grant programs, and/or mandates. |
| Ecosystem Protection | |
| Protection and Preservation of Native Species | Uses native plants that have adapted to natural surroundings; protects endangered species. |
| Habitat Restoration | Restores or preserves natural habitats during/after transportation construction projects. |
| Reducing Construction Environmental Impacts | |
| Sustainable Paving Processes | Includes roller-compacted concrete and two-lift construction. |
| Local Materials | Promotes use of local aggregate in highway construction projects. |
| Have performance measures been developed at the national level? | |
|
Currently, a number of sustainable transportation system performance indicators show progress at the national level. A good example of this is the information collected to date on GHG emissions, although comprehensive data are not readily available in other areas at this point.
However, before more data and information are collected, there must be agreement on what should be measured. With the wide range of possible areas of emphasis and impact, the product of this agreement will likely be a collection of sustainability metrics. Discussion is underway as the U.S. DOT and partner agencies work toward gaining consensus on which metrics will be the focus.
|
|
Sustainability in the Transportation Planning Process
The transportation planning process plays a fundamental role in identifying and implementing the vision and strategic goals of a State, region, or community for its future. The long-range planning process is an opportunity for transportation stakeholders to consider the long-term costs and benefits involved in developing transportation projects—including sustainability—in their community. One recent study indicates that even though most transportation agencies have not explicitly mentioned sustainability in their long-range planning, a majority of them are incorporating sustainable transportation system concerns—such as environment, future needs, and social equity—into their transportation planning process.22
| What are some examples of States incorporating sustainability into their transportation planning process? | |
|
State transportation agencies are increasingly incorporating sustainable practices into their transportation programs for planning, design, operations, maintenance, and performance measurement. For example, Oregon DOT has adopted Solar Highways, using renewal energy for highway lighting. New York is using the GreenLITES (Green Leadership in Transportation Environmental Sustainability) rating system to recognize transportation projects that incorporate a high level of environmental sustainability. For more information on these, as well as other state initiatives, see
http://environment.transportation.org/environmental_issues/sustainability/case_studies.aspx
|
|
State DOTs also have project-level planning and design requirements. The NEPA process provides a framework in which planners and stakeholders can consider many factors, including sustainability, prior to construction of a proposed project. At present, Federal planning and NEPA-related legislation do not specifically reference sustainability per se. However, many of the factors that are commonly requirements for consideration during project-level planning and NEPA review are directly related to the types of sustainability-related issues identified in this chapter.
One example of efforts to respond to the challenge of creating a sustainable transportation system is the increased use of context sensitive solutions (CSS). A CSS approach requires that transportation planning consider the interactions between transportation systems and tailor them to the local area human, cultural, and natural environment.
Context Sensitive Solutions
The U.S. DOT is already using CSS to actively engage stakeholders in a collaborative, interdisciplinary, decision-making approach. CSS is a collaborative problem-solving model where transportation agencies consider and build on ideas generated by stakeholders. CSS projects consider communities' characteristics and visions, new and emerging technologies, bicycle and pedestrian facilities, transit and multimodal connections, stormwater management, and use of recycled materials and structures. The approach also preserves and enhances scenic, aesthetic, and historic community and environmental resources while improving or maintaining safety, mobility, and infrastructure conditions.23
CSS can be applied to all aspects of project development from planning and design to construction, operation, and maintenance. CSS has been utilized most frequently for difficult and complex projects with major impact. Increasingly, however, State DOTs are seeking to use CSS from the onset of project planning and in more routine projects. CSS does not represent a philosophy to be selectively applied to certain categories of projects, but an approach to transportation planning, design, construction, and maintenance that is scalable to use on every transportation project.
The application of CSS principles within the transportation planning process assists regions and communities in reaching their transportation goals by encouraging the integration of land use, transportation, and infrastructure. When transportation planning reflects community input and takes into consideration the impacts on both natural and human environments, it also promotes partnerships that lead to more balanced decisionmaking. Use of the CSS philosophy and approaches during project development can improve project decisionmaking; expedite project delivery; and enhance mobility, safety, livability, and environmental sustainability.
Endnotes
1 W.R. Black, "Sustainable Transport: Definitions and Responses," Integrating Sustainability into the Transportation Planning Process, Conference Proceedings 37, Committee for the Conference on Introducing Sustainability into Surface Transportation Planning, July 11–13, 2004, Baltimore, Transportation Research Board, Washington DC, 2005, pages 35–43.
2 See http://www.eia.gov/oiaf/1605/ggrpt/carbon.cfml.
3 See http://www.eia.gov/environment/emissions/ghg_report/pdf/tbl3.pdf.
4 EPA National Air Pollutant Emission Trends Report, 2008, http://www.epa.gov/ttn/chief/trends/.
5 "Transportation Air Quality Selected Facts and Figures, 2006," https://www.fhwa.dot.gov/environment/air_quality/publications/fact_book/page06.cfm.
6 Tara Ramani, "Criteria and Tools for Sustainable Highways," March 31, 2010, page 8.
7 Ibid, page 8.
8 Christy Mihyeon Jeon, Dissertation: Incorporating Sustainability into Transportation Planning and Decisionmaking, Georgia Institute of Technology, December 2007.
9 American Public Transportation Association, Sustainability Commitment, 2010, http://www.apta.com/resources/hottopics/sustainability/Documents/APTA-Sustainability-Commitment.pdf.
10 See U.S. Global Change Research Program, Global Climate Change Impacts in the United States, June 2009, http://www.globalchange.gov/what-we-do/assessment/previous-assessments/global-climate-change-impacts-in-the-us-2009.
11 Intergovernmental Panel on Climate Change (IPCC), Fourth Assessment Report, 2007, http://www.ipcc.ch/publications_and_data/publications_and_data_reports.shtml#1.
12 U.S. Global Change Research Program, Global Climate Change Impacts in the United States, June 2009.
13 U.S. DOT, Transportation's Role in Reducing U.S. Greenhouse Gas Emissions, April 2010.
14 U.S. EPA, Inventory of U.S. Greenhouse Gas Emissions and Sinks: 1990-2006, 2008.
15 EIA, Annual Energy Outlook 2010, May 2010, http://www.eia.gov/forecasts/archive/aeo10/.
16 U.S. EPA, Light Duty Automotive Technology and Fuel Economy Trends: 1975 through 2007, Document #EPA420-S-07-001, September 2007.
17 2001 National Household Transportation Survey.
18 U.S. DOT, Transportation's Role in Reducing U.S. Greenhouse Gas Emissions, April 2010, Vol. 1, pages 2–19.
19 EIA, "Use of Energy in the United States: Energy Use for Transportation," 2010, http://www.eia.doe.gov/energyexplained/index.cfm?page=us_energy_transportation#tab1.
20 EIA, Alternative Fuels & Advanced Vehicles Data Center, "Alternative Fueling Station Locator," http://www.afdc.energy.gov/afdc/locator/stations/state.
21 FHWA, Performance Evaluation of Various Rehabilitation and Preservation Treatments, January 2010, page 31.
22 C. Jeon and A. Amekudzi, "Addressing Sustainability in Transportation Systems: Definitions, Indicators, and Metrics," Journal of Infrastructure Systems, Vol. 11, March 2005, pages 31–50.
23 "What is Context Sensitive Solutions?," FHWA and Center for Transportation and the Environment at North Carolina State University, National Dialog for Context Sensitive Solutions, http://cssnationaldialog.org/index.asp.
To view PDF files, you need the Acrobat® Reader®.