


- Livability
- Characteristics of Livability
- Benefits of Livable Communities
- Provides More Transportation Options and Integrates Land Use Planning
- Promotes Healthy Living
- Improves Pedestrian Safety
- Incentivizes Local Business Investment
- Lowers Household Transportation Costs
- Saves Community Infrastructure Costs
- Performance Indices
- Livability Performance Measures
- Interim Measures
Chapter 13 Livability
Fostering livable communities—places where transportation, housing, and commercial development investments have been coordinated so that everyone has access to adequate, affordable, and environmentally sustainable travel options—is a U.S. DOT goal. This chapter presents an overview of how transportation can improve livability in communities across the Nation with a focus on the characteristics, measures, and goals of livability. This chapter provides data and information that help to provide awareness of the benefits of livable communities and the U.S. DOT and transportation's role in this effort.
Integrating transportation, land use, and housing planning can help improve livability by encouraging mixed-use development (residential, commercial, education, recreation, etc.) that co-locates housing and other key amenities with multimodal transportation options in order to reduce both trip distance and time. Implementing strategies that incorporate the principles of livability in urban and rural areas will result in improved quality of life for all Americans and create more efficient and more accessible transportation networks to meet the needs of individual communities.
Characteristics of Livability
A livable community is one that provides safe and convenient transportation choices to all citizens, whether it's by walking, bicycling, transit, driving, or combinations of these modes. How a community is designed—including the layout of its roads, bridges, transit systems, walkways, and shared—use paths-has an impact on its residents. As the U.S. population increases and the characteristics of the population change, it is essential to identify new strategies to move people and goods within communities and throughout the Nation. Integrating transportation planning with community development and expanding transportation options will not only improve connectivity and influence how people choose to travel, but also enable communities to jointly consider the design of transportation and land use. There are many benefits of well designed mixed use neighborhoods with inter-connected streets, transit access, and bike and pedestrian connections. These include shorter trip lengths; reduced vehicle-miles traveled; safer streets for all users including bus riders, pedestrians, and bicyclists; lower per-capita greenhouse gas emissions; reduced dependence on fossil fuels; increased trip-chaining; and independence for those who prefer not to drive or are unable to drive.
It is important to understand that livability is important in all communities, urban and rural. A livable rural area is one in which people are able to obtain essential services, including employment, emergency services, health care, and educational opportunities; in such areas, transportation systems meet the access and mobility needs of all interests at a cost they can afford. In rural areas, paratransit for people who can no longer drive is a critical livability element. Transportation is also vitally important to support rural economies and provide access to economic generators. Creating livable communities is also important in tribal areas, where there is great need for reliable and affordable transit. Livability issues for tribal communities include the need for school routes that are accessible year-round and transportation to hospitals and emergency medical services.
The U.S. DOT is committed to focusing on the transportation needs of people and communities wherever they live and work, their mobility needs, and their quality of life; preserving and enhancing unique community characteristics are primary goals rather than an afterthought.
Benefits of Livable Communities
While not an exhaustive list, the following section provides examples of why the U.S. DOT is making investments in livability.
Provides More Transportation Options and Integrates Land Use Planning
A key objective for the U.S. DOT is to increase transportation options for all citizens. Building a multimodal system that integrates walking, bicycling, and transit use with use of personal automobiles will provide more choices for where to live, work, and play. Integrating transportation investments with land use planning has the potential to improve the health and safety of citizens, save money, and increase travel independence for community members—including persons with disabilities, the elderly, and low-income populations.
Transportation options integrated with land use planning also tend to foster a balance of mixed uses (including housing, educational, employment, recreational, retail, and service opportunities) which recognize the importance of geographic proximity, layout, and design of those uses. Considering the long-term impacts of land use decisions on the environment and transportation demand is critical to creating livable communities and long-term economic growth. Chapter 11 provides a more detailed discussion of environmental sustainability and the transportation system.
Promotes Healthy Living
For decades, Americans have understood the link between moderate physical activity and health; however, many communities have not made the connection that robust transportation and land use planning can play an important role in promoting healthy living. The Surgeon General's Report on Physical Activity and Health in 1996 stated, "Physical activity reduces the risk of premature mortality…coronary heart disease, hypertension, colon cancer, and diabetes."1 The Surgeon General went on to recommend moderate physical activity at least five days a week, although nearly three in four Americans report that they do not get enough exercise to meet the recommended minimum.2 While it is well documented that Americans do not obtain the recommended daily amount of exercise, many communities have not facilitated increasing walking and biking by providing sidewalks and bike lanes. It is estimated that the majority of trips that an individual takes are within walking or cycling distance.
Communities that develop without proper pedestrian amenities make it difficult or undesirable for individuals to walk more in their daily lives. Studies suggest that those who report living in walkable neighborhoods take approximately two times more walking trips per week than residents living in neighborhoods with poor pedestrian walkways. This translates to nearly 30 minutes of additional walking per week.3 A 2003 study on the health effects of sprawl found that people living in more compact, walkable counties are likely to walk more and weigh less, and are less likely to suffer from hypertension than people living in more sprawling counties.4 In 2004 a study published in the Journal of Public Health was the first to examine the relationship between sprawl and a wider spectrum of chronic illnesses.5
Another study looked at how walking or bicycling to work impacted the weight of middle-aged men and found that it was associated with a lower weight regardless of additional exercise.6 The U.S. Centers for Disease Control and Prevention note that 42 percent of children walked or biked to school in 1969; that percentage dropped to 16 percent by 2001. Of children who lived within a mile of school in 2001, only 25 percent walked or biked to school, down from nearly 90 percent of those who lived that close to school in 1969. This may have serious implications for the rising trend in childhood obesity.7 Research has also shown that increased access to public transit may help promote and maintain active lifestyles. A study published in the American Journal of Preventive Medicine analyzed transit trips from the National Household Travel Survey (NHTS) and found that the average transit user walks for 24.3 minutes in conjunction with their transit trip. Those who use transit walked, on average, 30 percent more and were four times more likely to walk 10,000 steps in a day—the recommended daily amount for a healthy lifestyle—than car commuters. Researchers also found that nearly one-third of transit riders achieved 30 minutes of physical activity a day solely by walking to and from transit. With both minorities and low-income populations reporting some of the highest levels of obesity, the benefits of walking to transit can assist in attaining recommended daily physical activity levels.8
|
U.S. DOT's Livability Initiative The U.S. DOT's Livability Initiative enables communities across the Nation to grow in ways that ensure a better quality of life while enhancing their economic and social wellbeing. Under U.S. DOT's Livability Initiative, the intent is to enable communities to:
To achieve the Livable Communities agenda, U.S. DOT plans to:
|
While more research needs to be completed and it is difficult to demonstrate the causes of increased activity, there is a growing consensus that multimodal transportation could promote increased physical activity.9 The aforementioned studies corroborate that the attributes of where a person lives are correlated with activity levels and that a person's activity level has an impact on health.
Improves Pedestrian Safety
Increased transportation options coupled with more effective land use planning also has important implications for the safety of residents in a community. According to the 2009 National Household Travel Survey, about 12 percent of all trips are made by walking and bicycling10, a noted increase from the recent past. Pedestrian and cyclist fatality rates reflect this, accounting for about 13 percent of roadway fatalities.11In a 2003 report, Promoting Safe Walking and Cycling to Improve Public Health: Lessons from the Netherlands and Germany, researchers examined the public health consequences of poorly planned and inconvenient walking and bicycling conditions in the United States and provided policy recommendations. Their results suggest a correlation between a lack of comprehensive planning on the one hand and fatalities or injuries of pedestrians and cyclists on the other. Per kilometer and per trip walked, American pedestrians are 3 times more likely to be killed than German pedestrians and 6 times more likely to be killed than Dutch pedestrians. Similarly, American bicyclists are twice as likely to be fatally injured as German cyclists and over 3 times as likely as Dutch cyclists.12
Fortunately, there is something that can be done to improve conditions for pedestrians and decrease the particularly high fatality and injury rates seen in the United States. Part of the answer comes from policies such as Complete Streets, a program that provides facilities for all potential road users. Fatalities and injuries decline as bike and pedestrian use becomes an integrated part of the community. This is supported by the "National Biking and Walking Study: a 15-year Status Report," a recent report that found that, from 1990 to 2009, reported walking trips increased from 18 billion to 42.5 billion and reported biking trips rose from 1.7 billion to 4 billion; however, as overall reported trips increased, the number of pedestrians killed decreased by 22.3 percent and the number of bicyclists killed decreased by 12 percent.13 Since the reported number of trips taken on foot or on bike has more than doubled in the same period, the decreased fatality rates would suggest that efforts to improve pedestrian safety over this period have been effective.
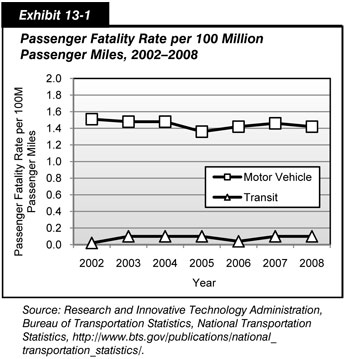
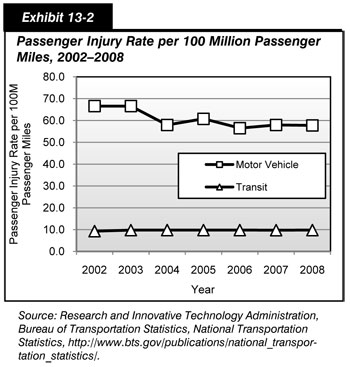
Increasing the mode share of public transit trips also provides citizens with a very safe alternative. Exhibits 13-1 and 13-2 highlight the differences in fatality and injury rates for individuals in personal automobiles and for those who take public transit. Exhibit 13-1 presents passenger fatality rates per 100 million passenger miles and Exhibit 13-2 describes the difference in injury rates between the two modes per 100 million passenger miles traveled. One can see that, on both accounts, public transit experiences far fewer fatality and injury rates per 100 million passenger miles traveled.14
Incentivizes Local Business Investment
There is a growing amount of literature that suggests public transit can play a key role in incentivizing developers to invest in properties to make a more livable community. Many developers are increasingly viewing transit as a desirable amenity that can improve the marketability of new residential units, office space, and other property types.15 The introduction of transit can also make new sites available for development. A paper written by the Center for Transit Oriented Development states, "In some cases, the improved access provided by transit can make it possible to develop or redevelop sites where expected traffic impacts previously precluded development of more intensive uses."16 Transit can also help communities improve the financial feasibility of a development because developers can command higher sales prices for projects they build.
Recent examples of this type of increased development can be seen on the Hiawatha Line in the Twin Cities region of Minnesota, the Southeast Corridor in the Denver region of Colorado, and the Blue Line in the Charlotte region of North Carolina. All three transit lines experienced a remarkable amount of new development. Each of the corridors attained more than 7.5 million square feet of new development, with Charlotte achieving approximately 10.4 million square feet. Development was often mixed among residential, commercial, and employment centers, providing a community with a multitude of options.17 It should be noted that there are many different reasons why these developments have been successful. In fact, planners suggest that one of the reasons Charlotte was so successful was because it was centered on a walkable street grid.
Brownfield reuse can play a key role in incentivizing business investment. As discussed in Chapter 11, brownfields are abandoned industrial properties. Based on the previous use, potential contaminants could remain and must be removed before reuse of the property is possible. The EPA Brownfields program encourages redevelopment and reuse of land for the benefit of the community. The program has been expanded recently, with the EPA/U.S. DOT/HUD Interagency Partnership for Sustainable Communities (see the Introduction to Part III). The agencies have selected five brownfields where there is a convergence of public transit accessibility and the need for affordable housing. Cleaning and reusing this land and providing new housing choices will create jobs and new economic opportunities. The five sites are the Fairmount Line in Boston; the Smart Growth Redevelopment District in Indianapolis; the La Alma/South Lincoln Park neighborhood in Denver; the Riverfront Crossings District in Iowa City, Iowa; and the Westside Affordable Housing Transit-Oriented Development in National City, California.
Lowers Household Transportation Costs
As mentioned previously, the average American household spends $8,758 per year to buy, maintain, and operate personal automobiles.18 Providing more transportation options can potentially save the average American family thousands of dollars a year.19
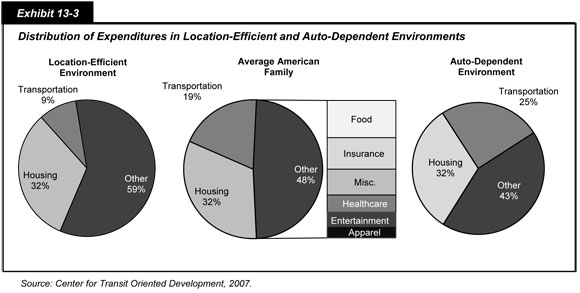
A vital component of this discussion is location. Exhibit 13-3 shows that an average household with access to transit spends just 9 percent of its household budget on transportation costs. Location efficiency, or living in a community with a multitude of options, is particularly relevant for very-low-income households; household transportation costs can sometimes consume 55 percent of the budget in very-low-income communities without access to transit.20
The Center for Neighborhood Technology (CNT) "Housing and Transportation Affordability Index" scores 337 U.S. metropolitan regions and illustrates how the growth of urban regions has increased the average costs of living for the average family. A comparison of index values across regions suggests that a community's location and design are more effective predictors of overall affordability than household size and income. CNT reports, "Compact, walkable, mixed-use communities may initially appear expensive because of higher housing costs but these places can often be more affordable than less dense suburban communities because households can own few cars…"21 In fact, household savings from residing in compact neighborhoods rather than less-dense communities can range from $1,580 per year in Little Rock to $3,850 in Boston.22 Though more research needs to be done, there is a growing consensus that cost mitigation can be achieved by promoting the development of communities that make it possible to get to jobs, schools, and shopping on foot or by bike, bus, or train.
As economies develop in rural areas, focusing development in town and commercial centers can increase access to necessities and enable one-stop shopping for many residents, thus reducing fuel costs and time on the road and enhancing a sense of community.
Saves Community Infrastructure Costs
Finally, the economic benefits of livable communities can be realized by the community as it saves in infrastructure costs. Depending on the community, savings can be realized from land conservation and the reduced need for such services as: water and sewage infrastructure, local road infrastructure, local public service costs, and real estate development costs.
CNT has projected regional cost savings in specific communities around the country if 50 percent of the region's new households through 2030 were built in more compact, rather than dispersed, neighborhood designs. In smaller regions like Charlotte, which is expected to nearly double in population—cost savings are estimated at $239.8 million a year. San Francisco could realize savings of $1.1 billion and Phoenix, $2.1 billion, just by changing the way the communities grow. Similarly, Salt Lake City's Quality Growth Strategy focuses on compact, mixed-use development and is predicted to save the region $4.5 billion in infrastructure costs, preserve hundreds of miles of undeveloped land, double the transit trips taken, and increase residency near rail transit by over 20 percent. Exhibit 13-4 illustrates the economic benefits of location efficiency for selected communities.
| MPO Region | Sample Dispersed Neighborhood1 | Sample Compact Neighborhood1 | Difference in Annual Household Transportation Costs2 | Difference in Annual Regional Transportation Costs (Millions)3 |
|---|---|---|---|---|
| Austin, TX | Round Rock | Old West Austin | $2,310 | $716.0 |
| Boston, MA | Braintree | Somerville | $3,850 | $613.5 |
| Charlotte, NC | Sterling | Dilworth | $1,700 | $239.8 |
| Chicago. IL | Schaumburg | Oak Park | $3,110 | $1,110.2 |
| Cincinnati, OH | Milford | CUF Neighborhood | $3,050 | $236.3 |
| Denver, CO | Arvada | Washington Park | $2,240 | $661.3 |
| Little Rock, AR | Sherwood | Pulaski Heights | $1,580 | $79.9 |
| Minneapolis, MN | Orono | Seward | $1,830 | $345.1 |
| Newark, NJ | Butler | Montclair | $2,300 | $550.8 |
| Phoenix, AZ | Gilbert | Encanto | $3,610 | $2,144.3 |
| Portland, OR | Troutdale | Roseway | $2,230 | $492.2 |
| San Francisco, CA | Antioch | Rockridge | $2,780 | $1,126.8 |
2 Household savings of the representative compact community over the representative dispersed community.
3 Regional savings if 50% of projected household growth through 2030 as listed on the MPO website had the H+T savings of the compact over the dispersed community.
During the period of 2000 to 2025, significant savings in community costs could be achieved if Smart Growth and livability principles are applied. It is estimated that local governments will expend more than $190 billion to provide water and sewer infrastructure under traditional development practices. Employing livability principles, up to 150 million gallons of water and sewer demand could be saved, which would add up to $12.6 billion over the 25-year period. Similarly, $110 billion in road infrastructure costs and $4 billion in public service costs could be saved.23 Other research shows that Smart Growth can provide direct savings to the public in the form of reduced infrastructure costs of anywhere from $270 to $4,000 per dwelling unit. Taking into account incremental operations, maintenance, and service costs, estimates of public savings range from $500 to almost $10,000 annually per unit.24
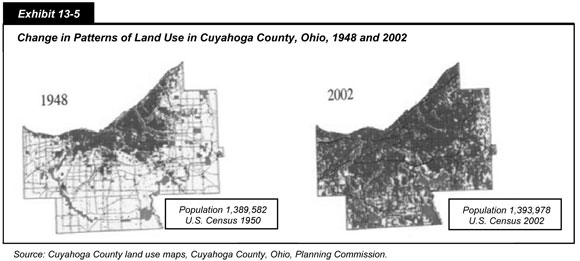
Exhibit 13-5 illustrates these concepts. Cuyahoga County has experienced very minimal changes in its population over the past 50 years, yet the land use map shows the clear impact of modern day policies. The rate of land conversion to urban uses is due more to modern settlement patterns than population growth. According to the U.S. Department of Agriculture's National Resources Inventory, developed land in the contiguous United States increased 34 percent between 1982 and 1997. During the same 15-year period, population grew by about 15 percent; meaning land consumption occurred at more than twice the rate of population growth.25
|
Minneapolis Pedestrian and Bicycle Case Study The Minneapolis-St. Paul seven-county area has annually invested in pedestrian and bicycle facilities and programs using Federal funds. These investments help implement projects consistent with local comprehensive plans and regional system plans and policies. From 1991 to 2004, the area invested more than $76 million in freestanding pedestrian and/or bicycle infrastructure.1 In 2005, Minneapolis and adjacent communities became one of four pilot sites for a Nonmotorized Transportation Pilot Program (NTPP), established by Congress, to demonstrate the extent to which bicycling and walking could carry a significant part of the transportation load.2 Implementation of the Minneapolis pilot NTPP projects began in 2007, covering three categories: planning, operations, and infrastructure. These projects included 18 on-street operations projects, three planning projects, and six infrastructure projects such as bicycle parking in Minneapolis, a travel connection between high-traffic destinations, a bicycle boulevard as an alternative to heavy arterials, and a bicycle and pedestrian plan for the city of Minneapolis.3/4 By the end of 2010, 37 projects are anticipated to be completed, including 75 miles of on- and off-street facilities, a bike station, and a bike library and sharing program.5 Bicycle magazine and census data suggest that the Minneapolis area's investment in walkway and bikeway facilities has helped produce one of the Nation's leading bicycle commuting populations. In spring 2010, Bicycle magazine named Minneapolis the number one bike-friendly U.S. city, highlighting the existing bicycle culture and new funding from the NTPP program.6 The American Community Survey reports the number of people using bikes to commute to work in Minneapolis increased from 4,835 in 2006, to 8,164 in 2008 (a 68 percent increase), or an increase in mode share from 2.5 percent in 2006 to 4.3 percent in 2008.7 Monthly bicycling and walking monitoring indicates seasonal resilience, with 68 percent of walkers continuing to walk and 20 percent of bikers continuing to bike on the worst winter day.8 1 Metropolitan Council, [Minnesota's] 2030 Transportation Policy Plan, Publication no. 35-04-055, 2004. 2 DOT – FHWA, Interim Report to the U.S. Congress on the Nonmotorized Transportation Pilot Program SAFETEA-LU Section 1807, 2007, https://www.fhwa.dot.gov/environment/bikeped/ntpp/index.cfm, accessed July 20, 2010. 3 Ibid. 4 DOT – FHWA, Nonmotorized Transportation Pilot Program Midterm Report, 2009, https://www.fhwa.dot.gov/environment/bikeped/ntpp/midtermrpt09.cfm, accessed July 28, 2010. 5 Bike Walk Twin Cities, http://www.bikewalktwincities.org, accessed July 27, 2010. 6 Ibid. 7 U.S. Census Bureau, American Community Survey, http://factfinder2.census.gov, 2010, accessed July 20, 2010. 8 Bike Walk Twin Cities, http://www.bikewalktwincities.org, accessed July 27, 2010. |
While this is by no means an exhaustive list of all the benefits that can be seen from investing in livable communities, this brief discussion highlights some of the reasons that the U.S. DOT is making livability a priority.
Performance Indices
Measuring the impact of transportation investments on improving community livability is a multidisciplinary effort influenced by the interaction between transportation, land use, economic, social, and environmental systems. The HUD/DOT/EPA Interagency Partnership for Sustainable Communities is working to develop recommended performance measures, as discussed in more detail in the Introduction to Part III of this report.
Livability Performance Measures
Communities across the United States have begun tracking the implementation process and accessibility outcomes of livability investments that expand transportation options. Exhibit 13-6 provides a list of potential performance measures related to livability that focus on the specific outcomes and strategies seen in the Partnership for Sustainable Communities guiding principles. The measures discussed in this section are ideas for how to measure livability and have not been adopted by the U.S. DOT as official performance measures. As the livability initiative matures, the performance measures will evolve and be refined.
| Increased Transportation Options |
| Change in vehicle miles traveled per capita |
| Increase in transit, walk, bike share of trips1 |
| Equitable Affordable Housing |
| Decrease in household transportation costs |
| Percent of low income households within a 30-minute commute of major employment centers |
| Increase in affordable homes and rental units within or near key activity centers (which include fixed guideway transit stations or "well served transit stops") |
| Economic Competitiveness |
| Reduced average per capita public cost for infrastructure |
| Percent of employment within walking distance of transit, and/or key destinations |
| Value Communities |
| Decrease in transportation related emissions per capita2 |
| Decline in non-occupant injury/fatality rate |
| Increase in the number of homes with walkable access to retail, services, parks, and transit |
Urban Region – Fixed guideway transit station or "well served transit stop" = Small Starts operational requirements of at least 10-minute headways during peak hours and 15-minute headways during off peak hours, with operations for at least 14 hours daily.
Rural County – Town center (area within the boundary of an existing Census Designated Place or other area specifically designated as a town center)
Two key thresholds defining convenient access:
Within = walking distance (one-quarter to half mile)
Near = short driving distance (one to two miles)
2 CO2, PM NOx VOC emissions.
Some of the measures directly capture broad outcomes such as reduced air pollution and lower household transportation costs, while others are indicators indirectly measuring progress toward such outcomes. Additionally, given the central importance of improved connections between development and transportation, several measures track implementation of strategies such as increased development near transit or more walkable neighborhoods. This includes improved connection to equitable affordable housing in proximity to transit.
|
U.S. DOT Performance Measurement Fostering livable communities is one of the U.S. DOT's strategic planning goals. As work continues to develop comprehensive measures of livability and obtain the data required to track these measures, the U.S. DOT has identified some initial livability measures based on currently available data. Some of the livability performance measures included in the President's FY 2012 Budget were:
|
While some of the measures in Exhibit 13-6 can apply to rural areas, others have more of an urban focus. This is because livability may be different across the range of urban, rural, suburban, and tribal communities across the country. No two areas are alike, and each may choose different kinds of transportation investments that best fit its needs. However, these measures provide a useful framework for tracking progress at a high level and can be generalized to address many diverse contexts.
Interim Measures
One of the major challenges in measuring progress in improving livability is the current lack of consistent national-level data. For example, it would be useful to track the number of miles of bicycle trails, urban bicycle lanes, and sidewalks over time. However, while these types of data are collected by some jurisdictions, there are currently no reliable national-level statistics available.
As work continues in establishing a consensus around recommended performance measures, and data systems are developed to track these measures, it is necessary in some cases to rely on indirect measures of livability. For example, current data limitations preclude directly tracking changes in the number of miles of accessible sidewalks. However, an alternative approach would be to track the number of States that developed an Americans with Disabilities Act (ADA) transition plan that is current and provides a schedule and time period for achieving compliance for pedestrian accessibility in the public rights-of-way. While this indirect measure would not fully capture national progress, it would represent a more feasible interim method for starting to track performance in this area.
|
Walking and Bicycling Performance Measures It is difficult to set national performance measures for nonmotorized transportation issues. In the 1994 National Bicycling and Walking Study, the U.S. Department of Transportation established two national goals related to walking and bicycling—to double the percentage of total trips made by bicycling and walking in the United States from 7.9 percent to 15.8 percent of all travel trips and to simultaneously reduce by 10 percent the number of bicyclists and pedestrians killed or injured in traffic crashes. Since 1994, the FHWA has provided 5-year updates on progress toward achieving these goals. (The 5-, 10-, and 15-year status reports can be accessed at https://www.fhwa.dot.gov/environment/bikeped/publications.cfm). Walking and bicycling trips are reported in the periodic National Household Travel Survey (conducted every 5 to 8 years), while the Fatality Analysis Reporting System from the National Traffic Safety Administration reports crash data annually. There are currently few alternatives to these two national performance measures. There are no national estimates of walking and bicycling infrastructure (e.g., miles of sidewalks or miles of shared use paths or bicycle lanes). In fact, many communities lack these data at the local level as well. Federal, State, and local transportation agencies are recognizing the importance of identifying ways to monitor multimodal transportation networks and usage. Several FHWA and National Cooperative Highway Research Program (NCHRP) projects will help develop improved measures related to nonmotorized transportation. Examples of NCHRP projects can be found at
In the future, it should be easier to report new performance measures related to walking and bicycling, but for the moment trip rates and crash data, which will both remain important measures, are the state of the art. |
Endnotes
1 U.S. Department of Health and Human Services, Physical Activity and Health: A Report of the Surgeon General, 1996.
2 M. Pratt, C.A. Macera, and C. Blanton, Levels of physical activity and inactivity in children and adults in the United States: Current Evidence and Research Issues, Medicine and Science in Sports & Exercise, 1999, 31(11): S526-S533.
3 B. Saelens, et al., Environmental Correlates of Walking and Cycling: Findings from the Transportation, Urban Design, and Planning Literatures, 2004, http://www.rafapana.org/curso_agitamundo/arquivos/090513_archivo19.pdf.
4 Surface Transportation Policy Project, Measuring the Health Effects of Sprawl A National Analysis of Physical Activity, Obesity and Chronic Disease, Smart Growth America, September 2003.
5 R. Lopez, Urban Sprawl and Risk of Being Overweight or Obese, American Journal of Public Health, v 94, n. 9: 1574-1579.
6 A. Wagner, C. Simon, P. Ducimetiere, et al., Leisure-time physical activity and regular walking or cycling to work are associated with adiposity and 5 y weight gain in middle-aged men: The PRIME study, International Journal of Obesity and Related Metabolic Disorders, 2001, 25: 940-948.
7 Ashley Cooper, Angie Page, Lucy Foster, and Dina Qahwaji, "Commuting to school: Are children who walk more physically active?" American Journal of Preventive Medicine, 2003, 25.4(2003): 273-276.
8 L. Bessar and A. Dannenberg, Walking to Public Transit: Steps to help meet physical activity recommendations. American Journal of Preventative Medicine, 2005, 29(4): 273-80.
9 LD Frank et al., Stepping towards causation: Do built environments or neighborhood travel preferences explain physical activity, driving and obesity, Social Science and Medicine, Nov 2007, 65(9): 1898-1914.
10 Federal Highway Administration, The National Bicycling and Walking Study: 15-Year Status Report, http://www.walkinginfo.org/15_year_report/.
11 B.J. Campbell, et al., A Review of Pedestrian Safety Research in the United States and Abroad, Federal Highway Administration Publication # FHWA-RD-03-042, 2004.
12 J. Pucher and L. Dijkstra, Promoting Safe Walking and Cycling to Improve Public Health: Lessons from The Netherlands and Germany, American Journal of Public Health, 2003, 93: 1509-1516.
13 The National Bicycling and Walking Study: 15-Year Status Report.
14 Research and Innovative Technology Administration, Bureau of Transportation Statistics, National Transportation Statistics, http://www.bts.gov/publications/national_transportation_statistics/ Federal Transit Administration, National Transit Database. 2008 injury number is estimate.
15 Center for Transit Oriented Development, Capturing the Value of Transit, 2008.
16 Ibid.
17 Center for Transit Oriented Development, Rails to Real Estate: Development Patterns Along Three Recently Constructed Transit Line, 2010.
18 Consumer Expenditures in 2007, (April 2009) Bureau of Labor Statistics, www.bls.gov/cex/csxann07.pdf
19 American Public Transportation Association. Riding Public Transit Saves Individuals Annually, http://www.publictransportation.org/tools/transitsavings/Pages/default.aspx.
20 Reconnecting America's Center for Transit Oriented Development, Realizing the Potential: Expanding Housing Opportunities Near Transit, 2007.
21 Center for Neighborhood Technology, Penny Wise and Pound Fuelish: New Measures of Housing and Transportation Affordability, February 2010,http://www.cnt.org/repository/pwpf.pdf
22 Ibid.
23 Bruchell et al., Transportation Cooperative Research Program Report 74, Costs of Sprawl – 2000, http://onlinepubs.trb.org/onlinepubs/tcrp/tcrp_rpt_74-a.pdf.
24 T. Litman, Understanding Smart Growth Savings: What We Know About Public Infrastructure and Service Cost Savings, and How They are Misrepresented by Critics (June 2010), http://www.vtpi.org/sg_save.pdf.
25 Natural Resources Conservation Service, United States Department of Agriculture, National Resources Inventory, http://www.nrcs.usda.gov/wps/portal/nrcs/detail/national/technical/nra/?&cid=nrcs143_014196.
To view PDF files, you need the Acrobat® Reader®.