Chapter Overviews
Part I
Description of Current System
Part I of this report summarizes the current state of highways, bridges and transit systems, based primarily on data through the year 2010 unless otherwise noted. Chapter 1 discusses trends in personal travel, drawing upon the 2009 National Household Travel Survey, and presents data and issues relating to highway freight movement. Chapter 2 describes the characteristics of the highway, bridge, and transit systems, and Chapter 6 provides data on the revenue collected and expended for highways and transit.
U.S. Department of Transportation (DOT) Strategic Plan, FY 2012–16
The latest U.S. DOT Strategic Plan presents five strategic goals for America’s transportation system:
- Safety – Improve public health and safety by reducing transportation-related fatalities and injuries.
- State of Good Repair – Ensure that the United States proactively maintains its critical transportation infrastructure in a state of good repair.
- Economic Competitiveness – Promote transportation policies and investments that bring lasting and equitable economic benefits to the Nation and its citizens.
- Livable Communities – Foster livable communities through place-based policies and investments that increase the transportation choices and access to transportation services.
- Environmental Sustainability – Advance environmentally sustainable policies and investments that reduce carbon and other harmful emissions from transportation sources.
Chapter 3 addresses issues relating to the State of Good Repair goal, presenting data on the physical conditions of highways, bridges, transit systems, and transit vehicles. Chapter 4 addresses issues pertaining to the Safety goal. Chapter 5 covers topics relating to the goals for Livable Communities, Environmental Sustainability, and Economic Competitiveness.
Performance Management
Transportation Performance Management is a strategic approach that uses system information to make investment and policy decisions to achieve national performance goals. A typical performance management process would include the following elements: (1) establish a set of goals/objectives; (2) define measures that support achievement of the goal or objective; (3) establish specific future targets for the measures; (4) develop specific plans, budgets, and programs to achieve the target outcome; and (5) after the programs are implemented, assess their results against the desired target. Any discrepancy between the planned and actual outcomes can be addressed by altering strategies. Performance management is a continual improvement process.
In July 2012, the Moving Ahead for Progress into the 21st Century Act (MAP-21) introduced specific requirements for performance management for highway and transit investments, establishing national goals for safety, infrastructure condition, congestion reduction, system reliability, freight movement and economic activity, environmental sustainability, and reduced project delivery time.
Federal Agencies are required to define the measures and standards for achieving the goals identified, unless defined in MAP-21. The States are to determine their own targets, while minimum standards may be established by Federal agencies where appropriate. States are to report progress toward the targets established. Failure to meet targets or develop plans has specific penalties for States: reduction in funding or requirements to spend more on the specific goal area. States are to report progress toward the targets within 4 years of enactment of MAP-21, and biennially thereafter.
Transit agencies that receive FTA grant funds are similarly required to maintain asset management plans, to set goals for achieving a state of good repair, and to report asset inventory condition data to FTA along with metrics demonstrating their progress toward meeting their goals.
Chapter 1
Household Travel
To fully understand daily travel, one must look at it through the lens of the 300 million Americans who use the transportation system to connect to jobs, stores, schools, friends, relatives, healthcare, recreational places, and more. The National Household Travel Survey (NHTS) is the only national source of travel data that connects daily travel behavior with the characteristics of the household and the individual making the trip.
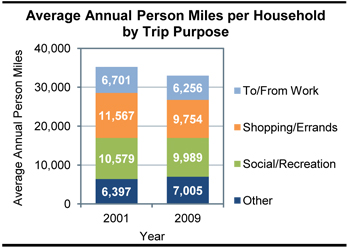
The NHTS data reflect daily travel behavior of the American public, and do not include freight movement or commercial driving. Americans drove 30 billion fewer vehicle miles in 2008-2009 than in the 2001-2002 NHTS survey period despite a nearly 10 percent population increase over that time. There are many factors that could be causing this decline, including: the recession, high gas prices during the summer of 2008, changing demographics (e.g., the aging of the population and smaller household sizes) changing lifestyles of Americans (e.g., the increases in telecommuting and cyber shopping or different travel preferences), an increase in the availability of quality transit service and other alternatives to driving, or roadway congestion. The NHTS results also show that transit ridership increased by 16 percent between the two survey periods; most of the increase was in the shopping and social/recreational activities categories. For all modes of travel combined, average daily person miles of travel per household dropped from 96.6 to 90.4.
By 2050, about one in four members of the U.S. population will be over the age of 65. Maintaining the mobility of this group is a major quality of life issue. This group is increasing in average age over time, which may explain the recent decreases in their per capita trips and miles traveled.
Like the population as a whole, the household vehicle fleet is also aging, with the average age of household vehicles now reaching an all-time high of 9.4 years. Because more than half of the household vehicles are now older than 9 years, recent automotive advances in energy efficiency, air quality, and safety are not fully represented in the vehicles on the road.
| Model Years | Percent of Total |
|---|---|
| ≤1 Year | 5.7% |
| 2-5 Years | 28.6% |
| 6-10 Years | 32.2% |
| 11-20 Years | 26.9% |
| >20 Years | 6.7% |
Much attention has been given to changes in the travel behavior of the Millennial generation, generally defined as those born between 1982 and 2000. The NHTS results indicate that youth travel is declining as they are driving less, traveling less, and taking shorter trips compared with previous generations. Recent research has identified several contributing factors to this trend, including:
- Technology influences travel and how youth get their information.
- Youth concerns for the environment play a role in their travel decisions.
- More youth prefer to live in high-density areas where there are more modal options and shorter trip lengths.
- High unemployment and personal income constraints limit resources for travel and cause youth to live with parents longer.
- Increases in driver’s licensing restrictions have resulted in more youth waiting longer to get their license.
Chapter 1
Freight Movement
The freight transportation system plays a major role in promoting and sustaining the economic vitality of the United States. Various businesses, ranging from companies that mine raw materials that are used to manufacture goods to retail companies selling household goods or office products, rely on the U.S. freight transportation system to have their products picked-up and/or delivered.
Though the system includes a variety of transportation modes (highway, railroad, waterway, aviation, and pipeline), some of which are publicly owned and others of which are privately owned, most of the system has a high degree of connectivity. This allows freight carriers to operate more efficiently and shippers to use the most economically effective mode or modes for shipping their goods.
The well-developed transportation system currently handles over 50 million tons of freight each day, with over two-thirds of that amount being carried by trucks. This high volume of freight movement, which has grown steadily over the last few decades due to the ease of transport in the United States and an increase in interregional domestic and international trade, is putting increasing stress on the transportation system. Freight volumes are expected to continue to increase across all modes in the coming years, challenging the transportation system even more.
Based on projections from the FHWA Freight Analysis Framework, combined tonnage for all freight modes is projected to increase by 1.4 percent per year over the next 30 years to 27.4 billion in 2040. The weight of shipments carried by trucks is projected to increase by 1.3 percent per year during this period, rising from 12.5 billion tons to 18.5 billion tons.
Though trucking typically is considered a faster mode and handles a large volume (87 percent) of high-value, time-sensitive goods, it also hands a surprising share (71 percent) of lower-value bulk tonnage. This share includes movement of agricultural products from farms, local distribution of gasoline, and pickup of municipal solid waste.
| Mode | 2010 | 2040 Projected | Average Annual Growth, 2010–2040 |
|---|---|---|---|
| Truck | 12,490 | 18,503 | 1.3% |
| Rail | 1,776 | 2,353 | 0.9% |
| Water | 860 | 1,263 | 1.3% |
| Air, Air & Truck* | 12 | 43 | 4.4% |
| Multiple Modes & Mail | 1,380 | 2,991 | 2.6% |
| Pipeline | 1,494 | 1,818 | 0.7% |
| Other & Unknown | 302 | 514 | 1.8% |
| Total | 18,313 | 27,484 | 1.4% |
The growth in freight shipments will make it more difficult for freight carriers to continue to operate efficiently, particularly if capacity expansions and/or operational improvements are not implemented on major freight corridors and at major freight nodes. In turn, decreased operational efficiency would increase transportation costs, negatively impacting carriers, shippers, and ultimately consumers.
The increased focus on freight transportation needs in the Moving Ahead for Progress in the 21st Century (MAP-21) surface transportation reauthorization legislation should help address the growing freight needs in the United States. By designating a national freight network, requiring the formulation of a national freight strategic plan, and refining transportation investment and planning tools to evaluate freight projects, among other requirements, freight transportation needs should become more easily identifiable, and transportation funding decisions should become more strategic in nature. These legislative changes will likely help enhance the U.S. freight transportation system in the long term.
Chapter 2
System Characteristics: Highways and Bridges
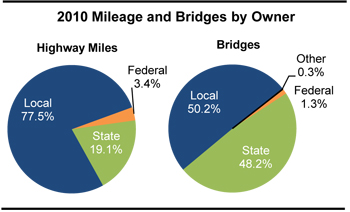
Spanning more than 4.08 million miles and including 604,493 bridges, the Nation’s public road network facilitated slightly less than three trillion VMT in 2010. Local governments owned 77.5 percent of the Nation’s public road mileage and 50.2 percent of the Nation’s bridges in 2010; States owned 19.1 percent of mileage and 48.2 percent of bridges; the Federal government owned 3.4 percent of mileage and 1.3 percent of bridges.
As of 2010, the National Highway System (NHS) included 162,876 miles of the Nation’s key corridors (4.0 percent of total mileage) which carried 43.0 percent of VMT. The revised NHS criteria in MAP-21 will add to the NHS most of the principal arterial mileage that is not currently part of the system. If all principal arterial mileage were added, this would cover 5.5 percent of the Nation’s route miles and 55.2 percent of VMT. (This estimate of the extent of the enhanced NHS is used in Chapters 7 and 8 in developing 20-year NHS investment/performance projections.)
MAP-21 requires the creation and definition of a new National Freight Network, which is intended to include the most important urban, rural, and intercity routes for commercial truck movements. This network will include a Primary Freight Network of up to 27,000 miles to be designated by the U.S. DOT, other Interstate highways not included in the Primary Freight Network, and Critical Rural Freight Corridors to be designated by the States.
Rural mileage (in areas with population less than 5,000) decreased an at an average annual rate of 0.4 percent between 2000 and 2010, in part due to the expansion of urban area boundaries following the 2000 Census. Urban mileage increased at a rate of 2.5 percent annually during this period.
Roads are functionally classified based on the purpose they serve in terms of providing mobility and access. Almost half of the Nation’s road mileage is classified as rural local, but these roads carry only 4.5 percent of VMT.
| Functional System | Miles | VMT | Bridges |
|---|---|---|---|
| Rural Areas | |||
| Interstate | 0.7% | 8.2% | 4.2% |
| Other Freeway and Expressway | 0.1% | 0.6% | |
| Other Principal Arterial | 2.2% | 6.8% | 6.0% |
| Minor Arterial | 3.3% | 5.1% | 6.5% |
| Major Collector | 10.2% | 6.0% | 15.4% |
| Minor Collector | 6.4% | 1.8% | 7.9% |
| Local | 49.7% | 4.5% | 34.0% |
| Subtotal Rural | 72.7% | 32.9% | 73.9% |
| Urban Areas | |||
| Interstate | 0.4% | 16.0% | 5.0% |
| Other Freeway and Expressway | 0.3% | 6.7% | 3.3% |
| Other Principal Arterial | 1.6% | 15.5% | 4.5% |
| Minor Arterial | 2.6% | 13.0% | 4.6% |
| Major Collector | 2.8% | 6.1% | 3.4% |
| Minor Collector | 0.0% | 0.1% | |
| Local | 19.6% | 9.7% | 5.3% |
| Subtotal Urban | 27.3% | 67.1% | 26.1% |
| Total | 100.0% | 100.0% | 100.0% |
The term “Federal-aid Highways” refers to the subset of the road network that is generally eligible for Federal funding assistance under most programs; this excludes roads functionally classified as rural minor collector, rural local or urban local. Federal-aid highways make up 24.7 percent of the nation’s mileage, but carry 84.6 percent of VMT.
Chapter 2
System Characteristics: Transit
Between 2000 and 2010, transit system coverage, capacity, and use in the United States all experienced steady growth. In 2010, there were 728 agencies (709 public agencies) in urbanized areas required to submit data to the National Transit Database (NTD). All but 148 of these agencies operated more than one mode. There were also 1,582 rural transit operators that reported. Urban reporters operated 612 motor bus systems, 587 demand response systems, 18 heavy rail systems, 30 commuter rail systems, and 33 light rail systems. There were also 70 transit vanpool systems, 20 ferryboat systems, 5 trolleybus systems, 3 automated guideway systems, 3 inclined plane systems, and 1 cable car system.
U.S. transit systems operated 74,319 motor buses, 33,458 vans, 11,434 heavy rail vehicles, 7,072 commuter rail cars, and 2,118 light rail cars. Transit providers operated 12,438 miles of track and served 3,175 stations. Almost all transit providers are included in these counts, excepting those that do not receive FTA grant funds and choose not to report to NTD.
Motor bus and heavy rail modes continue to be the largest segments of the industry, providing 51.6 percent and 35.6 percent of all transit trips, respectively. Commuter rail, with 4.6 percent of trips, supports a relatively high share of passenger miles (20.0 percent) due to its greater average trip length (23.4 miles compared with 4.0 for bus, 4.6 for heavy rail, and 4.8 for light rail). Light rail is the fastest-growing rail mode (with passenger miles traveled [PMT] growing at 5.0 percent per year between 2000 and 2010) but still provided only 4.1 percent of transit PMT in 2010. Vanpool growth during that period was 10.3 percent per year, substantially outpacing the 0.9-percent growth in motor bus passenger miles; however, while motor buses provided 39.1 percent of all PMT, vanpools accounted for only 2.1 percent.
Transit systems are concentrated in the 42 urbanized areas with populations of more than 1 million people. These areas contain about half of the U.S. population, but their higher population densities and long-term investments in transit infrastructure support 89 percent of all transit trips on 77 percent of the vehicle revenue miles.
Rural transit operators reported 123.2 million unlinked passenger trips on 570 million vehicle revenue miles. This included 61 Indian tribes that provided 1,008,701 unlinked passenger trips. Rural systems provide both traditional fixed-route and demand response services. In 2010, there were 1,180 demand response systems, including 30 systems added since 2008, and 530 motor bus systems, including 36 added since 2008. Sixteen rural systems reported vanpool operations.
Rural service is provided in every State, and 327 urbanized area agencies reported providing service to rural areas as well.
Chapter 3
System Conditions: Highways
Highway users are economically impacted by the conditions of the highways and bridges they utilize. Users are more likely to incur higher vehicle maintenance costs for travel on roads with poor pavement conditions, particularly on higher speed roads like Interstate highways. Poor pavement conditions may also increase travel time due to drivers slowing down and avoiding risks like potholes, which can also escalate the level of congestion on the Nation’s most traveled roadways.
Urban centers facilitate more than two-thirds of VMT on the Nation’s highway system. Pavement conditions in urban settings tend to deteriorate at a faster rate because of the higher usage. Replacing pavement in urban centers is also challenging because roadwork can exacerbate congestion.
The Highway Performance Monitoring System (HPMS) includes data on pavement ride quality on Federal-aid highways, which includes about one-quarter of the Nation’s mileage. Between 2000 and 2010, the percentage of rural VMT on pavements classified as having acceptable ride quality declined from 93.8 percent to 87.8 percent. However, the percent of rural VMT on pavements with good ride quality (a subset of the acceptable ride quality classification) increased from 55.2 percent to 64.6 percent. The share of urban VMT on pavements with good ride quality rose from 35.0 percent in 2000 to 44.0 percent in 2010, while the share on pavements with acceptable ride quality declined from 80.3 percent to 79.4 percent.
| Ride Quality | Calendar Year | ||
|---|---|---|---|
| 2000 | 2008 | 2010 | |
| Good (IRI < 95) | |||
| Rural | 55.2% | 62.5% | 64.6% |
| Urban | 35.0% | 38.9% | 44.0% |
| Total | 42.8% | 46.4% | 50.6% |
| Acceptable (IRI < 170) | |||
| Rural | 93.8% | 94.8% | 87.8% |
| Urban | 80.3% | 81.0% | 79.4% |
| Total | 85.5% | 85.4% | 82.0% |
The share of National Highway System (NHS) VMT on pavements with good ride quality rose from 48 percent in 2000 to 60 percent in 2010.
Bridges are another vital component for the Nation’s highway system. Two terms used to summarize bridge deficiencies are “structurally deficient” and “functionally obsolete.” Structural deficiencies are characterized by deteriorated conditions of significant bridge elements and potentially reduced load-carrying capacity, but do not necessarily imply safety concerns. Functional obsolescence is characterized by bridges not meeting current design standards, such as lane width or number of lanes, relative to the traffic volume carried by the bridge.
The percentage of NHS bridges classified as deficient decreased from 23.7 percent in 2000 to 21.4 percent in 2010. Of the 116,669 bridges on the NHS in 2010, 5.1 percent of bridges were classified as structurally deficient while 16.3 percent of bridges were classified as functionally obsolete.
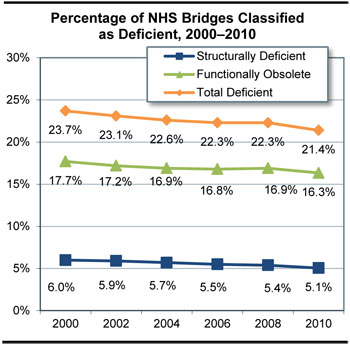
Almost 68.5 percent of the Nation’s 604,493 bridges were 26 years old or older as of 2010, up from 67.2 percent in 2000. The share of total bridges classified as structurally deficient as of 2010 was 11.5 percent, and 12.8 percent of bridges were functionally obsolete.
Chapter 3
System Conditions: Transit
This edition of the C&P report discusses levels of investment needed to achieve a “state of good repair” benchmark. The FTA uses a numerical condition rating scale ranging from 1 to 5 (detailed in Chapter 3) to describe the relative condition of transit assets as estimated by the Transit Economic Requirements Model (TERM). Assets are considered to be in a state of good repair when the physical condition of that asset is at or above a condition rating value of 2.5 (the mid-point of the marginal range). An entire transit system is considered to be in a state of good repair when all of its assets are rated at or above the 2.5 threshold rating. This report estimates the cost of replacing all assets in the national inventory that are past their useful life (that is, below the 2.5 condition rating) to be a total of $85.9 billion. This is 13 percent of the estimated total asset value of $678.9 billion for the entire U.S. transit industry.
The cost-weighted average condition rating over all bus types is at the bottom of the adequate range (3.0), slightly lower than it has been for the past decade. The full-size bus fleet shows decreases in average age and percentage of vehicles that are below the state of good repair replacement threshold. The average age of the bus fleet is now 6.1 years.
A reduction of 1.2 percent in the number of full-sized buses may indicate that older vehicles are being removed from the fleet. If so, this represents a welcome reversal of trends seen in the 2010 edition of this report. The total number of vehicles reported is up 14 percent over the last 4 years. This is driven by a 46-percent increase in the number of vans and a 42-percent increase in the number of articulated buses (extra-long buses with two connected passenger compartments) during this 4-year period.
The cost-weighted average condition rating for all rail vehicles is near the middle of the adequate range (3.5), where it has been without appreciable change for the past decade. With average conditions and ages being quite stable over the last 5 years, the most significant aspect of the rail vehicle data presented here is the steady growth in the size of the fleet, which increased at an average annual rate of 2.1 percent between 2000 and 2010. By comparison, the U.S. population increased at an average annual rate of only 0.93 percent.
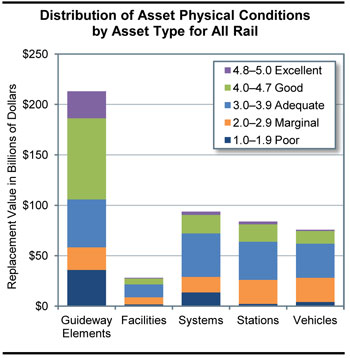
Non-vehicle transit rail assets represent the biggest challenge to achieving a state of good repair. The estimated replacement value of guideway elements (track, ties, switches, ballast, tunnels, and elevated structures) is $213.0 billion, of which $35.8 billion is for assets in poor condition (17 percent) and $22.6 billion is for assets in marginal condition. The replacement value of train systems (power, communication, and train control equipment) is estimated at $93.6 billion, of which $13.7 billion is for systems in poor condition (15 percent) and $15.3 billion is for systems in marginal condition. The relatively large proportion of guideway and systems assets that are in poor condition, and the magnitude of the $49.5-billion investment required to replace them, represents a major challenge to the rail transit industry.
Chapter 4
Safety: Highways
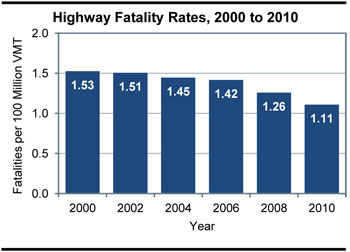
There has been considerable improvement in highway safety since Federal legislation first addressed the issue in 1966; in that year alone, 50,894 Americans lost their lives in crashes. Traffic deaths reached their highest point in 1972 with 54,589 fatalities, then declined sharply following the implementation of a national speed limit, reaching a low of 39,250 fatalities in 1992. Between 1992 and 2006, there was more limited progress in reducing the number of fatalities, and by 2006 the annual number of fatalities had risen to 42,708. The annual number of traffic deaths has subsequently declined; there were 32,885 fatalities in 2010, a record low in the post-1966 era.
The fatality rate per VMT provides a metric that allows transportation professionals to consider fatalities in terms of the additional exposure associated with driving more miles. In 1966, the fatality rate was 5.50 fatalities per 100 million VMT. By 2010, the fatality rate had declined to 1.11 per 100 million VMT. It is also worth noting that the number of fatalities decreased by 23 percent between 2006 and 2010, coinciding with the timing of the implementation of FHWA’s Highway Safety Improvement Program (HSIP).
At the same time that the overall number of fatalities dropped by more than 26 percent in 20 years (between 1990 and 2010), the overall number of traffic-related injuries also decreased by almost 35 percent (from 3.2 million to 2.1 million). Injuries increased between 1992 and 1996, but have steadily declined since then. In 1990, the injury rate was 151 per 100 million VMT; by 2010, the number had dropped by almost 53 percent to 71 per 100 million VMT.
FHWA has three focus areas related to the reduction of crashes: roadway departures, intersections, and pedestrian crashes. These three focus areas have been selected because they account for a noteworthy portion of overall fatalities and represent an opportunity to significantly impact the overall number of fatalities and serious injuries. In 2010, roadway departure, intersection, and pedestrian fatalities accounted for 52.9 percent, 20.3 percent, and 13.0 percent, respectively, of all crash fatalities.
| 2000 | 2010 | Percent Change | |
|---|---|---|---|
| Roadway Departures | 23,046 | 17,389 | -24.5% |
| Intersection-Related | 8,689 | 6,758 | -22.2% |
| Pedestrian-Related | 4,763 | 4,280 | -10.1% |
In 2010, there were 17,389 roadway departure fatalities. In some cases, the vehicle crossed the centerline and struck another vehicle, hitting it head-on or sideswiping it. In other cases, the vehicle left the roadway and struck one or more manmade or natural objects, such as utility poles, embankments, guardrails, trees, or parked vehicles.
Of the 32,885 fatalities that occurred in 2010, 6,673 occurred at intersections. Rural intersections accounted for 38.3 percent of intersection fatalities and urban accounted for 61.7 percent.
The number of pedestrian fatalities decreased 10.1 percent, from 4,763 in 2000 to 4,280 in 2010. Total nonmotorist fatalities (including pedestrians, bicyclists, etc.) decreased from 5,597 in 2000 to an 11-year low of 4,888 in 2009 before rising to 5,080 in 2010.
Chapter 4
Safety: Transit
Based on the number of fatalities and injuries reported on an annual basis, public transportation generally experiences lower rates of incident, fatality, and injury than other modes of transportation in the same year. However, serious incidents do occur, and the potential for catastrophic events remains. Several transit agencies in recent years have had major accidents that resulted in fatalities, injuries, and significant property damage. The National Transportation Safety Board (NTSB) has investigated a number of these accidents and has issued reports identifying their probable causes and the factors that contributed to them. Since 2004, the NTSB has reported on nine transit accidents that, collectively, resulted in 15 fatalities, 297 injuries, and over $30 million in property damage.
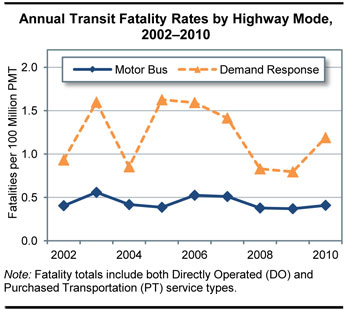
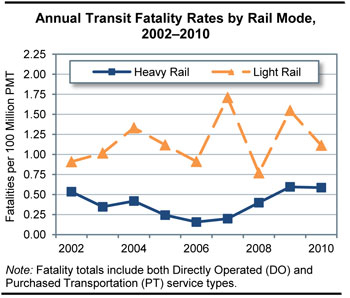
Since 2002, there has been no significant decrease in the rate of transit fatalities, excluding suicides. From 2002 to 2010, the number of fatalities has remained relatively flat while the rate per 100 million passenger miles has declined slightly due to increasing ridership. Unlike other modes, such as highway travel, public transportation has not achieved a consistent decrease in fatalities.
Transit interaction with pedestrians, cyclists, and motorists at rail grade crossings, pedestrian crosswalks, and intersections largely drives overall transit safety performance. The majority of fatalities and injuries in public transportation result from interaction with the public on busy city streets, from suicides, and from trespassing on transit right-of-way and facilities. Pedestrian fatalities accounted for 29 percent of all transit fatalities in 2010.
Although public fatalities have been decreasing in recent years, suicides have steadily increased. This change could be attributed to improvements arising from clarifications to the procedures for reporting and distinguishing between trespasser fatalities and suicides, or it could indicate a rising trend of suicides in public transportation environments. On average, fatalities involving suicides and persons who are not transit passengers or patrons (usually pedestrians and drivers) account for about 75 percent of all public transportation fatalities.
Chapter 5
System Performance: Highways
This chapter relates to three of the goals in the U.S. DOT Strategic Plan FY 2012–FY2016: (1) to “Foster livable communities through place-based policies and investments that increase transportation choices and access to transportation services;” (2) to “Advance environmentally sustainable policies and investments that reduce carbon and other harmful emissions from transportation sources;” and (3) to “Promote transportation policies and investments that bring lasting and equitable economic benefits to the Nation and its citizens.”
Sustainable Transportation Systems
Transportation systems that balance the access and mobility needs of all users—motorists, truckers, emergency vehicles, bicyclists, pedestrians, and transit riders—are an important aspect of livable communities. Incorporating community input and other livability considerations into transportation, land use, and housing policies can help improve public health and safety, lower infrastructure costs, reduce combined household transportation and housing costs, reduce vehicle miles traveled, and improve air and water quality, among many other benefits.
Sustainability emphasizes the natural environment, the economic efficiency of the transportation system, and societal needs (e.g., mobility, accessibility, and safety). Transportation agencies currently address sustainability through a wide range of initiatives, such as Intelligent Transportation Systems, linking transportation and land use decision-making, linking planning and environment, and addressing requirements of the National Environmental Policy Act. From an environmental sustainability perspective, FHWA helps ensure that regions continue to make progress towards their air-quality standards through the Congestion Mitigation and Air Quality Improvement (CMAQ) Program, promoting strategies to reduce greenhouse gas emissions, and assisting transportation agencies in adapting to the impacts of climate change and extreme weather events.
Economic Competitiveness
Maintaining economic competitiveness means increasing and maximizing the contribution of the transportation system to economic growth.
Heavy congestion has an adverse impact on the American economy. The problem is of particular concern to firms involved in logistics and distribution. As just-in-time delivery increases, firms need an integrated transportation network that allows for the reliable, predictable shipment of goods. If travel time were to increase or reliability were to decrease, businesses would need to increase average inventory levels to compensate, which increases storage costs and adds to the final costs of goods.
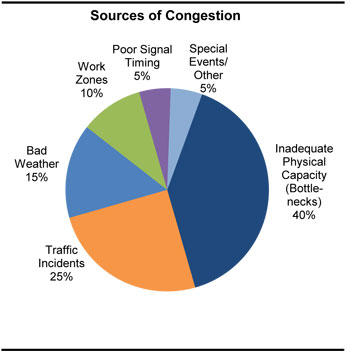
Congestion results when traffic demand approaches or exceeds the available capacity of the system. Recurring congestion occurs in roughly the same place and time on the same days of the week if the physical infrastructure is not adequate to accommodate demand during peak periods. Nonrecurring congestion is caused by temporary disruptions that take away part of the roadway from use. The three main causes of nonrecurring congestion are: incidents ranging from a flat tire to an overturned hazardous material truck, work zones, and weather.
Chapter 5
System Performance: Transit
The transit industry has been successful at meeting the growing demand for its services in communities across the country. While many transit agencies experienced budget reductions during the last decade, analyses of transit data from the end of the last decade show steady increases in service provided. This is accompanied by improvements in a number of efficiency indicators and in ridership.
Between 2000 and 2010, transit route miles of service and vehicle revenue miles on those routes have steadily increased for all the major transit modes. This has been done without significant decreases in vehicle occupancy. In addition, the mean distance transit vehicles operated between mechanical breakdowns has decreased (by 14 percent).
Between 2000 and 2010, transit agencies provided substantially more service. The overall annual rate of growth in urban directional route miles was 1.9 percent with a range from 0.4 percent for heavy rail to 6.0 percent for light rail, and bus route miles grew at 1.9 percent per year. This has resulted in 21 percent more route miles available to the public with growth focused on the light rail and commuter rail systems that are most likely to attract riders from automobiles.
Growth in route miles was matched by 2.0-percent annual overall growth in vehicle revenue miles. This indicates that the new route miles are being served at a frequency similar to that of the previous routes. This demonstrates a true expansion of service to more neighborhoods and more people. Vehicle revenue mile growth for vanpools was particularly large, but recent increases in reporting account for much of this increase.
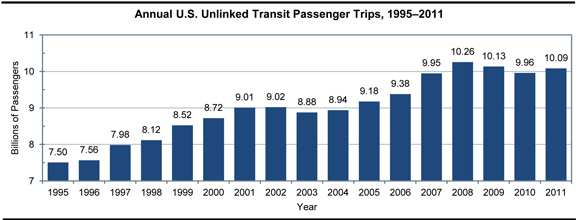
Growth in service offered was almost matched by growth in ridership. In spite of steady growth in route miles and revenue miles, average vehicle occupancy levels remained stable. Passenger miles traveled grew at a 1.6-percent annual pace while the number of unlinked passenger trips grew at a 1.3 percent annual pace. This is significantly faster than the growth in the U.S. population during this period (0.93 percent), possibly suggesting that transit has been able to attract riders who previously used other modes of travel. Increased availability of transit service has undoubtedly been a factor in this success.
The two fastest-growing rail modes—light rail and commuter rail—did have some trouble maintaining occupancy levels; their per-vehicle occupancies are down 9.2 percent and 9.8 percent, respectively, since 2000. The other major modes are largely unchanged. Several urbanized areas, including Denver, Phoenix, Seattle, Charlotte, and Salt Lake City, recently opened new light rail systems and it typically takes several years for a new system to realize its full ridership potential.
Productivity per active vehicle increased between 2000 and 2010. Vehicle in-service mileage increased steadily from 2000 to 2008 before leveling off between 2008 and 2010. For the decade, all the major modes showed increases in vehicle use. Light rail and demand response have shown a particularly strong improvement in vehicle miles per active vehicle.
| Transit Mode | Miles (Millions) | Average Annual Rate of Change 2010/2000 | |||||
|---|---|---|---|---|---|---|---|
| 2000 | 2002 | 2004 | 2006 | 2008 | 2010 | ||
| Rail | 879 | 925 | 963 | 997 | 1,054 | 1,056 | 1.9% |
| Heavy Rail | 578 | 603 | 625 | 634 | 655 | 647 | 1.1% |
| Commuter Rail | 248 | 259 | 269 | 287 | 309 | 315 | 2.4% |
| Light Rail | 51 | 60 | 67 | 73 | 86 | 92 | 6.0% |
| Other Rail | 2 | 3 | 2 | 3 | 3 | 2 | 1.7% |
| Nonrail | 2,322 | 2,502 | 2,586 | 2,674 | 2,841 | 2,863 | 2.1% |
| Motor Bus | 1,764 | 1,864 | 1,885 | 1,910 | 1,956 | 1,917 | 0.8% |
| Demand Response | 452 | 525 | 561 | 607 | 688 | 718 | 4.7% |
| Vanpool | 62 | 71 | 78 | 110 | 157 | 181 | 11.3% |
| Ferryboat | 2 | 3 | 3 | 3 | 3 | 3 | 5.0% |
| Trolleybus | 14 | 13 | 13 | 12 | 11 | 12 | -1.8% |
| Other Nonrail | 28 | 26 | 46 | 32 | 25 | 32 | 1.5% |
| Total | 3,201 | 3,427 | 3,549 | 3,671 | 3,895 | 3,920 | 2.0% |
Chapter 6
Finance: Highways
Highway revenue totaling $221.0 billion was collected by all levels of government in 2010, while $205.3 billion was spent on highways during the year. (The net difference of $15.7 billion was added into reserves for use in future years.)
User charges such as motor-fuel and motor-vehicle tax receipts and tolls have traditionally provided the majority of the combined revenues raised for highway and bridge programs by all levels of government. However, at the Federal level, the total proceeds to the Highway Trust Fund (HTF) from dedicated excise taxes have fallen below annual expenditures for several years. As recently as 2007, the share of Federal highway revenue derived from user charges was 92.8 percent, but this share has subsequently dropped to 48.8 percent in 2010. This decline is the result of a legislated $14.7 billion transfer of general funds to the HTF, as well as the expenditure in 2010 of $11.9 billion of funding authorized by the Recovery Act.
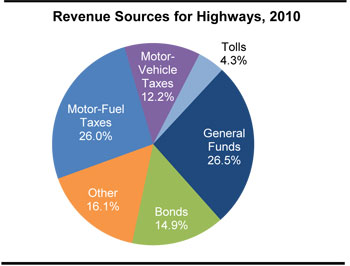
In 2010, $93.8 billion (42.5 percent, down from 62.0 percent in 2000) of the revenue generated for spending on highways and bridges by all levels of government came from highway-user charges. General fund appropriations totaled $58.6 billion (26.5 percent) and bond proceeds totaled $33.0 billion (14.9 percent). All other sources such as property taxes, other taxes and fees, lottery proceeds, interest income, and miscellaneous receipts totaled $35.5 billion (16.1 percent).
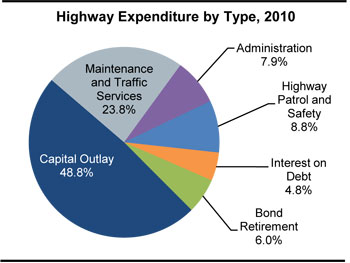
Of the $205.3 billion spent on highways in 2010, $100.2 billion (48.8 percent) was used for capital investment. Spending on routine maintenance and traffic services totaled $48.8 billion (23.8 percent), administrative costs (including planning and research) were $16.2 billion, $18.1 billion was spent on highway patrol and safety programs, $9.8 billion was used to pay interest, and $12.3 billion was used for bond retirement.
The portion of total capital spending directed toward system rehabilitation (resurfacing or replacing existing pavements and rehabilitating or replacing existing bridges) rose from $46.2 billion (51.1 percent of the total) in 2008 to $60.0 billion (59.9 percent of the total) in 2010, an increase of almost 30 percent over the 2 years which was partly driven by additional funding provided by the Recovery Act.
Federal cash expenditures for capital purposes grew at an average annual rate of 5.4 percent from $26.1 billion in 2000 to $44.4 billion in 2010; combined State and local capital spending grew by 4.7 percent per year during this period. Consequently, the Federally funded share of total capital outlay rose during this period (from 42.6 percent to 44.3 percent).
In inflation-adjusted, constant-dollar terms, highway capital spending increased at an average annual rate of 3.2 percent from 2000 to 2010, while total highway expenditures grew 3.1 percent per year.
Chapter 6
Finance: Transit
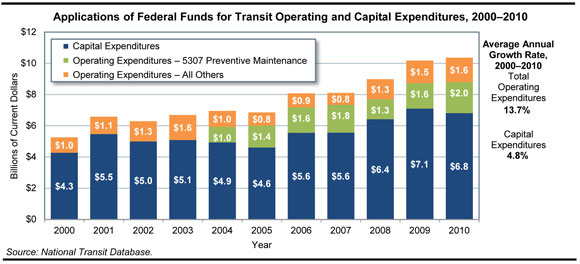
In 2010, $54.3 billion was generated from all sources to finance transit investment and operations. Transit funding comes from public funds allocated by Federal, State, and local governments and system-generated revenues earned by transit agencies from the provision of transit services. Of the funds generated in 2010, 73.9 percent ($40.2 billion) came from public sources and 26.1 percent came from passenger fares ($12.1 billion) and other system-generated revenue sources ($2.0 billion). The Federal share of this was $10.4 billion (25.8 percent of total public funding and 19.1 percent of all funding). Local jurisdictions provided the bulk of transit funds: $18.0 billion in 2010, or 44.9 percent of total public funds and 33.2 percent of all funding.
In 2010, total public transit agency expenditures for capital investment were $16.6 billion. Annually authorized Federal funds, $4.4 billion, made up 26.6 percent of these capital expenditures. Federal funds from the American Recovery and Reinvestment Act provided another 14.5 percent. State funds provided an additional 14.2 percent and local funds provided the remaining 44.6 percent.
Of total 2010 transit capital expenditures, 72.0 percent ($11.9 billion) was invested in rail modes of transportation, compared with 28.0 percent ($4.6 billion) invested in nonrail modes. This investment distribution has been consistent over the last decade.
In 2010, $37.8 billion was expended on transit operating expenses (wages, salaries, fuel, spare parts, preventive maintenance, support services, and leases). The Federal share of this has increased from the 2008 level of 7.1 percent to 9.4 percent. The share generated from system revenues remained relatively stable. The State share decreased slightly from 25.8 percent in 2008 to 25.0 percent. The local share of operating expenditures (28.2 percent) has been stable for several years.
The average annual increase in operating expenditures per vehicle revenue mile for all modes combined between 2000 and 2010 was 1.3 percent. Because vehicle capacity varies across transit modes, it is customary to analyze operating costs per capacity equivalent mile. By this standard, the cost per mile to run a bus is $9.60 while the cost to run the same number of seats on a heavy rail vehicle is $3.98. Demand response (mostly provided by vans) is the most expensive to operate; a mile of bus-equivalent demand-response seats would cost $25.48.
Bus operating cost increases (2.0 percent per year) and demand response increases (3.1 percent per year) have been higher than those experienced by the rail modes (1.0 percent for heavy rail, -0.1 percent for commuter rail, and 0.4 percent for light rail).
Since 2004, some preventative maintenance costs—normally considered operating expenses—have been eligible for FTA reimbursement as capital expenses; they are shown separately in the figure below.
Part II
Investment/Performance Analysis
The methods and assumptions used to analyze future highway, bridge, and transit investment scenarios for this report are continuously evolving to incorporate new analytical methods, new data and evidence, and changes in transportation planning objectives.
Traditional engineering-based analytical tools focus mainly on estimating transportation agency costs to maintain or improve the conditions and performance of infrastructure. This type of analytical approach can provide valuable information about the cost effectiveness of transportation system investments from the public agency perspective, including the optimal pattern of investment to minimize life-cycle costs. However, this approach does not fully consider the potential benefits to users of transportation services from maintaining or improving the conditions and performance of transportation infrastructure.
The investment/performance analyses presented in Chapters 7 through 10 were developed using the Highway Economic Requirements System (HERS), the National Bridge Investment Analysis System (NBIAS), and the Transit Economic Requirements Model (TERM). Each of these tools has a broader focus than traditional engineering-based models and takes into account the value of the services that transportation infrastructure provides to its users as well as some of the impacts that transportation activity has on non-users. Although HERS, TERM, and NBIAS all use benefit-cost analysis, their methods for implementing this analysis differ significantly. The highway, transit, and bridge models each rely on separate databases, making use of the specific data available for each mode of the transportation system and addressing issues unique to that mode. The methodologies used to analyze investment for highways, bridges, and transit are detailed in Appendices A, B, and C.
The economic approach to transportation investment relies fundamentally upon an analysis and comparison of the benefits and costs of potential investments. Projects that yield benefits whose value exceeds their costs have the potential to increase societal welfare and are thus considered “economically efficient.” In practice, however, data limitations and other factors prevent any benefit-cost analysis from being fully comprehensive, and attaining national breadth of perspective for this report’s analyses required that the scope be limited in other ways. The analyses do not consider, for example, environmental impacts of increased water runoff from highway pavements, barrier effects of highways for human and animal populations, the health benefits from the additional walking activity when travelers go by transit rather than by car, and some other impacts related to livability. The analyses also do not consider transportation investments packaged across modes or with demand management measures or land use policies. Future editions of the C&P report may address these issues through evidence obtained from more regionally focused modeling frameworks.
Benefits and costs are measured in this report’s analysis in constant 2010 dollars to eliminate the effect of any general inflation that may be expected to occur in subsequent years. For some prices, however, the analysis projects increases at a rate different from the general rate of inflation. These include the price of motor fuels, the cost to society of carbon emissions, and, in the Chapter 10 sensitivity analysis, the value of travel time savings.
The models used in this report’s analysis produce single-valued best estimates of future outcomes rather than probability distributions of outcomes. The sensitivity analysis conducted in Chapter 10 addresses the uncertainty in parameter values (discount rates, value of time saved, statistical value of lives saved, etc.). For any year, the projected outcomes are more subject to forecasting error than the differences between projected outcomes at alternative levels of investment.
Chapter 7 analyzes the projected impacts of alternative levels of future investment on measures of physical condition, operational performance, and benefits to system users. Each alternative pertains to investment from 2011 through 2030, and is presented as an annual average level of investment and in terms of the annual rate of increase or decrease in investment that would produce that annual average. Both the level and rate of growth in investment are measured using constant 2010 dollars.
In addition to a primary set of analyses assuming State-provided VMT forecasts for highways and Metropolitan Planning Organization (MPO)-provided passenger miles traveled (PMT) forecasts for transit, Chapter 7 also includes a secondary set of analyses assuming a continuation of 15-year growth trends. For highways, this alternative travel growth rate is lower than the State forecasts; for transit, the alternative growth rate is higher than the MPO forecasts.
Chapter 8 examines several scenarios distilled from the investment alternatives considered in Chapter 7. Some of the scenarios are oriented toward maintaining different aspects of system condition and performance or achieving a specified minimum level of performance, while others link to broader measures of system user benefits.
The capital investment scenario projections reflect complex technical analyses that attempt to predict the impact that capital investment may have on the future conditions and performance of the transportation system. These scenarios are intended to be illustrative, and the Department does not endorse any of them as a target level of investment.
This report does not attempt to address issues of cost responsibility. The investment scenarios predict the impact that particular levels of combined Federal, State, local, and private investment might have on the overall conditions and performance of highways, bridges, and transit.
In considering the system condition and performance projections in this report’s capital investment scenarios, it is important to note that they represent what could be achievable assuming a particular level of investment, rather than what would be achieved. The models used to develop the projections generally assume that, when funding is constrained, the benefit-cost ratio (BCR) establishes the order of precedence among potential capital projects, with projects with higher BCRs being selected first. In actual practice, the BCR generally omits some types of benefits and costs because of difficulties in valuing them monetarily, and these other benefits and costs can and do affect project selection.
Also, some potential capital investments selected by the models, regardless of their economic merits or impact on conditions and performance, may be infeasible for political or other reasons. As a result, the supply of feasible cost-beneficial projects could be lower than the levels estimated by the modeling assumptions of some scenarios.
Chapter 9 provides supplemental scenario analyses, including comparisons of the investment requirements identified for selected scenarios in this report with those presented in previous editions. This includes a comparison of the 20-year projections from the 1991 C&P Report with what actually occurred in terms of VMT, conditions, and performance. Issues relating to the interpretation of scenarios, including the timing of future investment and the conversion of scenarios from constant dollars to nominal dollars, are also explored. Chapter 9 also discusses transit asset condition forecasts, transit PMT growth rates, the impact of new technologies on transit investment needs, and transit expansion investment.
The investment scenario projections in this report are based on assumptions about future travel growth and a variety of engineering and economic variables. The accuracy of these projections depends, in large part, on the realism of these assumptions. To address the uncertainty concerning which assumptions would be most realistic, Chapter 10 presents a series of sensitivity analyses that vary the discount rate, the value of travel time savings, and other economic assumptions, as well as some alternative system management strategies.
Chapter 7
Potential Capital Investment Impacts: Highways
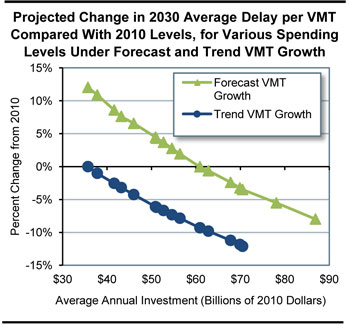
The rate of future travel growth can have a significant impact on the projected future conditions and performance of the highway system. For each of the more than 100,000 HPMS sample highway sections, States provide the actual base-year traffic volume and a forecast of future traffic volume. The HERS model assumes that these forecasts correspond to the VMT that would occur if the average user cost per mile of travel (including the costs of travel time, vehicle operation, and crash risk) remained unchanged. HERS then modifies the forecasts in response to projected future changes in user costs, increasing VMT if user costs rise or decreasing VMT if user costs fall. The composite weighted average growth rate computed from the 2008 HPMS sample data is 1.85 percent per year, which is reflected in the forecast-based analyses. An alternative set of trend-based HERS analyses was developed for this report in which the HPMS forecasts were modified to match the average annual VMT growth rate of 1.36 percent for the 15-year period from 1985 to 2010.
Of the $100.2 billion of total capital outlay by all levels of government combined in 2010, $56.4 billion was used on Federal-aid highways for types of capital improvements modeled in HERS, including pavement improvements and system expansion. Sustaining HERS-modeled investment at this level in constant dollar terms over 20 years is projected to result in a 1.9 percent increase in average delay per VMT and an 11.5 percent decrease in average pavement roughness by 2030 relative to 2010, assuming forecast-based VMT growth. Projected performance for 2030 relative to 2010 would be better assuming trend-based VMT growth, with average delay per VMT decreasing by 7.8 and average pavement roughness decreasing by 17.7 percent. The relatively greater improvement in pavement roughness assuming trend-based VMT growth is due partly to reduced pavement wear and tear associated with lower future VMT, but is due primarily to differences in the mix of investments recommended by HERS; the lower projected future VMT causes HERS to shift resources from capacity expansion to pavement improvements, resulting in better pavements.
Assuming forecast-based VMT growth, HERS projects that constant-dollar spending growth of 3.95 percent per year would suffice to finance all potentially cost-beneficial capital improvements on Federal-aid highways by 2030. This would translate into an average annual investment level of $86.9 billion and result in a 26.7-percent decrease in average pavement roughness and an 8.0-percent reduction in average delay per VMT. Assuming trend-based VMT growth, the pool of potential cost-beneficial investments would be smaller, and could be addressed if spending grew by 2.08 percent annually in constant-dollar terms, resulting in an average annual level of $70.5 billion.
In 2010, $17.1 billion was spent on improvement types modeled in NBIAS, including bridge repair, rehabilitation, and replacement. Sustaining this level of investment in constant dollar terms over 20 years is projected to result in an increase in the average bridge sufficiency rating from 81.7 in 2010 to 84.1 in 2030 (on a 100-point scale). Increasing NBIAS-modeled constant dollar spending by 1.57 percent per year would translate to an average annual spending level of $20.2 billion, and would further improve the average sufficient rating to 84.6 by 2030.
Chapter 7
Potential Capital Investment Impacts: Transit
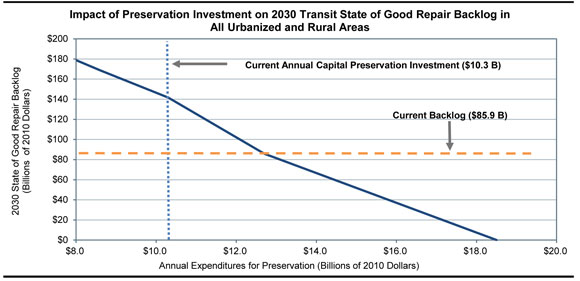
In 2010, U.S. transit agencies spent a combined $16.5 billion on capital improvements to the Nation’s transit infrastructure and vehicle fleets. This amount included $10.3 billion in the preservation (rehabilitation and replacement) of existing assets already in service and $6.2 billion to expand transit capacity—both to accommodate ridership growth and to improve performance for existing riders. Although 2010 investment levels are very similar to those of 2008, the proportion of capital funds used for expansion has increased from 32 to 38 percent and preservation investments have declined.
Sustaining transit capital spending at year 2010 levels for 20 years is projected to result in an overall decline in transit system conditions due to underinvestment in system preservation. The average physical condition of the Nation’s stock of transit assets will decline, with an estimated 52 percent increase in the size of the “State of Good Repair” (SGR) backlog by 2030. The backlog is currently $85.9 billion. This will have impacts on service reliability and potentially on safety.
The TERM estimates that the average annual level of investment required to eliminate the existing system preservation backlog by 2030 is roughly $18.5 billion. Up to $7.1 billion in annual expansion investments may also be required to maintain transit performance (as measured by vehicle crowding) at 2010 levels, depending on the actual rate of growth in ridership.
However, current expansion rates seem sufficient to provide for expected levels of ridership growth. Continuing the current level of investment in expansion will result in somewhere between a 35-percent reduction and a 17-percent increase in vehicle occupancy by 2030 (depending on the magnitude of ridership growth).
| Current versus Needed Expenditures | Urbanized Areas with Populations > 1 Million | Urbanized Areas with Populations < 1 Million |
|---|---|---|
| Asset Preservation (Billions) | ||
| 2010 Expenditures | $9.0 | $1.3 |
| Annual Expenditures to Achieve SGR | $16.0 | $2.5 |
| Capacity Expansion (Billions) | ||
| 2010 Expenditures | $5.4 | $0.9 |
| Annual Expenditures Low Growth | $3.3 | $0.2 |
| Annual Expenditures High Growth | $5.4 | $0.6 |
Chapter 8
Selected Capital Investment Scenarios: Highways
This report presents a set of illustrative 20-year capital investment scenarios based on simulations developed using the HERS and the NBIAS models, with scaling factors applied to account for types of capital spending that are not currently modeled. The scenario criteria were applied separately to the Interstate System, the NHS, Federal-aid highways, and the highway system as a whole, based on section-level VMT forecasts from the HPMS averaging 1.85 percent per year. Separate versions of the scenarios for Federal-aid highways and all roads, assume lower, trend-based VMT growth of 1.36 percent per year. The Sustain 2010 Spending scenario assumes that capital spending is sustained in constant dollar terms at year 2010 levels from 2011 through 2030. (In other words, spending would rise by exactly the rate of inflation during that period.) Note that 2010 spending was supplemented by one-time funding under the Recovery Act. The Maintain Conditions and Performance scenario assumes that capital investment gradually changes in constant dollar terms over 20 years to the point at which selected measures of highway and bridge performance in 2030 are maintained at their year 2010 levels. For all roads, the average annual investment levels associated with this scenario are $86.3 billion assuming forecast-based VMT growth and $65.3 billion assuming trend-based VMT growth. Both estimates are below the $100.2 billion spent on all roads in 2010, indicating that sustained spending at 2010 levels could result in improved overall conditions and performance.
Unless one is completely satisfied with base year conditions and performance, investing at a level projected to maintain that level of performance would not yield an ideal result. The Improve Conditions and Performance scenario assumes that capital investment gradually rises in constant dollar terms to the point at which all potentially cost-beneficial investments could be implemented by 2030. This scenario can be thought of as an “investment ceiling” above which it would not be cost-beneficial to invest. The average annual investment level for all roads under this scenario is $145.9 billion for all roads assuming forecast-based VMT growth and $123.7 billion assuming trend-based VMT growth. Of the $145.9 billion Improve Conditions and Performance scenario investment level for all roads assuming forecast-based VMT growth, $78.3 billion (54 percent) would be directed toward improving the physical condition of existing infrastructure assets; this amount is identified as the State of Good Repair benchmark. The comparable values (assuming forecast-based VMT growth) for Federal-aid highways, the NHS, and the Interstate System are $60.4 billion, $34.5 billion, and $13.2 billion, respectively.
| System Subset | Sustain 2010 Spending | Maintain C&P | Improve C&P |
|---|---|---|---|
| Assuming Higher VMT Growth From HPMS Forecasts | |||
| Interstate | $20.2 | $17.4 | $33.1 |
| NHS | $53.9 | $37.8 | $74.9 |
| FAH | $75.8 | $67.3 | $113.7 |
| All Roads | $100.2 | $86.3 | $145.9 |
| Assuming Lower Trend-Based VMT Growth | |||
| FAH | $75.8 | $50.3 | $95.7 |
| All Roads | $100.2 | $65.3 | $123.7 |
Investing at the Improve Conditions and Performance scenario level for Federal-aid highways (assuming forecast-based VMT growth) is projected to result in a 26.7-percent reduction in average pavement roughness and an 8.0-percent reduction in average delay per VMT. The average bridge sufficiency rating is projected to rise from 82.0 to 84.7 under this scenario.
Of the $100.2 billion of highway capital spending on all roads in 2010, 27.4 percent was directed toward system expansion. Assuming forecast-based VMT growth, the Sustain 2010 Spending scenario for all roads would direct 29.9 percent of its investment toward capacity expansion; the comparable share for the Improve Conditions and Performance scenario is 33.6 percent.
Chapter 8
Selected Capital Investment Scenarios: Transit
This report presents a set of illustrative 20-year transit capital investment scenarios. These scenarios build upon analyses developed using the TERM and were applied separately to the Nation’s transit assets as a whole, to urbanized areas (UZAs) with populations of more than one million, and to everyone else.
The Sustain 2010 Spending scenario assumes that capital spending is sustained at 2010 levels, in constant dollar terms, for 20 years. Transit operators spent $16.5 billion on capital projects in 2010. Of this amount, $10.3 billion was devoted to the preservation of existing assets and the remaining $6.2 billion was dedicated to investment in asset expansion to support ongoing ridership growth and to improve service performance. This scenario considers the expected impact on the Nation’s transit infrastructure if these expenditure levels are sustained in constant dollar terms. TERM analysis suggests that sustaining spending at 2010 levels would likely yield an estimated 65-percent increase in the SGR backlog by 2030. The 2010 backlog is estimated at $85.9 billion. Current levels of expansion investment are within the projected range necessary to limit increases in crowding on transit passenger vehicles.
The Low Growth and High Growth scenarios consider the level of investment to address both asset SGR and service expansion needs subject to two differing potential levels of growth. The Low Growth scenario assumes that transit ridership will grow as projected by the Nation’s metropolitan planning organizations, and the High Growth scenario assumes the average rate of growth (by UZA) as experienced in the industry since 1995. The Low Growth scenario assumes that ridership will grow at an annual rate of 1.4 percent during the 20-year period from 2010 to 2030; conversely, the High Growth scenario assumes that ridership will increase at a rate of 2.2 percent per year during that time frame. TERM estimates this average annual level of investment for the Nation to be between $22.0 billion and $24.5 billion, including between $17.3 billion and $17.4 billion to replace and rebuild assets as they exceed their life expectancy and between $4.6 billion and $7.1 billion for expansion to keep up with growth in demand. The high and low estimates here depend on the expected rate of ridership growth, which is expected to be between these high- and low-growth estimates.
| Mode, Purpose, and Asset Type | Investment Projection (Billions of 2010 Dollars) | |||
|---|---|---|---|---|
| Sustain 2010 Spending | SGR | Low Growth | High Growth | |
| Urbanized Areas Over 1 Million in Population 1 | ||||
| Nonrail2: Preservation | $2.9 | $4.6 | $4.2 | $4.2 |
| Nonrail2: Expansion | $1.2 | $0.0 | $1.2 | $2.1 |
| Subtotal Nonrail3 | $4.1 | $4.6 | $5.4 | $6.3 |
| Rail: Preservation | $6.3 | $11.4 | $11.0 | $11.1 |
| Rail: Expansion | $4.2 | $0.0 | $2.9 | $4.0 |
| Subtotal Rail3 | $10.5 | $11.4 | $13.9 | $15.1 |
| Total, Over 1 Million in Population3 | $14.6 | $16.0 | $19.3 | $21.4 |
| Urbanized Areas Under 1 Million in Population and Rural | ||||
| Nonrail2: Preservation | $1.1 | $2.2 | $1.9 | $1.9 |
| Nonrail2: Expansion | $0.6 | $0.0 | $0.5 | $1.0 |
| Subtotal Nonrail3 | $1.7 | $2.2 | $2.4 | $2.9 |
| Rail: Preservation | $0.0 | $0.3 | $0.2 | $0.2 |
| Rail: Expansion | $0.2 | $0.0 | $0.0 | $0.0 |
| Subtotal Rail3 | $0.2 | $0.3 | $0.2 | $0.2 |
| Total, Under 1 Million and Rural3 | $1.9 | $2.5 | $2.7 | $3.1 |
| Total3 | $16.5 | $18.5 | $22.0 | $24.5 |
2 Buses, vans, and other (including ferryboats).
3 Note that totals may not sum due to rounding.
Chapter 9
Supplemental Scenario Analysis: Highways
While the names and definitions of the highway scenarios presented in the C&P report have varied over time, each edition has generally included one primary scenario oriented toward maintaining the overall state of the system and one oriented toward improving the overall state of the system. Looking at previous editions starting with the 1997 C&P Report, the “gap” between base year spending and the average annual investment level for the primary “Maintain” and “Improve” scenarios has varied, rising as high as 34.2 percent and 121.9 percent, respectively, in the 2008 C&P Report (comparing needs in 2006 dollars with actual spending in 2006). These larger gaps coincided with a 43.3 percent increase in construction costs between 2004 and 2006.
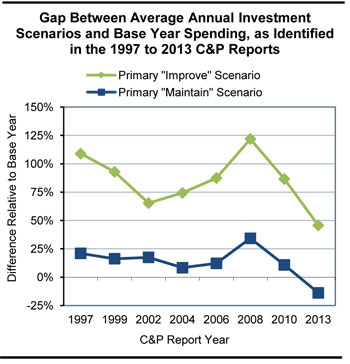
For the forecast-based analyses in the current 2013 C&P Report, the gap associated with the Improve Conditions and Performance scenario has fallen to 45.7 percent, while the gap with the Maintain Conditions and Performance scenario is –13.9 percent because the average annual investment level under the Maintain Conditions and Performance scenario is lower than actual spending in 2010. This negative gap is partially due to increased funding from the Recovery Act but is largely attributable to a recent decline in construction costs; the National Highway Construction Cost Index declined by 18.0 percent from 2008 to 2010.
For the 20-year period ending in 2028, the 2010 C&P Report estimated the average annual investment levels for the Maintain Conditions and Performance scenario and the Improve Conditions and Performance scenario to be $101.0 billion and $170.1 billion, respectively, both stated in constant 2008 dollars; restating this in 2010 dollars would reduce them to $82.8 billion and $139.4 billion. The comparable forecast-based values presented in the 2013 C&P Report for these scenarios ($86.3 billion and $145.9 billion) are 4.0 percent higher and 4.7 higher, respectively, than these adjusted values.
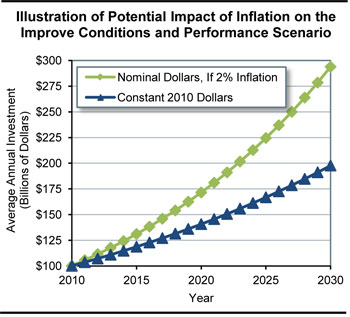
The investment scenarios presented in this report are “ramped”, applying an annual constant dollar growth rate starting with the $100.2 billion of highway capital spending by all levels of government in 2010. For the forecast-based Improve Conditions and Performance scenario, the amount spent in individual years ranges from $103.6 billion in 2011 (3.46 percent more than 2010 spending) up to $197.8 billion in 2030. These values do not reflect the effects of inflation; assuming a 2 percent annual inflation rate would increase the nominal dollar value for 2030 to $293.8 billion.
Chapter 9
Supplemental Scenario Analysis: Transit
This section is intended to provide the reader with a deeper understanding of the assumptions behind the investment scenarios presented in Chapters 7 and 8. It includes discussion of the following topics:
- Asset condition projection under the four Chapter 8 scenarios.
- A comparison of 2010 to 2012 TERM results.
- A comparison of historic rates of growth in PMT with the growth projections provided by the Nation’s MPOs.
- An assessment of the impact of an evident gradual transition to alternative fuel and hybrid vehicles on the reinvestment backlog.
- How many transit vehicles, route miles, and stations would be acquired under the High Growth and Low Growth scenarios.
Asset condition projections for each of the Chapter 8 scenarios are presented both as average condition ratings and as distributions of assets by how much of their useful life will have been consumed. The former includes a discussion of a more realistic (gradual) pay-down of the reinvestment backlog.
We then provide an analysis of the reasons that the SGR backlog estimate has changed relative to the projections presented in the 2010 edition of this report.
| Billion $ | |
|---|---|
| SGR backlog as reported in the 2010 C&P Report | $77.7 |
| Impact of 2 additional years of needs | 0.0 |
| Impact of inflation | +3.6 |
| Impact from the change in the asset inventory | 0.0 |
| SGR backlog as reported in the 2013 C&P Report | $81.3 |
This is followed by an analysis of average historical rates of transit PMT growth. These rates exceed the MPO-projected rates of growth typically used for long-range transportation planning purposes. Given the difference between the two growth rates (and the relatively high rate of historic PMT growth as compared with other measures, such as UZA population growth), the 2.1-percent historical growth rate of PMT was identified as a reasonable input value for the High Growth scenario. Similarly, the 1.3-percent MPO-projected growth rate was used as an input value for the Low Growth scenario.
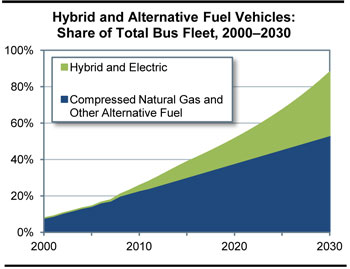
Based on recent trends in vehicle procurement, the share of vehicles powered by alternative fuels is estimated to increase from 23 percent in 2010 to 53 percent in 2030. During the same period, the share of hybrid buses is estimated to increase from 3 percent to 35 percent. The average cost of an alternative-fuel bus is 15.5 percent higher than that of a standard diesel bus of the same size, and hybrid buses cost roughly 65.9 percent more than standard diesel buses of the same size. An analysis of the impact these more expensive vehicles will have on long-term capital needs is presented in this section based on the assumption that these price differentials will remain static.
Finally, this section attempts to answer the question: what will our transit system look like in 2030 under these scenarios? In this discussion, fleet size, fixed guideway route miles, and the total number of stations under each scenario over the period of 2010 to 2030 is projected.
Chapter 10
Sensitivity Analysis: Highways
Critical to any modeling effort is evaluation of the underlying assumptions—their validity and the sensitivity of the modeling results to altering them. Chapter 10 demonstrates how the baseline forecast-based scenarios presented in Chapter 8 would be affected by changing some HERS and NBIAS parameters.
The valuation of travel time savings assumed in the baseline scenarios are linked to average hourly income; personal travel is valued at 50 percent of income, while business travel is valued at 100 percent. Alternative tests were run reducing these shares to 35 percent and 80 percent, respectively, and raising them to 60 percent and 120 percent. Applying a lower value of time reduces the benefits associated with travel time savings, and would reduce the average annual investment level under the Improve Conditions and Performance scenario from $145.9 billion to $134.9 billion, as some potential projects would no longer qualify as cost-beneficial. Assuming a higher value of time would increase the annual cost of this scenario to $153.3 billion.
The baseline scenarios assume a $6.2-million value of a statistical life for purposes of computing safety-related benefits. Reducing this value to $3.4 million would reduce the annual cost of the Improve Conditions and Performance scenario to $142.4 billion; increasing the value to $9.0 million would increase the annual cost to $148.9 billion.
Benefit-cost analyses use a discount rate that scales down benefits and costs arising further in the future relative to those arising sooner. The baseline scenarios assume a 7-percent rate; changing this to 3 percent would increase the average annual investment level under the Improve Conditions and Performance scenario to $177.3 billion.
The price of fuel assumed in HERS for the baseline scenarios is linked to the “reference forecast” from the Department of Energy’s Annual Energy Outlook (AEO) publication. Substituting in values from the AEO “high oil price case” would increase the cost of driving, causing HERS to reduce its estimate of future VMT growth. This would reduce the annual cost of the Improve Conditions and Performance scenario to $124.5 billion.
The NBIAS Maintenance, Repair, and Replacement (MR&R) strategy assumed in the baseline scenarios aims to sustain bridges in a steady state. An alternative strategy of minimizing bridge MR&R costs was found to sharply increase bridge replacement needs in the long run, increasing average annual investment under the Improve Conditions and Performance scenario to $161.4 billion; even at this level of spending, it would not be possible to maintain the average bridge sufficiency rating at its 2010 level through 2030.
The baseline scenarios assume a continuation of current trends in deployments of Intelligent Transportation System (ITS)/Operations strategies. Accelerating these deployments would raise the cost of the Improve Conditions and Performance scenario, but would yield better results in terms of reducing average delay per VMT.
| Parameter Change | Maintain C&P | Improve C&P |
|---|---|---|
| Baseline | $86.3 | $145.9 |
| Lower Value of Time | $89.2 | $134.9 |
| Higher Value of Time | $84.9 | $153.3 |
| Lower Value of Statistical Life | $84.5 | $142.4 |
| Higher Value of Statistical Life | $87.7 | $148.9 |
| 3 Percent Discount Rate | $88.1 | $177.3 |
| Higher Future Fuel Prices | $72.8 | $124.5 |
| Minimize Bridge MR&R Costs | N/A | $161.4 |
| Aggressive ITS/Operations Deployments | $90.6 | $151.5 |
The impacts of alternative assumptions on the Maintain Conditions and Performance scenario are generally smaller, and linked either to the models’ distribution of spending among different capital improvement types or to reduced VMT.
Chapter 10
Sensitivity Analysis: Transit
The TERM relies on a number of key input values, variations of which can significantly impact the value of TERM’s capital needs projections. Each of the three unconstrained investment scenarios examined in Chapter 8—including the SGR benchmark and the Low Growth and High Growth scenarios—assumes that assets are replaced at a condition rating of 2.50 as determined by TERM’s asset condition decay curves. Analysis suggests that each of these scenarios is sensitive to changes in this replacement condition threshold, with the sensitivity increasing disproportionally with higher replacement condition thresholds. For example, reducing the condition threshold to 2.25 tends to reduce the SGR backlog by just over $1 billion (close to 6 percent). In contrast, increasing the threshold to 2.75 increases preservation needs by more than $3 billion (just under 20 percent), and a further threshold increase to 3.00 increases preservation needs by nearly $7 billion (around 40 percent). This increasing sensitivity reflects the fact that ongoing incremental changes to the replacement condition threshold yield greater proportionate reductions in the length of the asset life cycles as higher replacement condition values are reached.
Needs estimates for scenarios employing TERM’s benefit-cost analysis are also particularly sensitive to changes in capital costs (assuming no comparable increase in benefits) because these increases tend to reduce the value of the benefit-cost ratio, causing some previously acceptable projects to fail this test. For example, a 25-percent increase in capital costs increases investment costs by more than $4 billion (about 20 percent) for the Low Growth scenario and by around $5 billion (almost 19 percent) for the High Growth scenario. In contrast, needs under the SGR benchmark (which does not utilize TERM’s benefit-cost test) increase by less than $5 billion (25 percent) in response to a 25-percent increase in capital costs.
The most significant source of transit investment benefits as assessed by TERM’s benefit-cost analysis is the net cost savings to users of transit services, a key component of which is the value of travel time savings. Consequently, the per-hour value of travel time for transit riders is a key driver of total investment benefits for scenarios that employ TERM’s benefit-cost test. For example, a doubling of the value of time (from $12.50 per hour to $25 per hour) increases total needs for the Low Growth and High Growth scenarios by approximately $1 billion to $3 billion (7 to 10 percent) due to the increase in total benefits relative to costs. Similarly, a halving of the value of time decreases total investment needs for these scenarios by approximately $1 billion to $2 billion each (5 to 6 percent).
Finally, TERM’s benefit-cost test is responsive to the discount rate used to calculate the present value of the streams of investment costs and benefits. For example, reducing the discount rate from the base rate of 7 percent to 3 percent yields an approximately $1-billion (3 to 6 percent) increase in total annual investment needs under the Low Growth and High Growth scenarios, respectively.
| Replacement Condition Thresholds | SGR Benchmark Billions of 2010 Dollars | SGR Benchmark Percent Change From Baseline | Low Growth Scenario Billions of 2010 Dollars | Low Growth Scenario Percent Change From Baseline | High Growth Scenario Billions of 2010 Dollars | High Growth Scenario Percent Change From Baseline |
|---|---|---|---|---|---|---|
| Replace assets later (2.25) | $17.33 | -6.1% | $16.00 | -5.9% | $16.13 | -5.8% |
| Baseline (2.50) | $18.46 | $17.01 | $17.12 | |||
| Replace assets earlier (2.75) | $22.07 | 19.6% | $20.16 | 18.5% | $20.41 | 19.2% |
| Very early asset replacement (3.00) | $26.03 | 41.0% | $23.28 | 36.9% | $23.49 | 37.2% |
Chapter 11
Transportation Serving Federal and Tribal Lands
The Federal government holds title to approximately 650 million acres, or about 30 percent of the total land area of the United States. Additionally, the Federal government holds in trust approximately 55 million acres of land on behalf of Tribal governments. Federal lands are managed by various Federal land management agencies (FLMAs), primarily within the Departments of the Interior, Agriculture, and Defense. Federal lands have many uses, including the facilitation of national defense, recreation, grazing, timber and mineral extraction, energy generation, watershed management, fish and wildlife management, and wilderness maintenance.
More than 8 billion vehicle miles are traveled annually on the Tribal Transportation Program road system, with more than 60 percent of the system unpaved.
Recreation, national defense, travel, tourism, and resource extraction are all dependent on a quality transportation infrastructure. More than 450,000 miles of Federal roads provide access to Federal lands, which also provides opportunities for recreational travel and tourism, protection and enhancement of resources, and sustained economic development in both rural and urban areas.
More than 75 percent of Americans participate in active outdoor recreation each year, contributing $730 billion annually to the U.S. economy. These activities include hunting, fishing, wildlife viewing, biking, hiking, and water sports. In total, there are nearly 1 billion visits annually to Federal lands.
| Federal Agency | Recreation Related Jobs | Recreation Economic Benefits ($ Billion) |
|---|---|---|
| Department of Agriculture | ||
| Forest Service | 205,000 | 13 |
| Department of the Interior | ||
| National Park Service | 258,000 | 39 |
| Fish and Wildlife Service | 27,000 | 2 |
| Bureau of Land Management | 59,000 | 7 |
| Department of Defense | ||
| U.S. Army Corps of Engineers - Civil Works Facilities | 270,000 | 16 |
Many FLMAs are no longer able to meet the transportation demands placed upon them due to growing traffic volumes and demands for visitor parking at peak times. As population increases, the demand for access to Federal lands will continue to grow. For FLMAs to continue to fulfill their missions of providing visitor enjoyment and conserving precious resources, innovation and creative solutions will be required.
| Agency | Public Paved Road Miles | Paved Road Good | Paved Road Fair | Paved Road Poor | Public Unpaved Road Miles | Public Bridges Total | Public Bridges Structurally Deficient | Backlog of Deferred Maintenance |
|---|---|---|---|---|---|---|---|---|
| Forest Service | 10,700 | 25% | 50% | 25% | 259,300 | 3,840 | 6% | $5.1 billion |
| National Park Service | 5,450 | 60% | 28% | 12% | 4,100 | 1,270 | 3% | $5 billion |
| Bureau of Land Management | 700 | 60% | 20% | 20% | 2,000 | 439 | 3% | $350 million |
| Fish & Wildlife Service | 400 | 59% | 23% | 18% | 5,200 | 281 | 7% | $1 billion |
| Bureau of Reclamation | 762 | N/A | N/A | N/A | 1,253 | 311 | 11% | N/A |
| Bureau of Indian Affairs | 8,800 | N/A | N/A | N/A | 20,400 | 929 | 15% | N/A |
| Tribal Governments | 3,300 | N/A | N/A | N/A | 10,200 | N/A | N/A | N/A |
| Military Installations | 26,000 | N/A | N/A | N/A | N/A | 1,422 | 11% | N/A |
| U.S. Army Corps of Engineers | 5,135 | 55% | 25% | 20% | N/A | 294 | 11% | $100 million |
Chapter 12
Center for Accelerating Innovation
America’s transportation system faces unprecedented challenges. Aging roads and bridges are carrying greater traffic volumes and heavier loads than ever before and need extensive rehabilitation. Limited resources at transportation agencies across the country create the need to work more efficiently and focus on technologies and processes that produce the best results.
Addressing these challenges requires the transportation industry to pursue ways of doing business better, faster, and smarter. It requires harnessing the power of innovation to dramatically change the way highways are built. The Federal Highway Administration (FHWA) Center for Accelerating Innovation, established in 2011, provides national leadership on deploying innovation to meet today’s transportation challenges. The center houses Every Day Counts—FHWA’s initiative to shorten project delivery, enhance roadway safety, and protect the environment—and Highways for LIFE—the agency’s initiative to build roads and bridges better, more safely, and with less impact on the traveling public.
Every Day Counts
The Every Day Counts initiative, launched in 2009, has two key components. The first is accelerating technology and innovation deployment. This involves identifying market-ready technologies that can benefit the highway system and accelerating their widespread use. Within the first 2 years of this initiative, 34 States had adopted Safety EdgeSM as a standard for paving projects, 45 States were in various stages of implementing warm-mix asphalt, 44 States were implementing adaptive signal technology, 675 replacement bridges had been designed or constructed using prefabricated bridge elements and systems, and 85 geosynthetic reinforced soil integrated bridge systems had been designed or constructed.
The second key component of Every Day Counts is shortening project delivery. Within the first 2 years of this initiative, 56 programmatic agreements (which establish streamlined processes for handling routine environmental requirements on common project types) were initiated. Thirteen States had active mitigation banking agreements (for restoring or enhancing wetlands, streams, or other resources to offset unavoidable adverse impacts related to a highway project in another area.) During these 2 years, more than 220 projects were designed and constructed using the design-build or construction manager–general contractor project delivery methods.
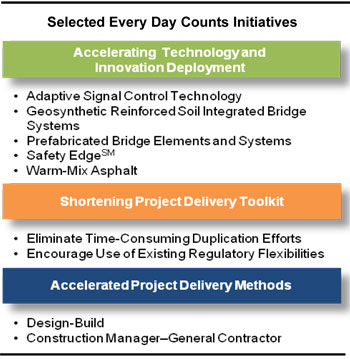
Highways for LIFE
FHWA began to address the critical need for rapid innovation through Highways for LIFE, a pilot program established in 2005 with three goals: to improve safety during and after construction, to reduce congestion caused by construction, and to improve the quality of highway infrastructure.
From fiscal years 2006 to 2012, the program provided incentives totaling about $65 million for 70 projects, including innovations such as accelerated bridge construction techniques, precast concrete pavement systems, and new contracting methods.
Chapter 13
National Fuel Cell Bus Program
This chapter summarizes the accomplishments of fuel cell transit bus research and demonstration projects supported by the FTA through 2011. It describes fuel cell electric bus (FCEB) research projects in the United States and describes their impact on commercialization of fuel cell power systems and electric propulsion for transit buses in general.
FTA sponsors the National Fuel Cell Bus Program (NFCBP), a cooperative research, development, and demonstration program to advance commercialization of FCBs. The NFCBP is a part of a larger FTA research program to improve transit efficiency and contribute to environmentally sustainable transportation. NFCBP projects target research to improve performance and lower costs of next-generation fuel cell systems for transportation.
FTA’s research to develop FCEBs has been underway since 2006. NFCBP projects require a dollar-for-dollar cost share for Federal funds, bringing the size of the program to more than $150 million through FY 2011.
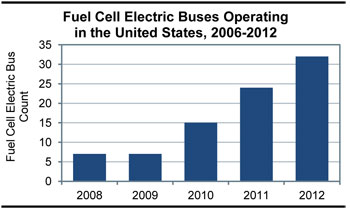
NFCBP accomplishments include:
- Supporting an El Dorado–BAE Systems–Ballard partnership that developed and demonstrated a new FCEB at SunLine and CTA. The new bus meets Buy America requirements and is assembled in Riverside, CA.
- Canadian-based fuel cell manufacturer Ballard Power Systems has established manufacturing capabilities for fuel cell power systems in Lowell, MA.
- The NFCBP funded a project with Connecticut-based fuel cell manufacturer UTC Power to engineer, package, and test a fuel cell power system that can be installed easily into U.S. bus manufacturer models.