

chapter 2
Highway and Bridge System Characteristics
Roads and Bridges by Ownership
Roads and Bridges by Federal System
Highway Travel by Functional Classification
Bridges by Functional Classification
NHS by Functional Classification
Transit System Characteristics
Track, Stations, and Maintenance Facilities
Rural Transit Systems (Section 5311 Providers)
Transit System Characteristics for Americans with Disabilities and the Elderly
Transit System Characteristics: Alternative Fuel Vehicles
Highway and Bridge System Characteristics
The Nation's extensive network of roadways facilitates movement of people and goods, promotes the growth of the American economy, affords access to national and international markets, and supports national defense by providing the means for rapid deployment of military forces and their support systems. The network's bridges allow for the unimpeded movement of traffic over barriers created by geographical features such as rivers.
This chapter explores the characteristics of the Nation's roadways and bridges in terms of ownership, purpose, and usage. Information is presented for the National Highway System (NHS), including its Interstate Highway System component, and for the overall highway system. Separate statistics also are presented for Federal-aid highways, which include roadways and bridges that are generally eligible for Federal assistance under current law. Subsequent sections within this chapter explore the characteristics of bridges and transit systems.
Road statistics reported in this section draw on data collected from States through the Highway Performance Monitoring System (HPMS). The terms highways, roadways, and roads are generally used interchangeably in this section and elsewhere in the report. Roadways within a community with a population of 5,000 or more are classified as urban, while roadways in areas outside urban boundaries are classified as rural.
Tunnels
Under MAP-21, FHWA was charged with establishing a national tunnel inspection program. In 2015, development began on the National Tunnel Inventory database system, and inventory data were collected for all highway tunnels reported. Concurrently, FHWA implemented an extensive program to train inspectors nationwide on tunnel inspection and condition evaluation.
The 2015 preliminary inventory included 473 tunnels. Of these, 271 (57.3 percent ) are on the National Highway System. States own 304 (64.3 percent ) of the tunnels, 83 (17.5 percent ) are owned by Local governments, 77 (16.3 percent ) are owned by Federal agencies, and 9 (1.9 percent ) are owned by others. Further information can be found at https://www.fhwa.dot.gov/bridge/inspection/tunnel/.
Complete inventory and condition data for all tunnels will be collected annually, beginning in 2018, and will be available for use in subsequent C&P reports.
Bridge statistics reported in this section draw on data collected from States through the National Bridge Inventory (NBI). This information details physical characteristics, traffic loads, and the evaluation of the condition of each bridge longer than 20 feet (6.1 meters). As of December 2012, NBI contained records for 607,380 bridges. Data for input to NBI are collected regularly as set forth in the National Bridge Inspection Standards.
System History
Before the 20th century, most Americans lived in rural communities or small cities. Railways and waterways were the leading methods of transporting goods and services because the technology was the cheapest. Most of the Nation's paved roads were located in urban centers that did not connect to other urban centers.
As technology progressed, difficulties in transporting agricultural goods to and between population centers continued. The Department of Agriculture established the Office of Road Inquiry in 1893 to determine ways to expand the national road network. The Office of Road Inquiry was moved to the Department of Commerce and renamed the Bureau of Public Roads in 1918 as the road network continued to grow. The agency's mission however, was to collect information on road construction and maintenance. The Federal role on road construction was confined to creating military roads and trails in remote or frontier areas. States were constructing privately operated toll roads.
Although the need for an interstate network to facilitate economic development and national unity had been identified throughout American history, construction of the system did not begin until the 1950s. The 1956 Federal-Aid Highway Act transformed highway financing by expanding the Federal role. Federal user fees based on the amount of gasoline purchased were deposited into the Highway Trust Fund to help fast track the construction of the Dwight D. Eisenhower National System of Interstate and Defense Highways. The Interstate System accelerated interstate and regional commerce, enhanced the country's competitiveness in international markets, increased personal mobility, facilitated military transportation, and furthered metropolitan development throughout the United States. President Eisenhower wrote in his memoir, "More than any single action by the government since the end of the war, this one would change the face of America. Its impact on the American economy … was beyond calculation."
Roads and Bridges by Ownership

In addition to the Interstate System and National Highway System, federally assisted highway mileage is found on other routes. Based on mileage, State highway agencies own the vast majority of the Interstate and National Highway systems; State highway agencies own 94.1 percent of the Interstate System and 88.1 percent of the National Highway System. In contrast, the Federal government owns only 0.2 percent of the 47,432 Interstate System mileage and 0.2 percent of the 222,946 National Highway System mileage. Local levels of government own the remaining mileage.
State highway agencies own 55.9 percent of the 1,001,874 miles of Federal-aid highways, while the Federal government owns only 0.6 percent of those miles. Local government agencies tend to own Federal-aid highway mileage that is not part of the Interstate and National Highway system.
Source: Highway Statistics HM-16 2012
State and local governments own the vast majority of public roads and bridges. As shown in Exhibit 2-1, local governments own 77.3 percent of the Nation's public road mileage and 50.1 percent of all bridges. State governments own 19.0 percent of public road mileage and 48.2 percent of the Nation's bridges. State and local governments' owning most of the Nation's surface transportation infrastructure is attributed to the construction of lower-volume routes that feed into a larger network eligible for Federal funding. With a match of 20 percent or less, State and local governments leverage Federal assistance to construct larger transportation projects that aid efficient movement throughout the Nation. Although these larger projects are constructed with Federal funding, State and local governments assume ownership responsibilities for maintaining the facilities and keeping them safe for public use.
Exhibit 2-1 Highway and Bridge Ownership by Level of Government
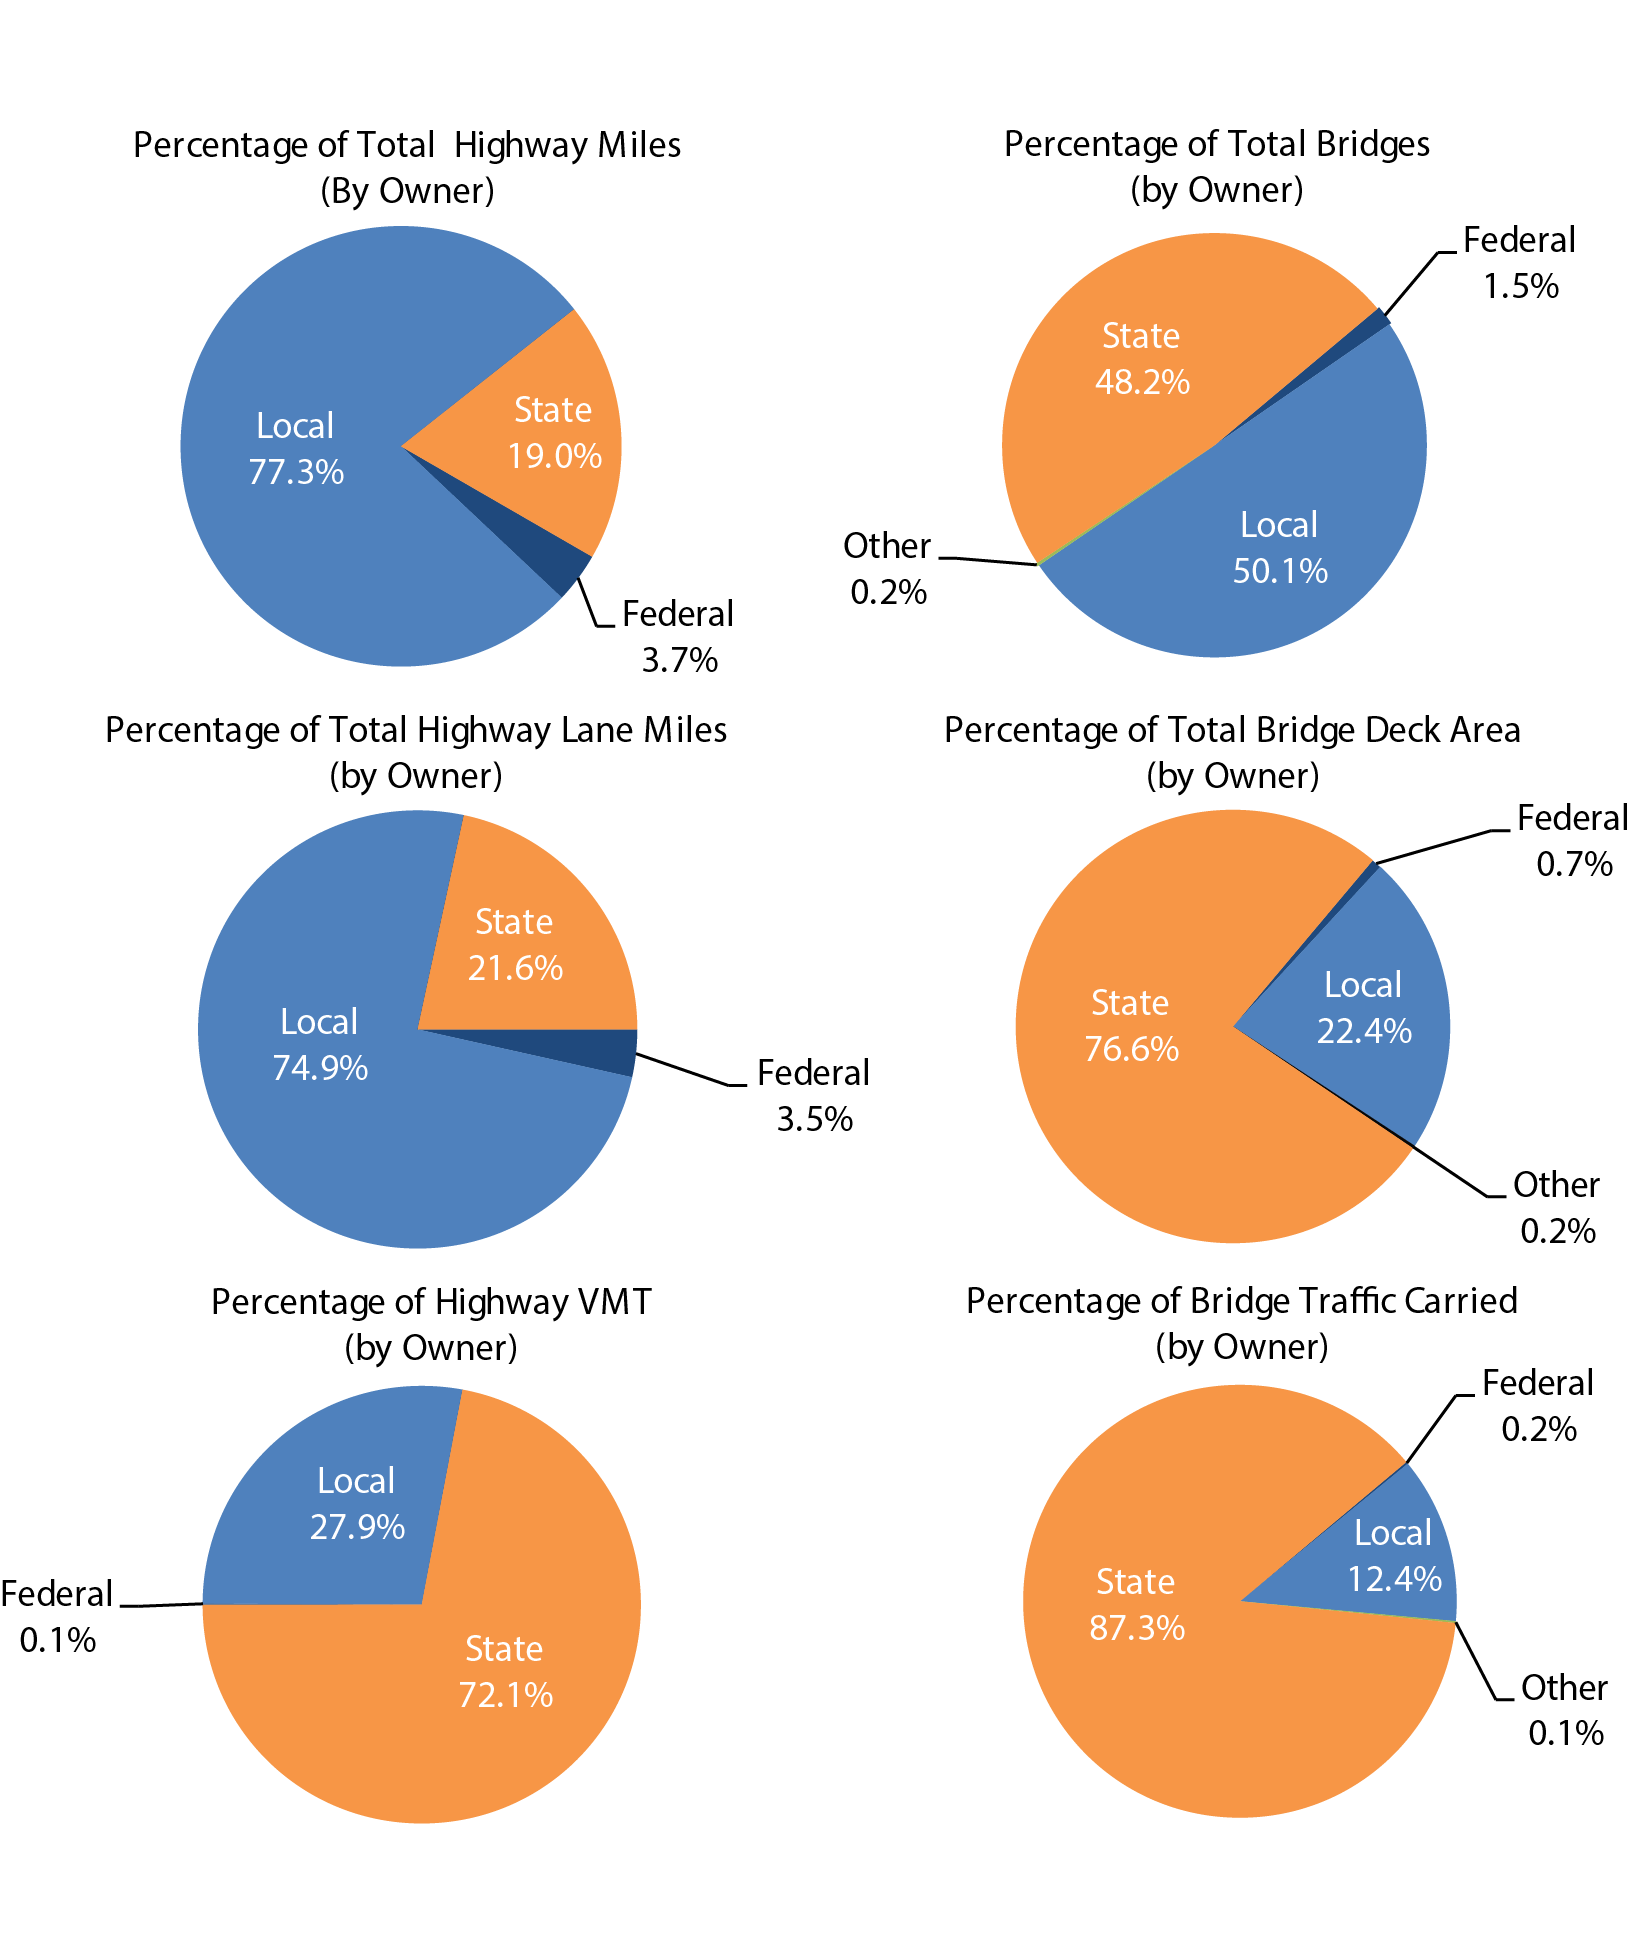
Sources: Highway Performance Monitoring System; National Bridge Inventory.
Federally owned facilities are generally found in National Parks and National Forests, on Indian reservations, and on military bases. Similar to State and local governments' assuming ownership of facilities during construction, federally owned facilities are the responsibility of agencies such as the Department of the Interior and Department of Defense.
The data presented throughout this chapter do not reflect privately owned facilities or facilities not available for public use.
Roads and Bridges by Federal System
The Nation's road network is diversely constructed to fit the needs of its surrounding environment. For example, roads in an urban setting will often have multiple lanes on a facility to support high levels of demand, while a rural setting will have fewer lanes supporting lower traffic levels. Highway mileage measures road distances from one point to another while lane mileage accounts for the number of lanes actually constructed. As shown in Exhibit 2-2, highway mileage and its accompanying lane mileage have increased steadily between 2002 and 2012. With population growth expected throughout the Nation, State and local governments are adding and increasing capacity throughout the road network. As this construction continues, the number of bridges cataloged in NBI has increased 0.3 percent between 2002 and 2012.
Exhibit 2-2 Highway Miles, Lane Miles, Vehicle Miles Traveled, Passenger Miles Traveled, and Bridges, 2002—2012 |
|||||||
|---|---|---|---|---|---|---|---|
| 2002 | 2004 | 2006 | 2008 | 2010 | 2012 | Annual Rate of Change 2012/2002 | |
| Highway Miles | 3,981,670 | 3,997,462 | 4,032,011 | 4,059,352 | 4,083,768 | 4,109,418 | 0.3% |
| Lane Miles | 8,327,108 | 8,372,270 | 8,460,352 | 8,518,776 | 8,616,206 | 8,641,051 | 0.4% |
| VMT (millions) | 2,874,455 | 2,981,998 | 3,033,957 | 2,992,779 | 2,985,095 | 2,987,403 | 0.4% |
| PMT (millions)1 | 4,667,038 | 4,844,452 | 4,929,366 | 4,900,171 | 4,244,833 | 4,274,877 | -0.9% |
| Bridges | 586,930 | 591,707 | 594,101 | 601,506 | 604,493 | 607,380 | 0.3% |
|
1 Values for 2002, 2004, 2006, and 2008 were based on a vehicle occupancy rate of approximately 1.63 based on data from the 2001 National Household Travel Survey (NHTS). Values for 2010 and 2012 were based on a vehicle occupancy rate of approximately 1.42 based on data from the 2009 NHTS. PMT data exclude Puerto Rico. Sources: Highway Performance Monitoring System; Highway Statistics, Table VM-1, various years; National Bridge Inventory. |
|||||||
VMT on the Nation's roads is increasing. In 2013, VMT increased 0.6 percent . VMT increased 1.7 percent in 2014.
FHWA forecasts continual VMT growth based on long-term economic and demographics indicators. These indicators include national economic growth, disposable income growth, population growth, and declining global oil prices. Based on these economic indicators, all types of vehicles are expected to experience an increase in VMT.
Source: FHWA Traffic Volume Trends and FHWA Forecasts of Vehicle Miles Traveled
Vehicle miles traveled (VMT) measures the distance each vehicle traverses the Nation's road network in a year. Passenger miles traveled (PMT) weights travel by the number of occupants in a vehicle. As shown in Exhibit 2-2, total highway VMT grew by 0.4 percent between 2002 and 2012. Annual PMT, however, has decreased 0.9 percent during this period, due to a reduction in average vehicle occupancy and an increase in drivers driving alone. The change in vehicle occupancy was measured in the 2009 National Household Travel Survey, and the new PMT value was used from 2010 on.
Exhibit 2-3 shows annual VMT growth rates between 1992 and 2012. An examination of recent trends shows VMT growth has fluctuated between 2006 and 2012. The negative growth rates can be attributed partially to the period of economic contraction from December 2007 to June 2009 identified by the National Bureau of Economic Research. Now that the economy has stabilized, Americans are beginning to travel more often. Of note, however, is that VMT growth had been trending downward: Annual VMT growth rate last exceeded 3 percent in 1997 and has been less than 1 percent every year since 2004.
Exhibit 2-3 Annual Growth Rates in Vehicle Miles Traveled, 1992—2012
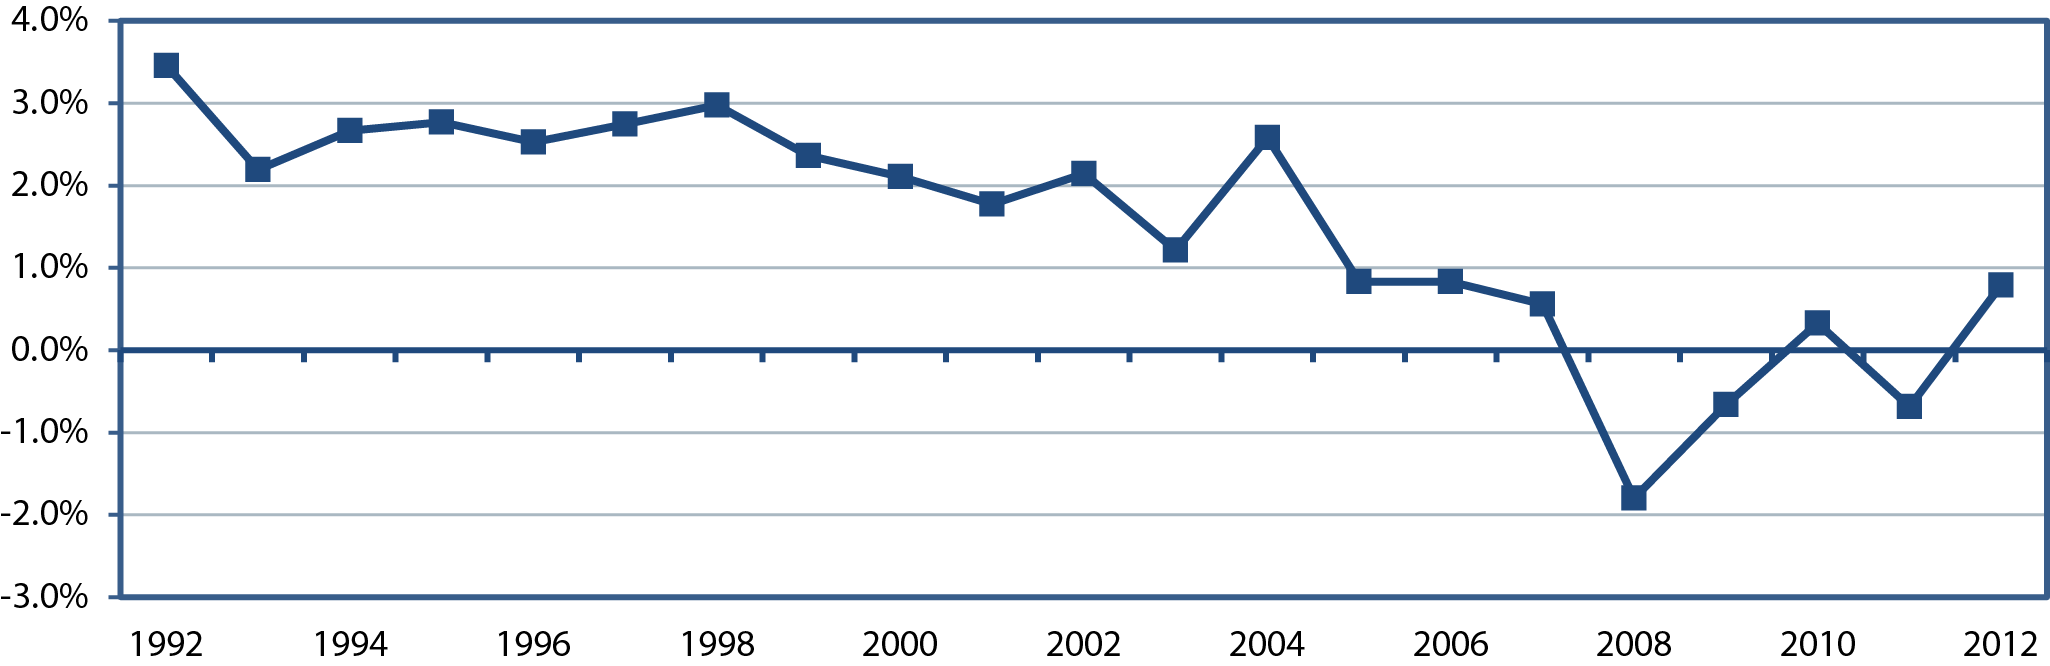
Source: Highway Statistics 2013, Table VM-202.
Federal-Aid Highways
The mileage eligible for Federal-aid highway assistance is much smaller than the total road mileage throughout the Nation. Federal-aid highway assistance mileage, however, consists of longer routes that cross multiple States and facilitate higher traffic volumes at increased speeds. Conversely, non-Federal-aid highway mileage generally consists of shorter and smaller roads that eventually feed into the larger facilities that are eligible for Federal assistance. A discussion on roads eligible for Federal-aid highway assistance is presented later in this section.
As shown in Exhibit 2-4, Federal-aid highways comprised approximately 1.0 million miles in 2012 and facilitated more than 2.5 trillion VMT. Federal-aid highway VMT was similarly affected by the economic impacts of 2007, as shown by comparing total VMT in Exhibit 2-2. This impact occurred primarily because most of the Nation's VMT occurs on Federal-aid highways.
Between 2002 and 2012, highway mileage, lane mileage, VMT, and the number of bridges have increased slightly.
Exhibit 2-4 Federal-Aid Highway Miles, Lane Miles, Vehicle Miles Traveled, and Number of Bridges,
|
|||||||
|---|---|---|---|---|---|---|---|
| Annual Rate of Change | |||||||
| 2002 | 2004 | 2006 | 2008 | 2010 | 2012 | 2012/2002 | |
| Highway Miles | 959,125 | 971,036 | 984,093 | 994,358 | 1,007,777 | 1,005,378 | 0.5% |
| Lane Miles | 2,282,024 | 2,319,417 | 2,364,514 | 2,388,809 | 2,451,140 | 2,433,012 | 0.6% |
| VMT (millions) | 2,430,698 | 2,531,629 | 2,573,956 | 2,534,490 | 2,525,455 | 2,526,558 | 0.4% |
| Bridges | 305,609 | 307,840 | 312,062 | 316,012 | 319,108 | 321,724 | 0.5% |
| Sources: Highway Performance Monitoring System; National Bridge Inventory. | |||||||
National Highway System
With the Interstate System essentially complete, the National Highway System Designation Act of 1995 revised the Federal-aid highway program for the post-Interstate System era. The legislation authorized designation of an NHS that would give priority for Federal resources to roads most important for interstate travel, economic expansion, and national defense; that connect with other modes of transportation; and that are essential to the Nation's role in the international marketplace.
The NHS was designed to be a dynamic system capable of changing in response to future travel and trade demands. States must cooperate with local and regional officials in proposing modifications. In metropolitan areas, local and regional officials must act through metropolitan planning organizations and the State transportation department when proposing modifications. Numerous such modifications are proposed and approved each year.
The NHS has five components. The first, the Interstate System, is the core of the NHS and includes the most traveled routes. The second component includes other principal arterials deemed most important for commerce and trade. The third is the Strategic Highway Network (STRAHNET), which consists of highways important to military mobilization. The fourth is the system of STRAHNET connectors that provide access between major military installations and routes that are part of STRAHNET. The final component consists of intermodal connectors. These roads provide access between major intermodal passenger and freight facilities and the other four subsystems that comprise the NHS.
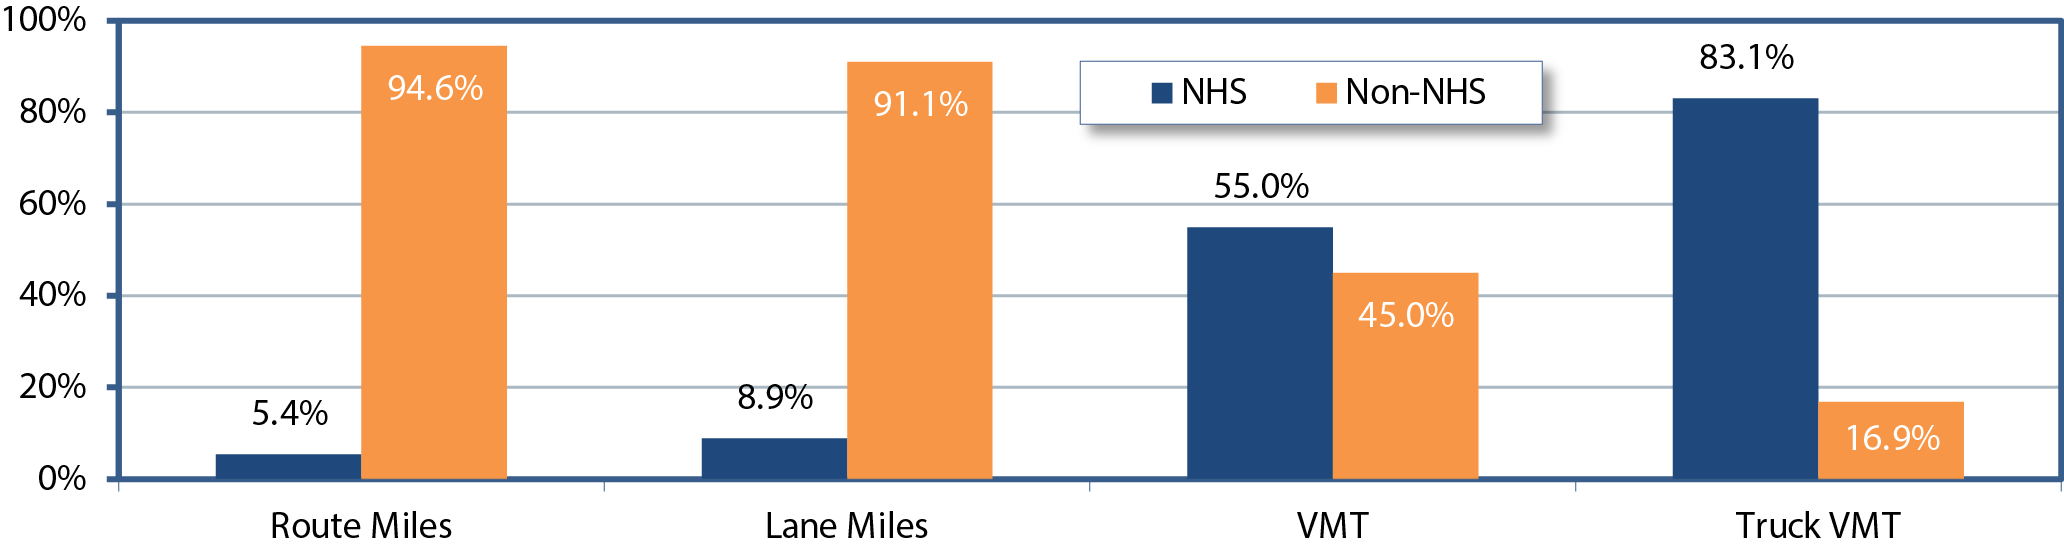
As shown in Exhibit 2-5, only 5.4 percent of the Nation's highway mileage and 8.9 percent of the Nation's lane mileage are located on the NHS. Approximately 55.0 percent of the Nation's VMT, however, occurs on the NHS. The NHS is crucial to truck traffic, which carries cargo long distances, often across multiple State lines. Approximately 83.1 percent of truck VMT occurred on the NHS.
Exhibit 2-5 Share of Highway Miles, Lane Miles, Vehicle Miles Traveled, and Truck Vehicle Miles Traveled On and Off the National Highway System, 20121
1Data reflect the expansion of the NHS required by MAP-21. (Bridge data are not shown as the 2012 National Bridge Inventory data still used the pre-MAP-21 version of the NHS.)
Source: Highway Performance Monitoring System.
MAP-21 Expansion of the NHS
The Moving Ahead for Progress in the 21st Century Act of 2012 (MAP-21) modified the scope and extent of the NHS to include some additional principal arterial and related connector mileage not previously designated as part of the NHS.
The expansion of the NHS to include all principal arterials increased its size from 4.0 percent of the Nation's roadway miles to 5.4 percent . The NHS share of total lane mileage increased from 6.6 percent to 8.9 percent . The share of total VMT carried by the NHS increased from 43.9 percent to 55.0 percent ; for truck VMT, the share carried by the NHS increased from 75.1 percent to 83.1 percent .
In view of the importance of the NHS for truck traffic and freight, State DOTs often will design such highways to accommodate trucks at higher volumes and speeds in the safest and most efficient ways possible. Additionally, NHS highways often are constructed with stronger, more robust materials that enable them to withstand the heavier loads trucks convey.
Interstate System
With the strong support of President Eisenhower, the Federal-Aid Highway Act of 1956 declared the completion of the "National System of Interstate and Defense Highways" was essential to the national interest. The Act committed the Nation to completing the Interstate System within the Federal-State partnership of the Federal-aid highway program, with the State responsible for construction according to approved standards. The Act also resolved the challenging issue of how to pay for construction by establishing the Highway Trust Fund to ensure that revenue from highway user taxes, such as the motor fuels tax, would be dedicated to the Interstate System and other Federal-aid highway and bridge projects.
As shown in Exhibit 2-6, small additions to the Interstate System have occurred between 2002 and 2012 at a rate of 0.2 percent . Lane mileage has also increased by 0.4 percent during this period, suggesting that Interstate capacity has increased slightly.
Exhibit 2-6 Interstate Highway Miles, Lane Miles, Vehicle Miles Traveled, and Numbers of Bridges,
|
|||||||
|---|---|---|---|---|---|---|---|
| 2002 | 2004 | 2006 | 2008 | 2010 | 2012 |
Annual Rate of Change
2012/2002 |
|
| Highway Miles | 46,747 | 46,836 | 46,892 | 47,019 | 47,182 | 47,714 | 0.2% |
| Lane Miles | 210,896 | 212,029 | 213,542 | 214,880 | 217,165 | 220,124 | 0.4% |
| VMT (millions) | 693,941 | 727,163 | 741,002 | 725,213 | 731,095 | 735,914 | 0.6% |
| Bridges | 55,234 | 55,315 | 55,270 | 55,626 | 55,339 | 55,959 | 0.1% |
| Sources: Highway Performance Monitoring System; National Bridge Inventory. | |||||||
Freight System
Freight in America travels over an extensive network of highways, railroads, waterways, pipelines, and airways: 985,000 miles of Federal-aid highways, 141,000 miles of railroads, 11,000 miles of inland waterways, and 1.6 million miles of pipelines. The Nation has more than 19,000 airports, with approximately 540 serving commercial operations, and more than 5,000 coastal, Great Lakes, and inland waterway facilities moving cargo. Although specific commodities are likely to be moved on a particular mode or series of modes, a complex multimodal system is required to meet fully the growing volume of bulk and high-velocity, high-value goods in the United States.
The U.S. freight highway transportation system is, in the broadest sense, composed of all Federal, State, local (county or municipal), and private roads that facilitate the movement of freight-hauling trucks or commercial vehicles. The National Network, however, is the system of roadways officially designated to accommodate commercial freight-hauling vehicles. The National Network was authorized by the Surface Transportation Assistance Act of 1982, and specified in the U.S. Code of Federal Regulations. 23 CFR 658 is the requirement that States allow conventional combinations on the Interstate System and those portions of the Federal-aid Primary System serving to link principal cities and densely developed portions of the States on high volume routes utilized extensively by large vehicles for interstate commerce. Conventional combinations are tractors with one semitrailer up to 48 feet in length or with one 28-foot semitrailer and one 28-foot trailer up to 102 inches wide. Currently, most States allow conventional combination trucks with single trailers up to 53 feet in length to operate without permits on their portions of the National Network (see Exhibit 2-7).
Exhibit 2-7 National Network for Conventional Combination Trucks, 20131,2
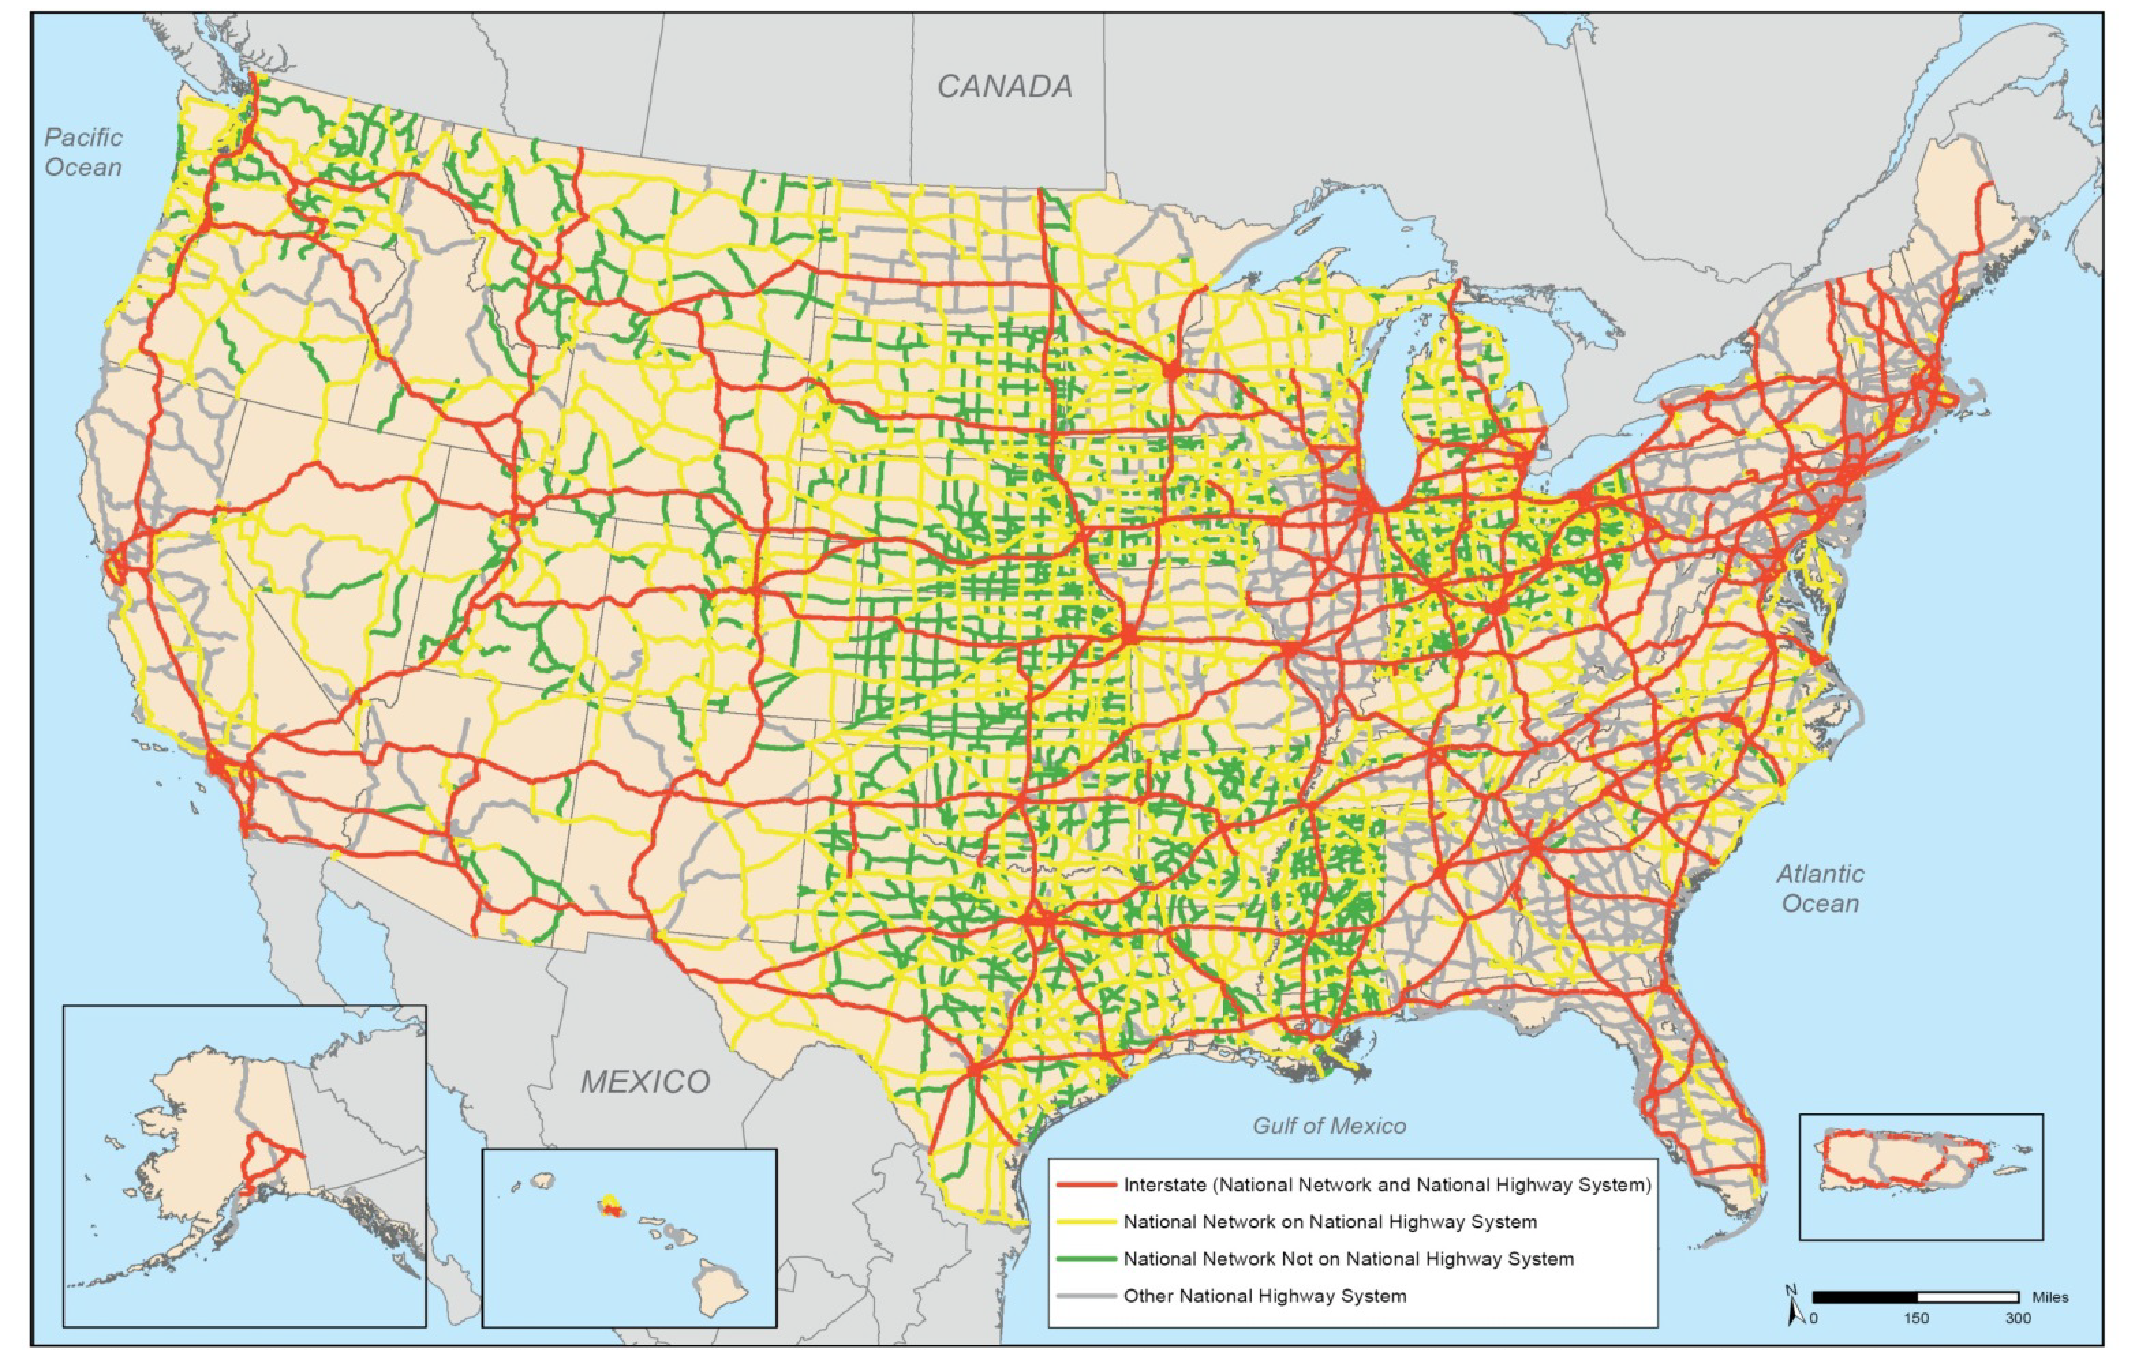
1This map should not be interpreted as the official National Network and should not be used for truck size and weight enforcement purposes. The National Network and the 65,000 miles of highways beyond the NHS, and the NHS encompasses about 50,000 miles of highways that are not part of the National Network.National Highway System (NHS) are approximately 200,000 miles in length, but the National Network includes 65,000 miles of highways beyond the NHS, and the NHS encompasses about 50,000 miles of highways that are not part of the National Network.
2 "Other NHS" refers to NHS mileage that is not included on the National Network. Conventional combination trucks are tractors with one semitrailer up to 48 feet in length or with one 28-foot semitrailer and one 28-foot trailer. Conventional combination trucks can be up to 102 inches wide.
Source: U.S. Department of Transportation, Federal Highway Administration, Office of Freight Management and Operations, Freight Analysis Framework, version 3.4, 2013 (http://ops.fhwa.dot.gov/Freight/freight_analysis/nat_freight_stats/nnnhs2013.htm).
The National Network has remained generally unchanged since its designation in 1982. The network is essential for supporting interstate commerce by maintaining truck access to major industrial centers and freight generators. The National Network differs in extent and purpose from the NHS, which was created more than a decade later by the National Highway System Designation Act of 1995 and modified in 2012 by MAP-21.
The National Network and the NHS share more than 114,000 miles. The National Network includes 65,000 miles of highway not on the NHS, and the NHS includes 50,000 miles not on the National Network. Both the National Network and the NHS were created to support interstate commerce. The National Network protects interstate commerce by ensuring that all States allow certain truck configurations to travel on the system, while the NHS supports long-distance interstate travel such as connecting routes between principal metropolitan areas and industrial centers important to national defense and the national economy.
MAP-21 outlined the requirements for new freight routes and the creation and definition of a highway-focused National Freight Network (NFN). The NFN was intended to include the most important urban, rural, and intercity routes for commercial truck movements. This network overlapped portions of both the National Network and the NHS and includes mileage that is not part of either of those two networks. The NFN consisted of (1) a Primary Freight Network (PFN) that DOT designates, (2) the portions of the Interstate Highway System not selected to be part of the PFN, and (3) Critical Rural Freight Corridors that States designate.
MAP-21 mandated the PFN include no more than 27,000 centerline miles of existing roadways and be defined based on eight factors specified in the legislation. DOT found that these factors did not yield a network representative of the most critical highway elements of the national freight system. DOT had reservations about the limitations of the NFN, and particularly the PFN. In addition to the challenges associated with creating an interconnected PFN that met the 27,000-mile limitation, the MAP-21 NFN provisions did not allow nonhighway modes, such as railroads, waterways, and pipelines, to be included in the NFN.
The FAST Act repealed both the Primary Freight Network and National Freight Network from MAP-21. To replace and improve upon those networks, the FAST Act directed the FHWA Administrator to establish a National Highway Freight Network (NHFN) to strategically direct Federal resources and policies toward improved performance of highway portions of the U.S. freight transportation system. The NHFN includes the following subsystems of roadways:
- Primary Highway Freight System (PHFS): This is a network of highways identified as the most critical highway portions of the U.S. freight transportation system determined by measurable and objective national data. The network consists of 41,518 centerlines miles, including 37,436 centerline miles of Interstate and 4,082 centerline miles of non-Interstate roads.
- Other Interstate portions not on the PHFS: These highways consist of the remaining portion of Interstate roads not included in the PHFS. These routes provide important continuity and access to freight transportation facilities. These portions amount to an estimated 9,511 centerline miles of Interstate, nationwide, and will fluctuate with additions and deletions to the Interstate Highway System.
- Critical Rural Freight Corridors (CRFCs): These are public roads not in an urbanized area that provide access and connection to the PHFS and the Interstate with other important ports, public transportation facilities, or other intermodal freight facilities. These roadways will be identified by State Departments of Transportation.
- Critical Urban Freight Corridors (CUFCs): These are public roads in urbanized areas that provide access and connection to the PHFS and the Interstate with other ports, public transportation facilities, or other intermodal transportation facilities. These roadways will be identified by either State Departments of Transportation or Metropolitan Planning Organizations (MPOs), depending on the population of MPOs' urbanized areas.
After the initial designation, FHWA must redesignate the PHFS every 5 years, with up to 3 percent growth each time.
The FAST Act requires DOT to develop, in consultation with a range of stakeholders, a National Freight Strategic Plan and to update this plan every 5 years. The FAST ACT directed DOT to establish an interim National Multimodal Freight Network to include the NHFN, freight rail systems of Class I railroads, the Great Lakes, the St. Lawrence Seaway, inland and intracoastal waterways, ports and airports that meet specified criteria, and other strategic freight assets. DOT must designate a National Multimodal Freight Network and must redesignate this network every 5 years with input from a wide range of stakeholders.
Roads and Bridges by Purpose
Arterials serve the longest distances with the fewest access points. Because they have the longest distance between other routes, arterials facilitate the highest speed limits. Several functional classifications are included in the arterial category.
Interstates are the highest classification of arterials facilitating the highest level of mobility. Interstates are relatively easy to locate due to their official designation by the Secretary of Transportation.
Other Freeways and Express ways aresimilar to Interstates in that they have directional travel lanes usually separated by a physical barrier. Access and egress points are limited primarily to on- and off-ramps at grade-separated interchanges.
Other Principal Arterials can serve specific land parcels directly and have at-grade intersections with other roadways that are managed by traffic devices.
Minor Arterials, the lowest of arterial classifications, provide service for trips of moderate length and offer connectivity to the higher arterial classifications.
Source: Highway Functional Classification Concepts, Criteria and Procedures 2013
The Nation's roadway system is a vast network that connects places and people within and across national borders. The network serves movements from long-distance freight needs to neighborhood travel. Because of the diverse needs for vehicular travel, the network is categorized under the Highway Functional Classification System. Each functional classification defines the role an element of the network plays in serving travel needs.
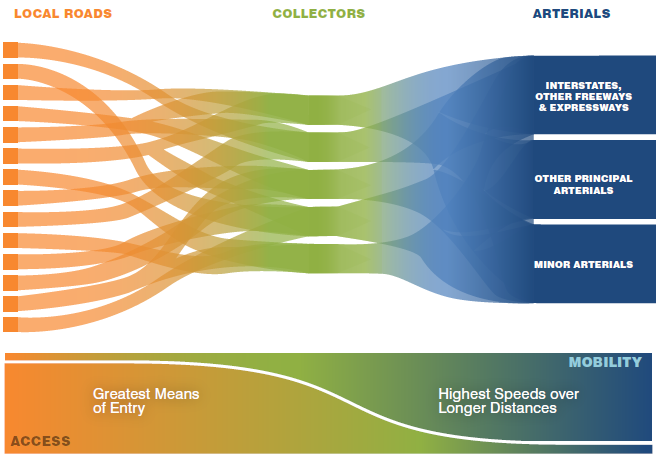
As shown in Exhibit 2-8, roadways serve two primary travel needs: access and mobility. The two concepts are illustrated on both far ends of the exhibit. Access roads enable many roadway users to enter the system at any given time. Access roads can be found in the urban setting next to office buildings or suburban neighborhoods that have a high concentration of residences. Many vehicles entering the network from multiple directions create higher points of friction. Friction points can occur when a vehicle decelerates or stops so another car can enter a roadway. Access streets have lower speeds and more traffic control devices to accommodate traffic traveling shorter distances. Mobility roads allow many users to travel in the same direction on the network. These roads are found in interstate travel or around urban centers to move vehicles quickly. These roads can facilitate higher speed limits over longer distances because fewer opportunities for entry and exit to the road are available.
Any normal trip on the roadway system could use roads that serve different purposes. For example, a traveler can leave a suburban home located on a local street and use an arterial Interstate to commute to an urban office located on a local street. For this commuter to transition from an accessible road to a mobility road, a collector road must be used. Exhibit 2-8 depicts collectors as a bridge between local roads and arterials.
Exhibit 2-8 Functional Classifications
Source: FHWA Functional Classification Guidelines.
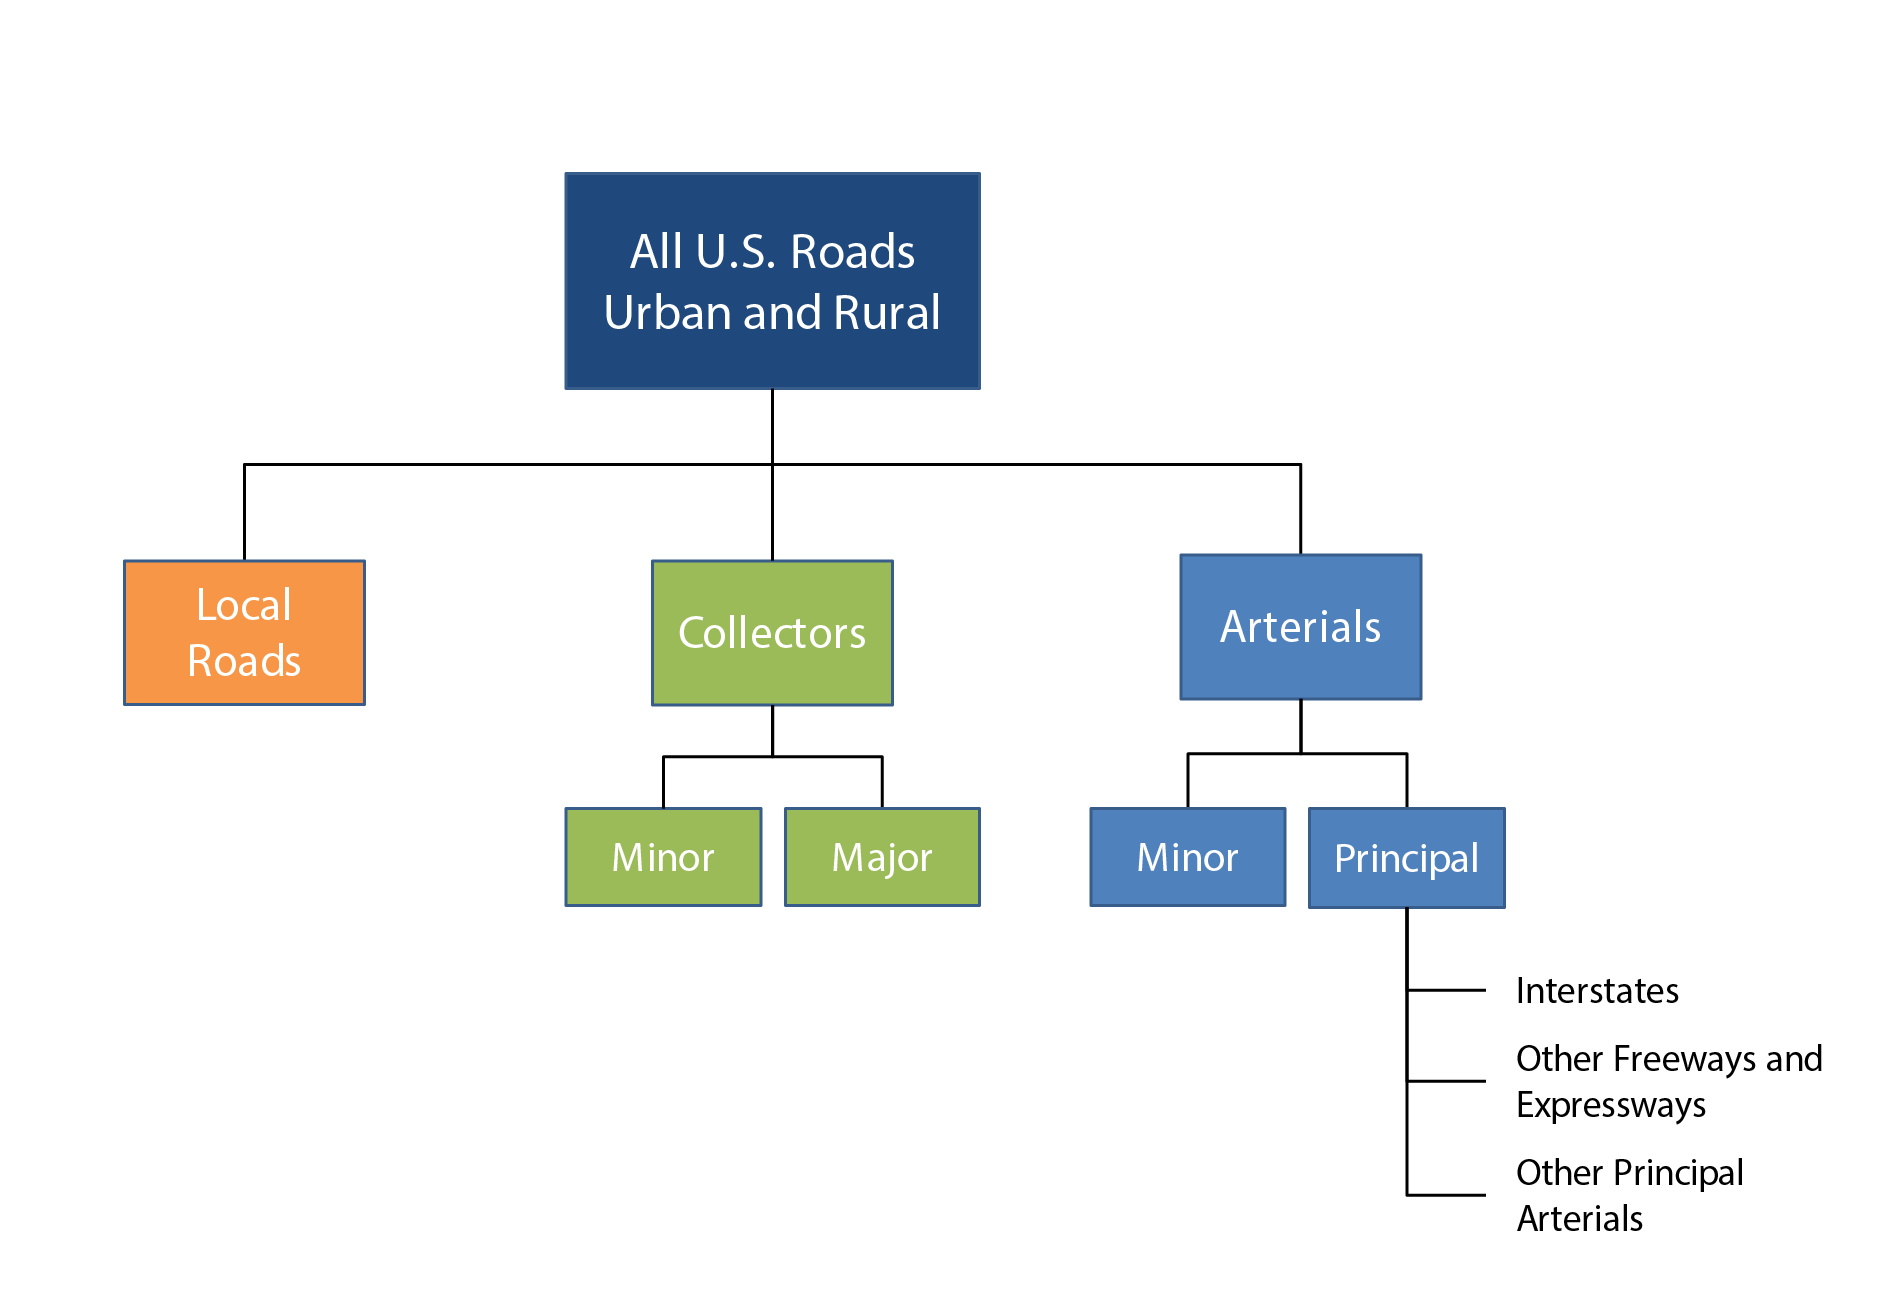
Exhibit 2-9 presents a formal hierarchy of road functional classifications. The functional classifications establish which roads are eligible for Federal-aid highway funding. Although the functional classification definitions do not change for each setting, roads are divided into rural and urban classifications.
The hierarchy continues the access and mobility concepts with collector roads bridging the two. Arterials include both principal and minor arterials. Interstates, other principal arterials, and other freeways and expressways are a component of principal arterials. Within the collector classification, roads are divided into major or minor collectors. All other roads are considered local.
Exhibit 2-9 Highway Functional Classification System Hierarchy
Source: FHWA Functional Classification Guidelines.
Public roads that are functionally classified higher than rural minor collector, rural local, or urban local are eligible for Federal-aid highway assistance. Although bridges follow the hierarchy scheme, they differ in several ways because NBI tracks bridges, while HPMS tracks highways. NBI makes no distinction between urban major and urban minor collectors as HPMS does. Important to note is that MAP-21 allows Federal-aid highway funding to be used on bridges that are not on the Federal-aid highways. States may use funding from their Surface Transportation Program apportionments to fund bridge projects not on Federal-aid highways.
Collectors serve the critical roles of gathering traffic from local roads and funneling vehicles into the arterial network. Although subtly different, two classifications are included in the collector category.
Major Collectorsare longer, have fewer points of access, have higher speed limits, and can have more travel lanes.
Minor Collectorsis the classification for collectors not classified as major collectors. One distinction between the two classifications is that minor collectors are focused more on access than on mobility.
Source: Highway Functional Classification Concepts, Criteria and Procedures 2013
System Characteristics
As stated earlier in this section, local governments own most of the Nation's highway mileage and bridges, due to the large amount of mileage classified as local roads that feed into larger facilities. Local governments tend to own shorter and less traveled roads. As shown in Exhibit 2-10, the highest share of the 2012 highway mileage was classified as local, with 49.9 percent in rural areas and 19.4 in urban areas. The share of 2012 VMT on roads classified as local, however, was only 4.4 percent in rural areas and 9.3 percent in urban areas.
Exhibit 2-10 Percentages of Highway Miles, Lane Miles, Vehicle Miles Traveled, Bridges, Bridge Deck Area, and Bridge Traffic by Functional System, 2012 |
||||||
|---|---|---|---|---|---|---|
| Functional System | Highway Miles | Highway Lane Miles | Highway VMT | Bridges | Bridge Deck Area | Bridge Traffic Volume |
| Rural Areas (4,999 or less in population) | ||||||
| Interstate | 0.7% | 1.4% | 8.2% | 4.1% | 6.9% | 8.9% |
| Other Freeway and Expressway | 0.1% | 0.2% | 0.7% | |||
| Other Principal Arterial | 2.2% | 2.8% | 6.8% | |||
| Other Principal Arterial1 | 6.0% | 8.9% | 5.8% | |||
| Minor Arterial | 3.3% | 3.3% | 5.0% | 6.4% | 6.1% | 3.2% |
| Major Collector | 10.3% | 9.8% | 5.9% | 15.3% | 9.1% | 3.1% |
| Minor Collector | 6.4% | 6.1% | 1.8% | 7.9% | 3.2% | 0.8% |
| Local | 49.9% | 47.3% | 4.4% | 33.8% | 9.4% | 1.4% |
| Subtotal Rural Areas | 72.9% | 70.9% | 32.8% | 73.6% | 43.6% | 23.3% |
| Urban Areas (5,000 or more in population) | ||||||
| Interstate | 0.5% | 1.1% | 16.5% | 5.1% | 19.4% | 35.8% |
| Other Freeway and Expressway | 0.2% | 0.7% | 7.5% | 3.3% | 10.8% | 16.4% |
| Other Principal Arterial | 1.6% | 2.7% | 15.4% | 4.6% | 11.4% | 11.9% |
| Minor Arterial | 2.6% | 3.3% | 12.5% | 4.7% | 7.5% | 7.3% |
| Collector1 | 3.4% | 3.5% | 2.8% | |||
| Major Collector | 2.8% | 2.9% | 5.9% | |||
| Minor Collector | 0.0% | 0.1% | 0.1% | |||
| Local | 19.4% | 18.3% | 9.3% | 5.4% | 3.8% | 2.4% |
| Subtotal Urbanized Areas | 27.1% | 29.1% | 67.2% | 26.4% | 56.4% | 76.7% |
| Total | 100.0% | 100.0% | 100.0% | 100.0% | 100.0% | 100.0% |
|
1 Highway data reflects revised HPMS functional classifications. Bridge data still uses the previous classifications, so that rural Other Freeway and Expressway is included as part of the rural Other Principal Arterial category, and urban Major Collector and urban Minor Collector are combined into a single urban Collector category. Sources: Highway Performance Monitoring System; National Bridge Inventory. |
||||||
Exhibit 2-10 also details the breakdown of travel occurring in rural and urban settings. Urban areas with populations greater than 5,000 have a higher share of VMT and lower highway mileage because urban settings tend to be more consolidated environments. With higher population concentrations, more vehicles use the highway mileage in urban areas. Alternatively, rural areas have a higher share of the highway mileage to provide connectivity between areas with lower population density.
Local Roadsare any road not classified as an arterial or collector. They are not intended for use in long-distance travel, except at the origination or termination of a trip. Local roads are often designed to discourage through traffic.
Source: Highway Functional Classification Concepts, Criteria and Procedures 2013
Although Interstate highway mileage comprises only 1.2 percent of the Nation's highway mileage, it receives the Nation's highest share of VMT by classification at 24.7 percent . Interstate bridges also receive the highest share of bridge traffic volume by classification with 44.7 percent .
As shown in Exhibit 2-11, the Nation's public highways comprised nearly 4.11 million miles in 2012, up from 3.98 million miles in 2002. Total mileage in urban areas grew by an average annual rate of 2.2 percent between 2002 and 2012. Highway miles in rural areas, however, decreased at an average annual rate of 0.3 percent during the same period.
Exhibit 2-11 Highway Route Miles by Functional System, 2002—2012 |
|||||||
|---|---|---|---|---|---|---|---|
|
Annual Rate
of Change
2012/2002 |
|||||||
| Functional System | 2002 | 2004 | 2006 | 2008 | 2010 | 2012 | |
| Rural Areas (less than 5,000 in population) | |||||||
| Interstate | 33,107 | 31,477 | 30,615 | 30,227 | 30,260 | 30,564 | -0.8% |
| Other Freeway & Expressway1 | 3,299 | 4,395 | |||||
| Other Principal Arterial1 | 92,131 | 91,462 | |||||
| Other Principal Arterial1 | 98,945 | 95,998 | 95,009 | 95,002 | -0.3% | ||
| Minor Arterial | 137,855 | 135,683 | 135,589 | 135,256 | 135,681 | 135,328 | -0.2% |
| Major Collector | 431,754 | 420,293 | 419,289 | 418,473 | 418,848 | 419,353 | -0.3% |
| Minor Collector | 271,371 | 268,088 | 262,966 | 262,852 | 263,271 | 262,435 | -0.3% |
| Local | 2,106,725 | 2,051,902 | 2,046,796 | 2,038,517 | 2,036,990 | 2,039,276 | -0.3% |
| Subtotal Rural Areas | 3,079,757 | 3,003,441 | 2,990,264 | 2,980,327 | 2,980,480 | 2,982,813 | -0.3% |
| Urban Areas (5,000 or more in population) | |||||||
| Interstate | 13,640 | 15,359 | 16,277 | 16,789 | 16,922 | 17,150 | 2.3% |
| Other Freeway and Expressway | 9,377 | 10,305 | 10,817 | 11,401 | 11,371 | 11,521 | 2.1% |
| Other Principal Arterial | 53,680 | 60,088 | 63,180 | 64,948 | 65,505 | 65,593 | 2.0% |
| Minor Arterial | 90,922 | 98,447 | 103,678 | 107,182 | 108,375 | 109,337 | 1.9% |
| Collector1 | 89,846 | 103,387 | 109,639 | 115,087 | 3.0% | ||
| Major Collector1 | 115,538 | 116,943 | |||||
| Minor Collector1 | 3,303 | 3,588 | |||||
| Local | 644,449 | 706,436 | 738,156 | 763,618 | 782,273 | 802,473 | 2.2% |
| Subtotal Urban Areas | 901,913 | 994,021 | 1,041,747 | 1,079,025 | 1,103,288 | 1,126,605 | 2.2% |
| Total Highway Route Miles | 3,981,670 | 3,997,462 | 4,032,011 | 4,059,352 | 4,083,768 | 4,109,418 | 0.3% |
|
1 Starting in 2010, the HPMS data reflect revised functional classifications. Rural Other Freeway and Expressway has been split from the rural Other Principal Arterial category, and urban Collector has been split into urban Major Collector and urban Minor Collector. The annual rate of change was computed based on the older combined categories. Source: Highway Performance Monitoring System. |
|||||||
In addition to the construction of new roads, two factors have continued to contribute to the increase in urban highway mileage. First, based on the decennial census, more people are living in urban areas, and thus urban boundaries have expanded. This expansion has resulted in the reclassification of some mileage from rural to urban. States have implemented these boundary changes in their HPMS data reporting gradually. As a result, the impact of the census-based changes on these statistics is not confined to a single year. Second, greater focus has been placed on Federal agencies to provide a more complete reporting of federally owned mileage.
Exhibit 2-12 details lane mileage by functional system and population size. Lane mileage represents the length of the roadway multiplied by the number of lanes on that roadway. Because 72.9 percent of the Nation's highway mileage is located in rural areas, lane mileage is also higher in rural areas. Local roads in urban and rural settings also continue to have the highest share of the Nation's lane mileage. Lane mileage in urban areas increased 2.3 percent between 2002 and 2012, while lane mileage in rural areas decreased 0.3 percent during the same period.
Exhibit 2-12 Highway Lane Miles by Functional System, 2002—2012 |
|||||||
|---|---|---|---|---|---|---|---|
| Functional System | Highway Lane Miles |
Annual Rate
of Change
2012/2002 |
|||||
| 2002 | 2004 | 2006 | 2008 | 2010 | 2012 | ||
| Rural Areas (less than 5,000 in population) | |||||||
| Interstate | 135,032 | 128,012 | 124,506 | 122,956 | 123,762 | 124,927 | -0.8% |
| Other Freeway and Expressway1 | 11,907 | 16,593 | |||||
| Other Principal Arterial1 | 243,065 | 240,639 | |||||
| Other Principal Arterial1 | 256,458 | 249,480 | 248,334 | 250,153 | 0.03% | ||
| Minor Arterial | 288,391 | 283,173 | 282,397 | 281,071 | 287,761 | 281,660 | -0.2% |
| Major Collector | 868,977 | 845,513 | 843,262 | 841,353 | 857,091 | 842,722 | -0.3% |
| Minor Collector | 542,739 | 536,177 | 525,932 | 525,705 | 526,540 | 524,870 | -0.3% |
| Local | 4,213,448 | 4,103,804 | 4,093,592 | 4,077,032 | 4,073,980 | 4,078,552 | -0.3% |
| Subtotal Rural Areas | 6,305,044 | 6,146,159 | 6,118,023 | 6,098,270 | 6,124,107 | 6,109,963 | -0.3% |
| Urban Areas (5,000 or more in population) | |||||||
| Interstate | 75,864 | 84,016 | 89,036 | 91,924 | 93,403 | 95,197 | 2.3% |
| Other Freeway and Expressway | 43,467 | 47,770 | 50,205 | 53,073 | 53,231 | 54,160 | 2.2% |
| Other Principal Arterial | 188,525 | 210,506 | 221,622 | 228,792 | 235,127 | 234,469 | 2.2% |
| Minor Arterial | 233,194 | 250,769 | 269,912 | 274,225 | 285,954 | 283,608 | 2.0% |
| Collector1 | 192,115 | 220,177 | 235,240 | 245,262 | 3.0% | ||
| Major Collector1 | 252,435 | 250,760 | |||||
| Minor Collector1 | 7,404 | 7,948 | |||||
| Local | 1,288,898 | 1,412,872 | 1,476,314 | 1,527,230 | 1,564,546 | 1,604,946 | 2.2% |
| Subtotal Urban Areas | 2,022,064 | 2,226,111 | 2,342,329 | 2,420,506 | 2,492,099 | 2,531,088 | 2.3% |
| Total Highway Lane Miles | 8,327,108 | 8,372,270 | 8,460,352 | 8,518,776 | 8,616,206 | 8,641,051 | 0.4% |
|
1 Starting in 2010, the HPMS data reflects revised functional classifications. Rural Other Freeway and Expressway has been split from the rural Other Principal Arterial category, and urban Collector has been split into urban Major Collector and urban Minor Collector. The annual rate of change was computed based on the older combined categories. Source: Highway Performance Monitoring System. |
|||||||
Highway Travel by Functional Classification
With regard to VMT and individual functional classifications, rural and urban areas also differ. Exhibit 2-13 details VMT trends by functional classification between 2002 and 2012. Urban area VMT increased 1.4 percent in that span, while rural area VMT decreased 1.5 percent . Interstate with Other Freeway and Expressway in urban areas had the biggest increase of VMT share with 1.7 percent . Major collectors in rural areas had the greatest decrease of VMT share at 2.0 percent . VMT in 2012 was more than 2.98 trillion, a 0.4-percent increase from the 2.87 trillion VMT in 2002.
Exhibit 2-13 Vehicle Miles Traveled by Functional System, 2002—2012 |
|||||||
|---|---|---|---|---|---|---|---|
| Functional System | Annual Travel Distance (Millions of Miles) |
Annual Rate of Change 2012/2002 |
|||||
| 2002 | 2004 | 2006 | 2008 | 2010 | 2012 | ||
| Rural Areas (less than 5,000 in population) | |||||||
| Interstate | 281,461 | 267,397 | 258,324 | 243,693 | 246,109 | 246,334 | -1.3% |
| Other Freeway & Expressway1 | 19,603 | 20,146 | |||||
| Other Principal Arterial1 | 205,961 | 203,310 | |||||
| Other Principal Arterial1 | 258,009 | 241,282 | 232,224 | 222,555 | -1.4% | ||
| Minor Arterial | 177,139 | 169,168 | 162,889 | 152,246 | 151,307 | 148,956 | -1.7% |
| Major Collector | 214,463 | 200,926 | 193,423 | 186,275 | 176,301 | 175,838 | -2.0% |
| Minor Collector | 62,144 | 60,278 | 58,229 | 55,164 | 53,339 | 53,215 | -1.5% |
| Local | 139,892 | 132,474 | 133,378 | 131,796 | 132,827 | 130,124 | -0.7% |
| Subtotal Rural Areas | 1,133,107 | 1,071,524 | 1,038,467 | 991,729 | 985,447 | 977,923 | -1.5% |
| Urban Areas (5,000 or more in population) | |||||||
| Interstate | 412,481 | 459,767 | 482,677 | 481,520 | 482,726 | 489,580 | 1.7% |
| Other Freeway and Expressway | 190,641 | 209,084 | 218,411 | 223,837 | 221,902 | 225,098 | 1.7% |
| Other Principal Arterial | 410,926 | 453,868 | 470,423 | 465,965 | 460,753 | 460,302 | 1.1% |
| Minor Arterial | 341,958 | 365,807 | 380,069 | 380,734 | 378,048 | 374,915 | 0.9% |
| Collector1 | 143,621 | 164,330 | 175,516 | 177,665 | -0.7% | ||
| Major Collector1 | 178,909 | 177,217 | |||||
| Minor Collector1 | 3,837 | 4,476 | |||||
| Local | 241,721 | 257,617 | 268,394 | 271,329 | 273,474 | 277,892 | 1.4% |
| Subtotal Urban Areas | 1,741,348 | 1,910,473 | 1,995,489 | 2,001,050 | 1,999,648 | 2,009,480 | 1.4% |
| Total VMT | 2,874,455 | 2,981,998 | 3,033,957 | 2,992,779 | 2,985,095 | 2,987,403 | 0.4% |
|
1 Starting in 2010, the HPMS data reflects revised functional classifications. Rural Other Freeway and Expressway has been split from the rural Other Principal Arterial category, and urban Collector has been split into urban Major Collector and urban Minor Collector. The annual rate of change was computed based on the older combined categories. Source: Highway Performance Monitoring System. |
|||||||
Exhibit 2-14 provides an analysis of the types of vehicles comprising the Nation's VMT between 2008 and 2012. Three types of vehicles are identified: passenger vehicles, which include motorcycles, buses, and light trucks (two-axle, four-tire models); single-unit trucks having six or more tires; and combination trucks, including trailers and semitrailers. Passenger vehicle travel accounted for 91.0 percent of total VMT in 2012; combination trucks accounted for 5.5 percent of VMT during this period; and single-unit trucks accounted for the remaining 3.5 percent. The share of truck travel on the rural interstates is considerably higher; in 2012, single-unit and combination trucks together accounted for 23.6 percent of total VMT on the rural Interstates.
Passenger vehicle travel grew at an average annual rate of 0.3 percent from 2008 to 2012. Over the same period, combination truck traffic declined by 2.9 percent per year, and single-unit truck traffic declined by 4.6 percent per year. The decrease in combination truck traffic occurred mostly in urban areas; single-unit truck traffic decreased in both rural and urban areas, but the change was more pronounced in urban areas. Direct comparisons over a longer period cannot be made due to significant revisions to the methodology for estimating vehicle distribution implemented in 2007.
Exhibit 2-14 Highway Travel by Functional System and Vehicle Type, 2008—20121,2 |
||||
|---|---|---|---|---|
| Functional System Vehicle Type | 2008 | 2010 | 2012 |
Annual Rate of Change 2012/2008 |
| Rural | ||||
| Interstate | ||||
| Passenger Vehicles | 181,278 | 185,212 | 187,932 | 0.9% |
| Single-Unit Trucks | 11,970 | 11,206 | 9,249 | -6.2% |
| Combination Trucks | 49,973 | 49,229 | 48,691 | -0.6% |
| Other Arterial | ||||
| Passenger Vehicles | 322,288 | 324,467 | 325,071 | 0.2% |
| Single-Unit Trucks | 20,176 | 18,922 | 17,194 | -3.9% |
| Combination Trucks | 31,771 | 33,023 | 29,689 | -1.7% |
| Other Rural | ||||
| Passenger Vehicles | 335,206 | 327,748 | 326,522 | -0.7% |
| Single-Unit Trucks | 19,286 | 18,059 | 17,961 | -1.8% |
| Combination Trucks | 16,287 | 16,281 | 14,316 | -3.2% |
| Total Rural | ||||
| Passenger Vehicles | 838,772 | 837,428 | 839,525 | 0.0% |
| Single-Unit Trucks | 51,431 | 48,188 | 44,404 | -3.6% |
| Combination Trucks | 98,031 | 98,532 | 92,696 | -1.4% |
| Urban | ||||
| Interstate | ||||
| Passenger Vehicles | 423,699 | 427,395 | 434,394 | 0.6% |
| Single-Unit Trucks | 16,752 | 14,485 | 14,539 | -3.5% |
| Combination Trucks | 35,663 | 35,812 | 35,614 | -0.03% |
| Other Urban | ||||
| Passenger Vehicles | 1,403,376 | 1,415,087 | 1,426,578 | 0.4% |
| Single-Unit Trucks | 58,672 | 48,001 | 46,018 | -5.9% |
| Combination Trucks | 50,131 | 41,567 | 35,047 | -8.6% |
| Total Urban | ||||
| Passenger Vehicles | 1,827,075 | 1,842,482 | 1,860,972 | 0.5% |
| Single-Unit Trucks | 75,423 | 62,486 | 60,557 | -5.3% |
| Combination Trucks | 85,794 | 77,379 | 70,662 | -4.7% |
| Total | ||||
| Passenger Vehicles | 2,665,848 | 2,679,910 | 2,700,497 | 0.3% |
| Single-Unit Trucks | 126,855 | 110,674 | 104,961 | -4.6% |
| Combination Trucks | 183,826 | 175,911 | 163,358 | -2.9% |
|
1 Data do not include Puerto Rico. 2 The procedures used to develop estimates of travel by vehicle type have been significantly revised; the data available do not support direct comparisons prior to 2007. Source: Highway Statistics, various years, Table VM-1. |
||||
Bridges by Functional Classification
The Nation's bridges help travelers traverse what would be geographical challenges. Bridges help provide travelers a more direct route to their destination. These direct routes help move passengers and goods efficiently, benefiting the Nation's economic productivity and output.
Exhibit 2-15 presents the number of bridges by functional classification between 2002 and 2012. These bridges are identified by NBI and are at least 20 feet long. The number of bridges increased 0.3 percent from 591,243 to 607,380. Less than three-quarters of the Nation's bridges are located in rural areas with most classified as local. The annual rate of change of bridge numbers in rural areas between 2002 and 2012 decreased 0.2 percent . Bridges in urban areas have increased 1.7 percent in the same period, with the largest increase occurring on urban collectors (3.1 percent).
Exhibit 2-15 Number of Bridges by Functional System, 2002—2012 |
|||||||
|---|---|---|---|---|---|---|---|
| Functional System | 2002 | 2004 | 2006 | 2008 | 2010 | 2012 |
Annual Rate
of Change 2012/2002 |
| Rural | |||||||
| Interstate | 27,310 | 27,648 | 26,633 | 25,997 | 25,223 | 25,201 | -0.8% |
| Other Principal Arterial | 35,215 | 36,258 | 35,766 | 35,594 | 36,084 | 36,460 | 0.3% |
| Minor Arterial | 39,571 | 40,197 | 39,521 | 39,079 | 39,048 | 39,123 | -0.1% |
| Major Collector | 94,766 | 94,079 | 93,609 | 93,118 | 93,059 | 92,875 | -0.2% |
| Minor Collector | 49,309 | 49,391 | 48,639 | 48,242 | 47,866 | 47,922 | -0.3% |
| Local | 209,358 | 208,641 | 207,130 | 205,959 | 205,609 | 205,192 | -0.2% |
| Subtotal Rural | 455,529 | 456,214 | 451,298 | 447,989 | 446,889 | 446,773 | -0.2% |
| Urban | |||||||
| Interstate | 27,924 | 27,667 | 28,637 | 29,629 | 30,116 | 30,758 | 1.0% |
| Other Freeway and Expressway | 16,843 | 17,112 | 17,988 | 19,168 | 19,791 | 20,139 | 1.8% |
| Other Principal Arterial | 24,301 | 24,529 | 26,051 | 26,934 | 27,373 | 28,141 | 1.5% |
| Minor Arterial | 24,510 | 24,802 | 26,239 | 27,561 | 28,103 | 28,437 | 1.5% |
| Collectors | 15,169 | 15,548 | 17,618 | 18,932 | 20,311 | 20,590 | 3.1% |
| Local | 26,592 | 27,940 | 29,508 | 31,183 | 31,877 | 32,540 | 2.0% |
| Subtotal Urban | 135,339 | 137,598 | 146,041 | 153,407 | 157,571 | 160,605 | 1.7% |
| Unclassified | 375 | 288 | 222 | 110 | 33 | 2 | |
| Total | 591,243 | 594,100 | 597,561 | 601,506 | 604,493 | 607,380 | 0.3% |
| Source: National Bridge Inventory. | |||||||
NHS by Functional Classification
As noted earlier in this section, most of the Nation's road mileage is located outside the NHS and on highways other than Federal-aid highways. As shown in Exhibit 2-16, 5.4 percent of the Nation's road mileage is on the NHS, while only 8.9 percent of the Nation's lane mileage is located on the NHS. Of the Nation's VMT, however, 55.0 percent occurs on the NHS.
The highest share of VMT on the NHS occurs on urban area Interstate facilities and urban area other principal arterials. This observation suggests that a substantial portion of the Nation's VMT occurs during morning and afternoon commutes to urban centers. In rural areas, the highest share of VMT also occurs on Interstate and other principal arterials systems.
The NHS encompasses all of the Interstate System and almost all of the facilities classified as other freeway and expressway, and other principal arterial. Local road mileage and other mileage classified lower than principal arterial represent NHS intermodal connectors.
Exhibit 2-16 Highway Route Miles, Lane Miles, and Vehicle Miles Traveled on the National Highway System Compared with All Roads, by Functional System, 20121 |
||||||
|---|---|---|---|---|---|---|
| Functional System | Route Miles | Lane Miles | VMT (Millions) | |||
| Total on NHS | percent on NHS | Total on NHS | percent on NHS | Total on NHS | percent on NHS | |
| Rural NHS | ||||||
| Interstate | 30,564 | 100.0% | 124,927 | 100.0% | 246,334 | 100.0% |
| Other Freeway and Expressway | 4,284 | 97.5% | 16,547 | 99.7% | 20,115 | 99.8% |
| Other Principal Arterial | 91,181 | 99.7% | 239,899 | 99.7% | 202,580 | 99.6% |
| Minor Arterial | 2,630 | 1.9% | 6,426 | 2.3% | 4,839 | 3.2% |
| Major Collector | 662 | 0.2% | 1,439 | 0.2% | 1,055 | 0.6% |
| Minor Collector | 5 | 0.002% | 9 | 0.002% | 2 | 0.004% |
| Local | 38 | 0.002% | 77 | 0.002% | 15 | 0.01% |
| Subtotal Rural NHS | 129,364 | 4.3% | 389,324 | 6.4% | 474,940 | 48.6% |
| Urban NHS | ||||||
| Interstate | 17,149 | 100.0% | 95,194 | 100.0% | 489,580 | 100.0% |
| Other Freeway and Expressway | 11,404 | 99.0% | 53,665 | 99.1% | 223,353 | 99.2% |
| Other Principal Arterial | 63,407 | 96.7% | 227,208 | 96.9% | 448,105 | 97.4% |
| Minor Arterial | 1,439 | 1.3% | 4,541 | 1.6% | 7,086 | 1.9% |
| Major Collector | 384 | 0.3% | 990 | 0.4% | 1,018 | 0.6% |
| Minor Collector | 9 | 0.3% | 20 | 0.3% | 9 | 0.2% |
| Local | 101 | 0.01% | 242 | 0.02% | 137 | 0.05% |
| Subtotal Urban NHS | 93,893 | 8.3% | 381,860 | 15.1% | 1,169,288 | 58.2% |
| Total NHS | 223,257 | 5.4% | 771,184 | 8.9% | 1,644,228 | 55.0% |
|
1 Data reflect the expansion of the NHS required by MAP-21. Source: Highway Performance Monitoring System. |
||||||
Transit System Characteristics
System History
The first transit systems in the United States date to the late 19th century. These systems were privately owned, for-profit businesses that were instrumental in defining the urban communities of that time. By the postwar period, competition from the private automobile was preventing transit businesses from operating at a profit. As transit businesses started to fail, local, State, and national government leaders began to realize the importance of sustaining transit services. In 1964, Congress passed the Urban Mass Transportation Act, establishing the Urban Mass Transit Agency to administer Federal funding for transit systems. The Act changed the character of the industry by specifying that Federal funds for transit be given to public agencies rather than private firms; this funding shift accelerated the transition from private to public ownership and operation of transit systems. The Act also required local governments to contribute matching funds as a condition for receiving Federal aid for transit services-setting the stage for the multilevel governmental partnerships that characterize today's transit industry.
State government involvement in the provision of transit services is usually through financial support and performance oversight. Some States, however, have undertaken outright ownership and operation of transit services. Connecticut, Georgia, Louisiana, Maryland, Washington, the U.S. Virgin Islands, and Puerto Rico directly own and operate transit systems. Pennsylvania contracts for transit services. New Jersey Transit, a statewide company, and numerous private fixed-route bus systems operate the State's transit services. New Jersey Transit provides buses to private bus systems but is not involved with their operations or oversight.
In 1962, Congress passed legislation requiring the formation of metropolitan planning organizations (MPOs) for urbanized areas with populations greater than 50,000. MPOs are composed of State and local officials who work to address transportation planning needs of urbanized areas at a regional level. Twenty-nine years later, the Intermodal Surface Transportation Efficiency Act of 1991 (ISTEA) made MPO coordination a prerequisite for Federal funding of many transit projects.
In addition, the ISTEA reauthorization made several other changes to transportation law, including changing the name of the Urban Mass Transportation Administration to the Federal Transit Administration (FTA). On the urban side, ISTEA increased transit formula grant funding to all agencies and initiated the use of a formula to allocate capital funds, rather than determine funding allocation on a discretionary project basis. The Act also increased the flexibility in using Highway Trust funds between transit and highway projects.
The Transportation Equity Act for the 21st Century (TEA-21) was passed in 1998 and over the next 6 years increased transit funding by 70 percent . Part of this additional funding was to offset the increased costs of implementing service for persons with disabilities under the Americans with Disabilities Act of 1990 (ADA). The ADA required public transit services to be open to the public without discrimination and to meet all other requirements of the Act. The ADA also further increased the flexibility in the use of Federal funds.
The Safe, Accountable, Flexible, Efficient Transportation Equity Act: A Legacy for Users (SAFETEA-LU) was enacted in 2005. This Act created some new programs-especially for smaller transit providers-and new program definitions. Within the urban formula program, a new formula allocation was added for Small Transit Intensive Cities (STIC). In the new starts program, a Small Starts program was created, encouraging cost-effective alternative approaches to transit projects such as bus rapid transit, rather than more expensive rail systems. In the rural (other than urbanized area) program, funding was greatly increased for rural transit providers, intercity fixed-route bus transportation became eligible for rural funds, and funds were made available for Native American Tribal transit. SAFETEA-LU also made funding available for parks and public lands. SAFETEA-LU extension acts were continued until July 2012.
On July 6, 2012, Congress passed the new Moving Ahead for Progress in the 21st Century (MAP21) reauthorization act, covering Fiscal Years 2013 and 2014. MAP21 is the current law. The law retained the basic structure of the urban formula program, but increased the STIC formula funding and allowed certain smaller systems (100 fixed-route buses or fewer) in large urban systems to use some formula funds for operating expense. MAP21 also added a new factor: the number of low-income individuals. The Act gave FTA safety oversight authority and set aside funds for FTA to create an office for administering a safety oversight program for public transit. Funds for the rural program are to be allocated as in the past, but a service factor-vehicle revenue miles-and a factor for low-income individuals were added to the formula allocation factors. Funds for Tribal transit were increased, and some funds were distributed by a new formula based in part on vehicle revenue miles. The most dramatic change, however, was the elimination of the Fixed-Guideway Modernization capital program and the creation of the new, formula-based State of Good Repair program in its place. The State of Good Repair program would dedicate capital funds to the repair, upgrading, and modernization of the Nation's transit fixed-guideway infrastructure. This fixed-guideway infrastructure would include the Nation's rail transit systems, high-intensity motor bus systems operating on HOV (high occupancy vehicle) lanes, ferries, and bus rapid transit systems. The Act requires transit agencies to develop a capital asset report that inventories their capital assets and evaluates the condition of those assets.
System Infrastructure
Urban Transit Agencies
State and local transit agencies have evolved into several different institutional models. A transit provider can be a unit of a regional transportation agency; operated directly by the State, county, or city government; or an independent agency with an elected or appointed Board of Governors. Transit operators can provide service directly with their own equipment or they might purchase transit services through an agreement with a contractor.
In 2012, 725 reporters in urbanized areas submitted data to the National Transit Database (NTD). Five agencies were consolidated entities reporting on behalf of 80 transit providers. Thus, the total number of urban providers was 800. Of the 725 reporters, 697 were public agencies, including 369 city, county, or local government transportation units or departments, 250 independent public authorities or agencies for transit service, and 8 State Departments of Transportation (DOTs). The remaining 28 agencies were either private operators or independent agencies (e.g., for-profit organizations, nonprofit organizations, and Indian Tribes).
All transit providers that receive funds from FTA must report to NTD. In the past, small systems operating fewer than nine vehicles could request a reporting exemption; however, all small systems are now required to submit a simplified report to NTD each year. This small-system reporting waiver was granted to 213 agencies having fewer than 30 vehicles in maximum service and not operating fixed-guideway service.
Of the 512 agencies that reported providing service on 1,282 separate modal networks, all but 107 operated more than one mode. In 2012, an additional 1,703 transit operators were serving rural areas. Some agencies that do not have a reporting requirement to NTD will choose to submit a report because doing so can help their region receive additional Federal transit funding.
Urbanized Areas (UZA) witd Population over 1 Million in 2010 Census | |||
| UZA Rank | UZA Name | 2010 Population | 2012 Unlinked Transit Trips (in Thousands) |
| 1 | New York-Newark, NY-NJ-CT | 18,351,295 | 4,181,730 |
| 2 | Los Angeles-Long Beach-Anaheim, CA | 12,150,996 | 671,381 |
| 3 | Chicago, IL-IN | 8,608,208 | 663,752 |
| 4 | Miami, FL | 5,502,379 | 166,350 |
| 5 | Philadelphia, PA-NJ-DE-MD | 5,441,567 | 386,746 |
| 6 | Dallas-Fort Wortd-Arlington, TX | 5,121,892 | 79,377 |
| 7 | Houston, TX | 4,944,332 | 81,381 |
| 8 | Washington, DC-VA-MD | 4,586,770 | 485,448 |
| 9 | Atlanta, GA | 4,515,419 | 144,090 |
| 10 | Boston, MA-NH-RI | 4,181,019 | 409,749 |
| 11 | Detroit, MI | 3,734,090 | 47,954 |
| 12 | Phoenix-Mesa, AZ | 3,629,114 | 72,195 |
| 13 | San Francisco-Oakland, CA | 3,281,212 | 435,867 |
| 14 | Seattle, WA | 3,059,393 | 196,767 |
| 15 | San Diego, CA | 2,956,746 | 102,851 |
| 16 | Minneapolis-St. Paul, MN-WI | 2,650,890 | 93,864 |
| 17 | Tampa-St. Petersburg, FL | 2,441,770 | 30,025 |
| 18 | Denver-Aurora, CO | 2,374,203 | 98,716 |
| 19 | Baltimore, MD | 2,203,663 | 112,927 |
| 20 | St. Louis, MO-IL | 2,150,706 | 49,559 |
| 21 | San Juan, PR | 2,148,346 | 59,964 |
| 22 | Riverside-San Bernardino, CA | 1,932,666 | 25,342 |
| 23 | Las Vegas-Henderson, NV | 1,886,011 | 65,145 |
| 24 | Portland, OR-WA | 1,849,898 | 114,196 |
| 25 | Cleveland, OH | 1,780,673 | 49,139 |
| 26 | San Antonio, TX | 1,758,210 | 50,804 |
| 27 | Pittsburgh, PA | 1,733,853 | 67,770 |
| 28 | Sacramento, CA | 1,723,634 | 30,971 |
| 29 | San Jose, CA | 1,664,496 | 43,487 |
| 30 | Cincinnati, OH-KY-IN | 1,624,827 | 21,479 |
| 31 | Kansas City, MO-KS | 1,519,417 | 17,453 |
| 32 | Orlando, FL | 1,510,516 | 29,250 |
| 33 | Indianapolis, IN | 1,487,483 | 10,328 |
| 34 | Virginia Beach, VA | 1,439,666 | 18,460 |
| 35 | Milwaukee, WI | 1,376,476 | 47,423 |
| 36 | Columbus, OH | 1,368,035 | 18,763 |
| 37 | Austin, TX | 1,362,416 | 35,660 |
| 38 | Charlotte, NC-SC | 1,249,442 | 28,794 |
| 39 | Providence, RI-MA | 1,190,956 | 21,611 |
| 40 | Jacksonville, FL | 1,065,219 | 12,706 |
| 41 | Memphis, TN-MS-AR | 1,060,061 | 10,035 |
| 42 | Salt Lake City-West Valley City, UT | 1,021,243 | 42,366 |
| Total | 135,639,208 | 9,331,875 | |
The Nation's fixed-route bus and demand-response systems are much more extensive than the Nation's rail transit system. Bus fixed-route service includes three distinct modes: regular fixed-route bus, commuter bus, and bus rapid transit.
In 2012, 661 agencies reported fixed-route bus service, including 619 regular bus systems, 67 commuter bus systems, and 10 bus rapid transit systems. Some agencies operate more than one type of fixed-route bus, and so the sum of the three types does not equal the number of agencies operating these systems.
Transit agencies reported 629 demand-response systems (not including demand-response taxi) in urban areas, 18 heavy rail systems, 29 commuter rail systems, 4 hybrid rail systems, 25 light rail systems, and 17 street car systems (some of which are not yet in service).
The number of fixed-route bus systems is greater than the number of demand-response systems because in some urban areas a single, consolidated entity operates paratransit service, while more than one agency provides fixed-route service.
Although every major urbanized area in the United States has fixed-route bus and demand-response systems, 35 urbanized areas were served by at least one of the three primary rail modes, including 20 by commuter rail, 22 by light rail, and 12 by heavy rail. Exhibit 2-17 depicts the number of passenger cars for each rail mode by urbanized area.
Exhibit 2-17 Rail Modes Serving Urbanized Areas |
|||||||
|---|---|---|---|---|---|---|---|
| Uza Rank | Urbanized Area | Commuter Rail Vehicles | Heavy Rail Vehicles | Light Rail Vehicles | Streetcar Vehicles | Hybrid Rail Vehicles | Total Rail Vehicles |
| 1 | New York-Newark, NY-NJ-CT | 3,441 | 5,598 | 56 | - | 15 | 9,110 |
| 2 | Los Angeles-Long Beach-Anaheim, CA | 172 | 70 | 140 | - | - | 382 |
| 3 | Chicago, IL-IN | 1,114 | 1,070 | - | - | - | 2,184 |
| 4 | Miami, FL | 40 | 76 | - | - | - | 116 |
| 5 | Philadelphia, PA-NJ-DE-MD | 347 | 369 | - | 126 | - | 842 |
| 6 | Dallas-Fort Worth-Arlington, TX | 23 | - | 100 | - | - | 123 |
| 7 | Houston, TX | - | - | 18 | - | - | 18 |
| 8 | Washington, DC-VA-MD | 87 | 868 | - | - | - | 955 |
| 9 | Atlanta, GA | - | 182 | - | - | - | 182 |
| 10 | Boston, MA-NH-RI | 416 | 336 | 144 | - | - | 896 |
| 12 | Phoenix-Mesa, AZ | - | - | 26 | - | - | 26 |
| 13 | San Francisco-Oakland, CA | 100 | 534 | 131 | 24 | - | 789 |
| 14 | Seattle, WA | 56 | - | 26 | 5 | - | 87 |
| 15 | San Diego, CA | 24 | - | 95 | - | 8 | 127 |
| 16 | Minneapolis-St. Paul, MN-WI | 22 | - | 27 | - | - | 49 |
| 17 | Tampa-St. Petersburg, FL | - | - | - | 3 | - | 3 |
| 18 | Denver-Aurora, CO | - | - | 102 | - | - | 102 |
| 19 | Baltimore, MD | 132 | 54 | 38 | - | - | 224 |
| 20 | St. Louis, MO-IL | - | - | 58 | - | - | 58 |
| 21 | San Juan, PR | - | 32 | - | - | - | 32 |
| 24 | Portland, OR-WA | - | - | 104 | 7 | 4 | 115 |
| 25 | Cleveland, OH | - | 20 | 13 | - | - | 33 |
| 27 | Pittsburgh, PA | - | - | 56 | - | - | 56 |
| 28 | Sacramento, CA | - | - | 61 | - | - | 61 |
| 29 | San Jose, CA | - | - | 55 | - | - | 55 |
| 34 | Virginia Beach, VA | - | - | 7 | - | - | 7 |
| 37 | Austin, TX | - | - | - | - | 4 | 4 |
| 38 | Charlotte, NC-SC | - | - | 14 | - | - | 14 |
| 41 | Memphis, TN-MS-AR | - | - | - | 10 | - | 10 |
| 42 | Salt Lake City-West Valley City, UT | 36 | - | 82 | - | - | 118 |
| 44 | Nashville-Davidson, TN | 7 | - | - | - | - | 7 |
| 46 | Buffalo, NY | - | - | 23 | - | - | 23 |
| 47 | Hartford, CT | 28 | - | - | - | - | 28 |
| 49 | New Orleans, LA | - | - | - | 21 | - | 21 |
| 56 | Albuquerque, NM | 25 | - | - | - | - | 25 |
| 88 | Little Rock, AR | - | - | - | 3 | - | 3 |
| 102 | Stockton, CA | 18 | - | - | - | - | 18 |
| 104 | Denton-Lewisville, TX | 8 | - | - | - | - | 8 |
| 177 | Portland, ME | 14 | - | - | - | - | 14 |
| 256 | Kenosha, WI-IL | - | - | - | 1 | - | 1 |
| Grand Total | 6,110 | 9,209 | 1,376 | 200 | 31 | 16,926 | |
| Source: National Transit Database. | |||||||
In addition to fixed-route bus systems, demand-response systems, and rail modes, 74 publicly operated transit vanpool systems, 23 ferryboat systems, 5 trolleybus systems, 8 monorail/automated guideway systems, 3 inclined plane systems, 1 cable car system, and 1 Público were operating in urbanized areas of the United States and its territories.
The transit statistics presented in this report include those for the San Francisco Cable Car, Seattle Monorail, Roosevelt Island Aerial Tramway in New York, and Alaska Railroad (a long-distance passenger rail system included as public transportation by statutory exemption).
Transit Fleet
Exhibit 2-18 provides an overview of the Nation's 199,639 transit vehicles in 2012 by type of vehicle and size of urbanized area. Although some types of vehicles are specific to certain modes, many vehicles-particularly small buses and vans-are used by several different transit modes. For example, vans are used to provide vanpool, demand-response, Público, or fixed-route bus services. The limited classification options for vehicle type in NTD can make classifying smaller vehicles difficult.
Exhibit 2-18 Transit Active Fleet by Vehicle Type, 20121,2
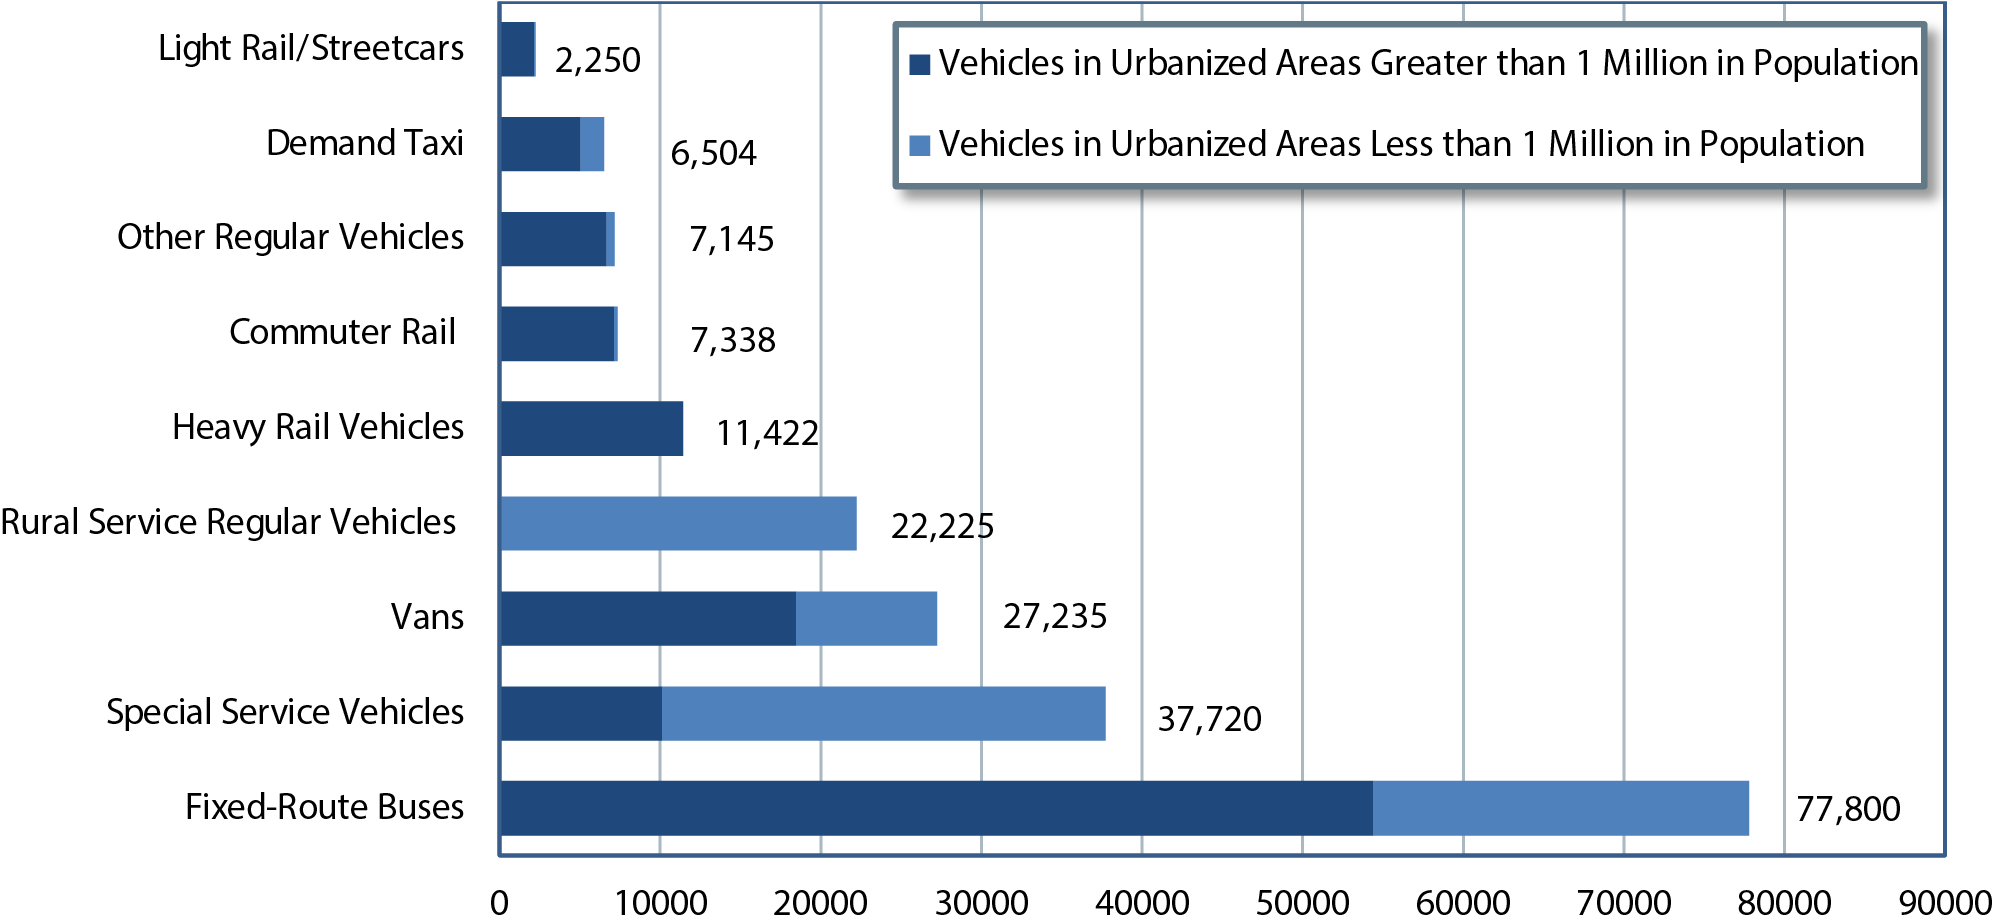
1Vehicle types: "Demand Taxi" includes taxicab sedan, taxicab station wagon, and taxicab vans. "Other Regular Vehicles" includes aerial tramway vehicles, Alaska railroad vehicles, automated guideway vehicles, automobiles, cable cars, ferryboats, inclined plane vehicles, jitneys, Públicos, and trolleybuses. "Commuter Rail" includes commuter rail locomotives, commuter rail passenger coaches, and commuter rail self-propelled passenger cars. "Fixed-Route Buses" includes articulated buses, double-decker buses, school buses, and over-the-road buses.
2Source for "Special Service Vehicles" is the FTA, Fiscal Year Trends Report on the Use of Section 5310, Elderly Persons and Persons with Disabilities program funds, 2002.
Source: National Transit Database.
Exhibit 2-19 Composition of Urban Transit Road Vehicle Fleet, 2012
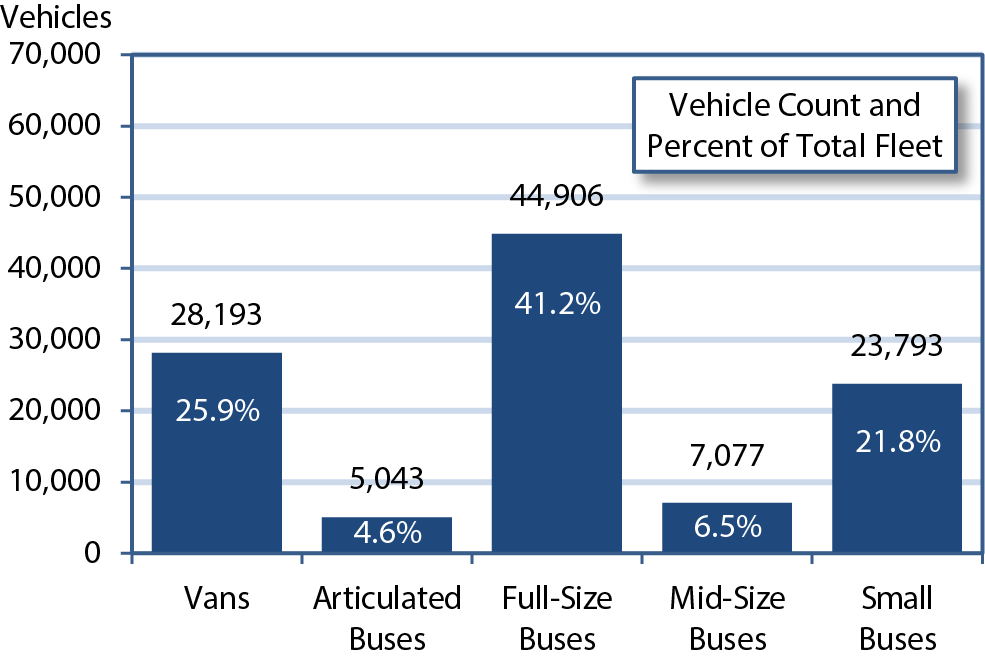
Source: Transit Economic Requirements Model and National Transit Database.
Exhibit 2-19 shows the composition of the Nation's urban transit road vehicle fleet in 2012. More than one-third of these vehicles, or 41 percent , are full-sized motor buses. Additional information on trends in the number and condition of vehicles over time is included in Chapter 3. Vans, as presented here, are the familiar 10-seat passenger vans. Articulated buses are the long vehicles articulated for better maneuverability on city streets. Full-sized buses are the standard 40-foot, 40-seat city buses. Mid-sized buses are in the 30-foot, 30-seat range. Small buses, typically built on truck chassis ("cutaways"), are shorter and seat around 20 people.
Exhibit 2-20 Maintenance Facilities for Directly Operated Services, 2012 |
|||
|---|---|---|---|
| Maintenance Facility Type1 | Population Category | ||
| Over 1 Million | Under 1 Million | Total | |
| Heavy Rail | 59 | 0 | 59 |
| Commuter Rail | 46 | 0 | 46 |
| Light Rail | 35 | 1 | 36 |
| Streetcar Rail | 9 | 2 | 11 |
| Other Rail2 | 4 | 5 | 9 |
| Fixed-Route Bus | 305 | 281 | 586 |
| Commuter Bus | 24 | 6 | 30 |
| Bus Rapid Transit | 2 | 0 | 3 |
| Demand Response | 52 | 116 | 168 |
| Vanpool | 5 | 5 | 9 |
| Ferryboat | 8 | 1 | 9 |
| Trolleybus | 4 | 1 | 5 |
| Total Urban Maintenance Facilities | 553 | 418 | 971 |
| Rural Transit3 | 727 | 727 | |
| Total Maintenance Facilities | 553 | 1,145 | 1,698 |
|
1 Includes owned and leased facilities. 2 Alaska railroad, automated guideway, cable car, inclined plane, and monorail. 3 Vehicles owned by operators receiving funding from FTA as directed by 49 USC Section 5311. These funds are for transit services in areas with populations of less than 50,000 (Section 5311, Status of Rural Public Transportation, 2000; Community Transportation Association of America, April 2001). Source: National Transit Database. |
|||
Track, Stations, and Maintenance Facilities
Maintenance facility counts are broken down by mode and by size of urbanized area for directly operated service in Exhibit 2-20. Modes such as hybrid rail, demand-response taxi, and Público are not included because all service is purchased. Chapter 3 includes data on the age and condition of these facilities.
A single facility can be used by more than one mode. In these cases, the count of facilities is prorated based on the number of peak vehicles for each mode.
As Exhibit 2-21 shows, transit providers operated 12,617 miles of track and served 3,281 stations in 2012. The Nation's rail system mileage is dominated by the longer distances generally covered by commuter rail. Light and heavy rail typically operate in more densely developed areas and have more stations per track mile.
Exhibit 2-21 Transit Rail Mileage and Stations, 2012 |
|
|---|---|
| Urbanized Area Track Mileage | |
| Heavy Rail | 2,274 |
| Commuter Rail | 7,738 |
| Light Rail | 1,419 |
| Hybrid Rail | 173 |
| Streetcar Rail | 286 |
| Other Rail and Tramway1 | 728 |
| Total Urbanized Area Track Mileage | 12,617 |
| Urbanized Area Transit Rail Stations Count | |
| Heavy Rail | 1,044 |
| Commuter Rail | 1,234 |
| Light Rail | 794 |
| Hybrid Rail | 49 |
| Streetcar Rail | 85 |
| Other Rail and Tramway1 | 75 |
| Total Urbanized Area Transit Rail Stations | 3,281 |
| 1 Includes Alaska railroad, automated guideway, cable car, inclined plane, monorail, and aerial tramway. Source: National Transit Database. | |
Rural Transit Systems (Section 5311 Providers)
The FTA first instituted rural data reporting to NTD in 2006. In 2012, 1,703 transit operators reported providing rural service; additionally, 235 urban agencies reported providing rural service. Together, these agencies reported 518 million unlinked passenger trips and 625 million vehicle revenue miles. These data include the more than 2 million unlinked passenger trips that 124 Indian Tribes provided. Rural systems provide both traditional fixed-route bus and demand-response services, with 1,108 demand-response services, 56 demand taxi services, 60 commuter bus services, 6 ferryboat services, 515 fixed-route bus services, and 21 vanpool services. They reported 22,225 vehicles in 2012. Exhibit 2-22 shows the number of rural transit vehicles in service in 2010 and 2012.
Exhibit 2-22 Rural Transit Vehicles, 2010 and 20121
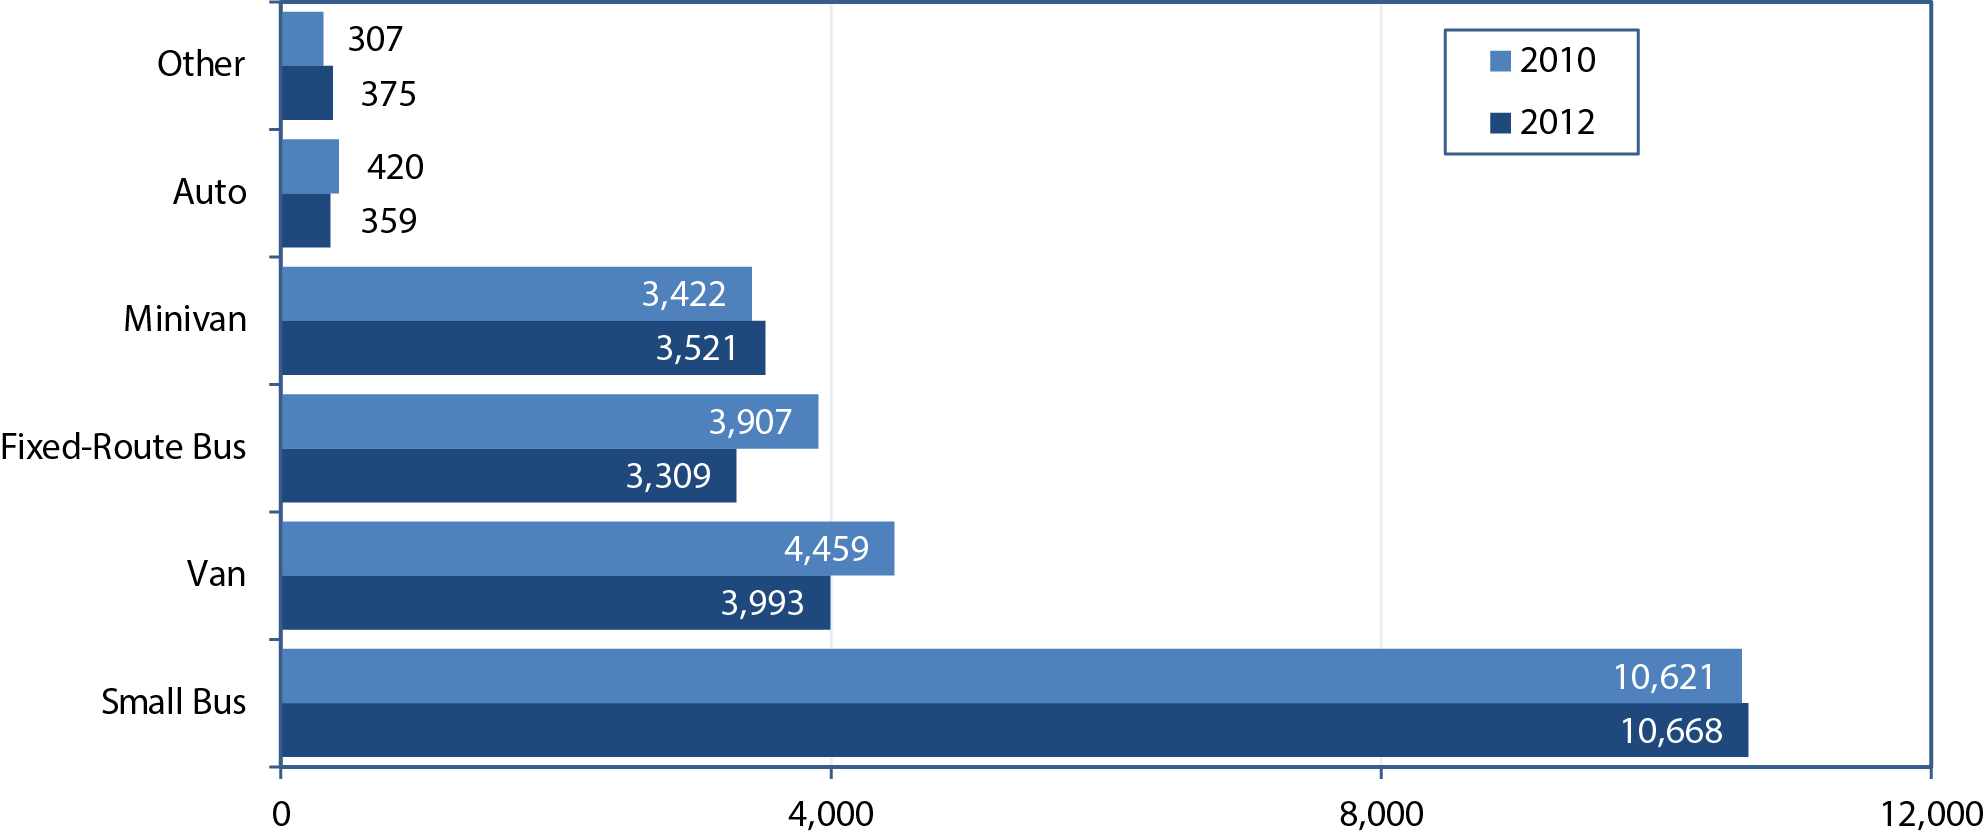
1Other includes ferryboat, over-the-road bus, school bus, sport utility vehicle, and other similar vehicles.
Source: National Transit Database.
Transit System Characteristics for Americans with Disabilities and the Elderly
The ADA is intended to ensure that persons with disabilities have access to the same facilities and services as other Americans, including transit vehicles and facilities. This equality of access is brought about by upgrading transit vehicles and facilities on regular routes, providing demand-response transit service for those individuals who still cannot use regular transit service, and operating special service vehicles by private entities and some public organizations, often with the assistance of FTA funding.
The overall percentage of transit vehicles that are ADA compliant has not significantly changed in recent years. In 2012, 77.6 percent of all transit vehicles reported in NTD were ADA compliant. Although this percentage has decreased slightly from 79.3 percent in 2010, it has increased substantially from the 73.3 percent reported for 2000. The percentage of vehicles compliant with the ADA for each mode is shown in Exhibit 2-23.
Exhibit 2-23 Urban Transit Operators' ADA Vehicle Fleets by Mode, 2012 |
|||
|---|---|---|---|
| Transit Mode | Active Vehicles | ADA-Compliant Vehicles | Percentage of Active Vehicles that are ADA Compliant |
| Rail | |||
| Heavy Rail | 11,422 | 10,988 | 96.2% |
| Commuter Rail | 7,263 | 3,960 | 54.5% |
| Light Rail | 1,981 | 1,826 | 92.2% |
| Alaska Railroad | 63 | 23 | 36.5% |
| Automated Guideway/Monorail | 156 | 156 | 100.0% |
| Cable Car | 38 | 0 | 0.0% |
| Inclined Plane | 8 | 6 | 75.0% |
| Hybrid Rail | 44 | 24 | 54.5% |
| Streetcar | 316 | 100 | 31.6% |
| Total Rail | 21,291 | 17,083 | 80.2% |
| Nonrail | |||
| Fixed-Route Bus | 62,204 | 61,524 | 98.9% |
| Demand Response | 30,846 | 26,013 | 84.3% |
| Vanpool | 13,537 | 144 | 1.1% |
| Ferryboat | 145 | 118 | 81.4% |
| Trolleybus | 572 | 572 | 100.0% |
| Público | 2,873 | 0 | 0.0% |
| Bus Rapid Transit | 90 | 90 | 100.0% |
| Commuter Bus | 1,994 | 1,928 | 96.7% |
| Demand Response Taxi | 6,142 | 895 | 14.6% |
| Total Nonrail | 118,403 | 91,284 | 77.1% |
| Total All Modes | 139,694 | 108,367 | 77.6% |
| Source: National Transit Database. | |||
In addition to the services urban and rural transit operators provide, the most recent American Public Transportation Association fact book indicates that approximately 4,800 nonprofit providers operate in rural and urban areas. These providers are eligible to receive funding from FTA for Transportation for Persons with Disabilities and the Elderly. This funding supports "special" transit services (i.e., demand-response). Nonprofit providers include religious organizations, senior citizen centers, rehabilitation centers, nursing homes, community action centers, sheltered workshops, and coordinated human services transportation providers.
The ADA requires that new transit facilities and alterations to existing facilities be accessible to the disabled. In 2012, 78.7 percent of total transit stations were ADA compliant, an increase from the 76.0 percent compliant in 2010. Earlier data for this parameter might not be comparable to data provided in this current report due to improvements in reporting quality. Exhibit 2-24 presents the number of urban transit ADA stations and percentage of total stations by mode.
Exhibit 2-24 Urban Transit Operators' ADA-Compliant Stations by Mode, 2012 |
|||
|---|---|---|---|
| Transit Mode | Total Stations | ADA-Compliant Stations | Percentage of Stations that are ADA Compliant |
| Rail | |||
| Heavy Rail | 1,044 | 542 | 51.9% |
| Commuter Rail | 1,234 | 822 | 66.6% |
| Light Rail | 794 | 725 | 91.3% |
| Alaska Railroad | 10 | 10 | 100.0% |
| Automated Guideway/ Monorail | 57 | 56 | 98.2% |
| Inclined Plane | 8 | 7 | 87.5% |
| Hybrid Rail | 49 | 49 | 100.0% |
| Street Car | 85 | 41 | 48.2% |
| Total Rail | 3,281 | 2,252 | 68.6% |
| Nonrail | |||
| Fixed-Route Bus | 1,355 | 1,337 | 98.7% |
| Ferryboat | 94 | 89 | 94.7% |
| Trolleybus | 5 | 5 | 100.0% |
| Bus Rapid Transit | 7 | 7 | 100.0% |
| Commuter Bus | 195 | 195 | 100.0% |
| Total Nonrail | 1,656 | 1,633 | 98.6% |
| Total All Modes | 4,937 | 3,885 | 78.7% |
| Source: National Transit Database. | |||
Under the ADA, FTA was given responsibility for identifying key rail stations and facilitating the accessibility of these stations to disabled persons by July 26, 1993. Rail stations identified as "key" have the following characteristics:
- The number of passengers boarding exceeds the average number of passengers boarding on the rail system as a whole by at least 15 percent .
- The station is a major point where passengers shift to other transit modes.
- The station is at the end of a rail line, unless it is close to another accessible station.
- The station serves a "major" center of activities, including employment or government centers, institutions of higher education, and major health facilities.
Although ADA legislation required all key stations to be accessible by July 26, 1993, the DOT ADA regulation-Title 49 Code of Federal Regulations (CFR) Part 37.47(c)(2)-permitted the FTA Administrator to grant extensions up to July 26, 2020, for stations that required extraordinarily expensive structural modifications to achieve compliance. Of the 680 key rail stations in 2010, 8 stations (1.2 percent ) were under FTA-approved time extensions. The total number of key rail stations has changed slightly over the years as certain stations have closed. As of May 23, 2014, 680 stations were designated as key. Of these, 607 were accessible and fully compliant, 30 were accessible but not fully compliant, and 28 were self-certified as accessible. "Accessible but not fully compliant" means that these stations are functionally accessible (i.e., persons with disabilities, including wheelchair users, can make use of the station), but minor outstanding issues must be addressed for the station to be fully compliant; example issues include missing or misallocated signage and parking-lot striping errors. Fifteen key rail stations that are not yet compliant are in the planning, design, or construction stage. Of these, seven stations are under FTA-approved time extensions up to 2020 (as provided under 49 CFR §37.47[c][2]). FTA continues to focus its attention on the eight stations that are not accessible and are not under a time extension, and on the seven stations with time extensions that will be expiring in the coming years.
Transit System Characteristics: Alternative Fuel Vehicles
Exhibit 2-25 shows that the share of alternative fuel buses increased from 10.5 percent in 2002 to 22.8 percent in 2012. In 2012, 12.5 percent of buses used compressed natural gas, 8.7 percent used biodiesel, and 1.6 percent used liquefied natural gas or petroleum gas. Conventional fuel buses, which make up most of the U.S. bus fleet, used diesel fuel and gasoline. In 2012, hybrid buses made up 5.9 percent of urban bus fleets as shown in Exhibit 2-26.
Exhibit 2-25 Percentage of Urban Bus Fleet Using Alternative Fuels, 2002—2012
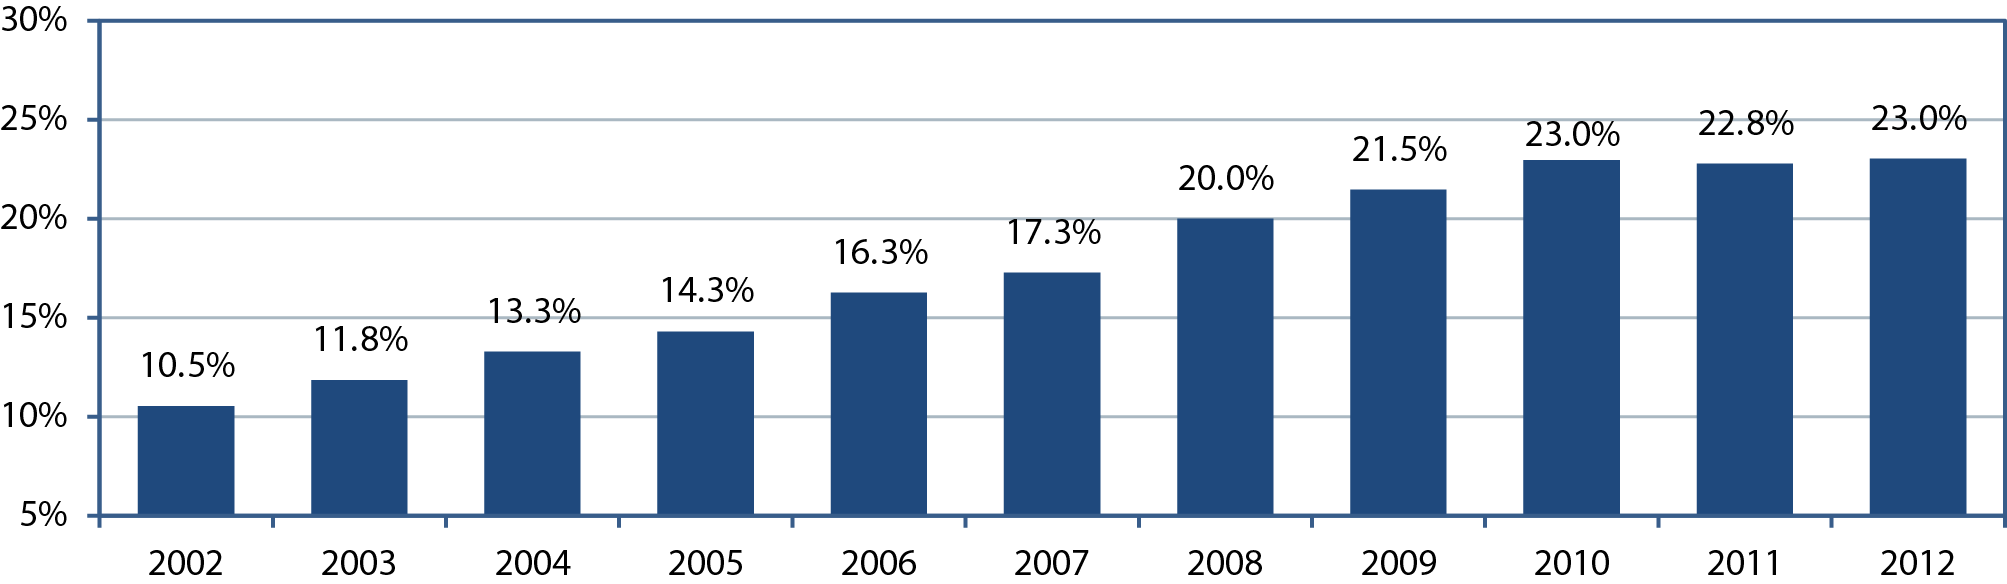
Source: National Transit Database.
Exhibit 2-26 Hybrid Buses as a Percentage of Urban Bus Fleet, 2007—2012
Source: National Transit Database.