

chapter 4
Overall Fatalities and Injuries
Fatalities by Roadway Functional Class
Vision: Toward Zero Deaths and Serious Injuries on the Nation's Roadways
Improved Safety Analysis Tools
Focused Approach to Safety Program
Pedestrians, Bicyclists, and Other Nonmotorists
Incidents, Fatalities, and Injuries
Highway Safety
Safety is the U.S. Department of Transportation's (DOT) top priority. Three operating administrations within DOT have specific responsibilities for addressing highway safety. The Federal Highway Administration (FHWA) focuses on infrastructure safety design and operations. The National Highway Traffic Safety Administration (NHTSA) oversees vehicle safety standards and administers driver behavior programs. The Federal Motor Carrier Safety Administration (FMCSA) works to reduce crashes, injuries, and fatalities involving large trucks and buses.
This balance of coordinated efforts enables these DOT Administrations to concentrate on their areas of expertise while working toward a single goal and encourages a more unified effort. Coupled with a comprehensive focus on shared, reliable safety data, collectively these organizations ensure that the Federal effort is implemented to its greatest potential.
This chapter provides data on fatalities and injuries and details on FHWA safety programs. FHWA provides technical assistance and expertise to Tribal, State, and local governments for researching, designing, and implementing safety improvements in roadway infrastructure. FHWA also supports improvements in safety elements as part of road and bridge construction and system preservation projects. The Highway Safety Improvement Program (HSIP) is FHWA's main infrastructure safety funding program. It includes a performance-driven, strategic approach to achieve significant reductions in fatalities and serious injuries on all public roads for all road users, including pedestrians and bicyclists. HSIP also helps States improve their roadway safety data. Additionally, HSIP supports railway-highway safety through set-aside funding. Use of HSIP funds is driven by a statewide coordinated plan developed in cooperation with a broad range of multidisciplinary stakeholders that provides a comprehensive framework for safety. This data-driven State Strategic Highway Safety Plan (SHSP) defines State safety goals and integrates the four "E's"-engineering, education, enforcement, and emergency services. SHSP guides States and their collection of data in the use of HSIP and other funds to resolve safety problems and save lives.
On March 15, 2016, FHWA published Final Rules for HSIP and for Safety Performance Management Measures (PM-1). The HSIP Final Rule updates the existing HSIP requirements to be consistent with the Moving Ahead for Progress in the 21st Century Act (MAP-21) and the Fixing America's Surface Transportation (FAST) Act. The PM-1 Final Rule adds specific safety performance measure requirements for the purpose of carrying out the HSIP to assess serious injuries and fatalities on all public roads. The Safety PM Final Rule establishes five performance measures as the 5-year rolling averages for: (1) Number of Fatalities, (2) Rate of Fatalities per 100 million Vehicle Miles Traveled (VMT), (3) Number of Serious Injuries, (4) Rate of Serious Injuries per 100 million VMT, and (5) Number of Non-motorized Fatalities and Non-motorized Serious Injuries.
Overall Fatalities and Injuries
Statistics discussed in this section are drawn primarily from the Fatality Analysis Reporting System (FARS). NHTSA, which has a cooperative agreement with States to provide information on fatal crashes, maintains FARS. FARS is a nationwide census providing DOT, Congress, and the American public data regarding fatal motor vehicle traffic crashes. FARS data are combined with exposure data from other sources to produce fatal crash rates. The exposure data most frequently used are estimates of vehicle miles traveled (VMT) that FHWA collects through the Highway Performance Monitoring System. This system provides a standard, recognized database that covers all regions of the United States.
In addition to FARS, NHTSA estimates serious injuries nationally through the National Automotive Sampling System General Estimates System. Datasets in this system provide a statistically produced annual estimate of total nonfatal injury crashes. Safety statistics in this section, compiled in 2014, represent a "snapshot in time" during the preparation of this report, which is why they might not precisely correspond to other, more recently completed reports.
In 2012, 31,006 fatal crashes occurred in the United States. In this same year, approximately 1.63 million nonfatal injury crashes and 3.95 million property damage-only crashes occurred. The total estimated number of crashes in 2012, as Exhibit 4-1 shows, was 5.62 million. All three crash types have significantly declined from 2002 to 2012. The number of fatal crashes in 2012 showed the first increase since 2005, up to a nearly identical fatal crash count in 2009. Similarly, the number of injury crashes rose in 2012, up to a number last observed in 2008.
Exhibit 4-1 Crashes by Severity, 2002—2012 |
||||||||||
|---|---|---|---|---|---|---|---|---|---|---|
| Year | Crash Severity | Total Crashes | ||||||||
| Fatal | Injury | Property Damage Only | ||||||||
| Number | percent | Number | percent | Number | percent | Number | percent | |||
| 2002 | 38,491 | 0.6 | 1,928,984 | 30.5 | 4,348,233 | 68.8 | 6,315,708 | 100.0 | ||
| 2003 | 38,477 | 0.6 | 1,924,912 | 30.4 | 4,364,566 | 69.0 | 6,327,955 | 100.0 | ||
| 2004 | 38,444 | 0.6 | 1,861,617 | 30.1 | 4,280,966 | 69.3 | 6,181,027 | 100.0 | ||
| 2005 | 39,252 | 0.6 | 1,816,105 | 29.5 | 4,303,993 | 69.9 | 6,159,350 | 100.0 | ||
| 2006 | 38,648 | 0.6 | 1,745,924 | 29.2 | 4,188,641 | 70.1 | 5,973,213 | 100.0 | ||
| 2007 | 37,435 | 0.6 | 1,711,304 | 28.4 | 4,275,269 | 71.0 | 6,024,008 | 100.0 | ||
| 2008 | 34,172 | 0.6 | 1,630,420 | 28.1 | 4,146,254 | 71.4 | 5,810,846 | 100.0 | ||
| 2009 | 30,862 | 0.6 | 1,517,075 | 27.6 | 3,957,243 | 71.9 | 5,505,180 | 100.0 | ||
| 2010 | 30,296 | 0.6 | 1,542,104 | 28.5 | 3,847,045 | 71.0 | 5,419,445 | 100.0 | ||
| 2011 | 29,867 | 0.6 | 1,529,968 | 28.7 | 3,777,994 | 70.8 | 5,337,829 | 100.0 | ||
| 2012 | 31,006 | 0.6 | 1,634,180 | 29.1 | 3,949,858 | 70.3 | 5,615,044 | 100.0 | ||
| Source: Fatality Analysis Reporting System/National Center for Statistics and Analysis, NHTSA. | ||||||||||
Exhibit 4-2 displays trends in motor vehicle fatality counts, fatality rates, injury counts, and injury rates. The motor vehicle fatality count rose to above 51,000 in 1980, and then dropped to less than 43,000 in 1983, coinciding with the recession occurring in the early 1980s. The fatality count declined to less than 40,000 in 1992 for the first time in decades, but remained above 40,000 every year from 1993 through 2007. Exhibit 4-2 shows significant declines in fatality counts in recent years. In 2005, 43,510 traffic deaths occurred. Between 2005 and 2011, the number of fatalities declined 25 percent , to 32,479 in 2011. In 2012, the number of fatalities rose for the first year since 2005, up 4 percent to 33,782 in 2012. Of note is that the large decline in fatalities from 2005 through 2011 included the timing of the implementation of FHWA's HSIP and the occurrence of the largest recession (2007—2009) since World War II.
Exhibit 4-2 Summary of Fatality and Injury Rates, 1966—2012 |
||||||||
|---|---|---|---|---|---|---|---|---|
| Year | Number of Motor Vehicle Fatalities | Resident Population (Thousands) | Fatality Rate per 100,000 Population | Vehicle Miles Travelled (Millions) | Fatality Rate per 100 Million VMT | Number of Motor Vehicle Injuries | Injury Rate per 100,000 Population | Injury Rate per 100 Million VMT |
| 1966 | 50,894 | 196,560 | 25.89 | 925,345 | 5.50 | |||
| 1968 | 52,725 | 200,706 | 26.27 | 1,013,942 | 5.20 | |||
| 1970 | 52,627 | 205,052 | 25.67 | 1,110,274 | 4.74 | |||
| 1972 | 54,589 | 209,896 | 26.01 | 1,269,512 | 4.30 | |||
| 1974 | 45,196 | 213,854 | 21.13 | 1,291,314 | 3.50 | |||
| 1976 | 45,523 | 218,035 | 20.88 | 1,400,708 | 3.25 | |||
| 1978 | 50,331 | 222,585 | 22.61 | 1,543,896 | 3.26 | |||
| 1980 | 51,091 | 227,225 | 22.48 | 1,525,104 | 3.35 | |||
| 1982 | 43,945 | 231,664 | 18.97 | 2,496,875 | 1.76 | |||
| 1984 | 44,257 | 235,825 | 18.77 | 1,722,062 | 2.57 | |||
| 1986 | 46,087 | 240,133 | 19.19 | 1,836,135 | 2.51 | |||
| 1988 | 47,087 | 244,499 | 19.26 | 2,029,612 | 2.32 | 3,416,000 | 1,397 | 168 |
| 1990 | 44,599 | 249,439 | 17.88 | 2,144,183 | 2.08 | 3,231,000 | 1,295 | 151 |
| 1992 | 39,250 | 254,995 | 15.39 | 2,242,857 | 1.75 | 3,070,000 | 1,204 | 137 |
| 1994 | 40,716 | 260,327 | 15.64 | 2,353,526 | 1.73 | 3,266,000 | 1,255 | 139 |
| 1996 | 42,065 | 265,229 | 15.86 | 2,482,202 | 1.69 | 3,483,000 | 1313 | 140 |
| 1998 | 41,501 | 270,248 | 15.36 | 2,628,148 | 1.58 | 3,192,000 | 1181 | 121 |
| 2000 | 41,945 | 281,422 | 14.90 | 2,749,803 | 1.53 | 3,189,000 | 1133 | 116 |
| 2002 | 43,005 | 288,369 | 14.91 | 2,855,756 | 1.51 | 2,926,000 | 1015 | 102 |
| 2003 | 42,884 | 290,810 | 14.75 | 2,890,893 | 1.48 | 2,889,000 | 993 | 100 |
| 2004 | 42,836 | 293,655 | 14.59 | 2,962,513 | 1.45 | 2,788,000 | 949 | 94 |
| 2005 | 43,510 | 296,410 | 14.68 | 2,989,807 | 1.46 | 2,699,000 | 911 | 90 |
| 2006 | 42,708 | 299,398 | 14.26 | 3,014,116 | 1.42 | 2,575,000 | 860 | 85 |
| 2007 | 41,259 | 301,621 | 13.68 | 3,029,822 | 1.36 | 2,491,000 | 826 | 82 |
| 2008 | 37,423 | 304,060 | 12.31 | 2,973,509 | 1.26 | 2,346,000 | 772 | 79 |
| 2009 | 33,883 | 307,007 | 11.04 | 2,953,501 | 1.15 | 2,217,000 | 722 | 75 |
| 2010 | 32,999 | 308,746 | 10.69 | 2,967,266 | 1.11 | 2,239,000 | 725 | 75 |
| 2011 | 32,479 | 311,592 | 10.42 | 2,950,402 | 1.10 | 2,217,000 | 712 | 75 |
| 2012 | 33,782 | 314,112 | 10.75 | 2,968,815 | 1.14 | 2,362,000 | 752 | 80 |
| Source: Fatality Analysis Reporting System/National Center for Statistics and Analysis, NHTSA. | ||||||||
In addition to the fatality counts shown in the left column of Exhibit 4-2, fatality rates are shown for two different measures of exposure: rates expressed in terms of population and in terms of VMT. To account for amount of travel on the road, the fatality rate is most often expressed in terms of VMT. Fatality rate per VMT provides a metric that enables transportation professionals to consider fatalities in terms of the additional exposure associated with driving more miles. The fatality rates per population shown in Exhibit 4-2 are often stratified to examine in more depth how demographic variables, such as male drivers aged 16—20 versus male drivers aged 21—44, influence fatality rates.
The fatality rate per population was 22.48 per 100,000 population in 1980. This rate dropped to 17.88 in 1990 and to 14.90 in 2000. In 2012, the rate further declined to 10.75. The rate of 10.75 in 2012 was less than half the fatality rate in 1980.

Although this report focuses primarily on prior years of data, NHTSA has issued 2015 FARS data. During 2015, 35,092 people died in crashes on U.S. roadways, an increase from 32,744 in 2014. The 7.2-percent increase is the largest percentage increase in nearly 50 years. The largest percentage increase previously was an 8.1-percent increase from 1965 to 1966. The estimated number of traffic-related injuries also increased from 2014 to 2015, rising from 2.34 to 2.44 million injured people. The fatality rate per 100 million VMT increased to 1.12 from 1.08 in 2014. The 2014 rate was the lowest since NHTSA began collecting fatality data through FARS in 1975. VMT increased by 3.5 percent from 2014 to 2015, the largest increase since 1992, nearly 25 years ago.
The number of passenger car and light-truck occupant fatalities increased by 1,391 (a 6.6-percent increase) from 2014 to 2015, and is at its highest since 2009. This increase accounted for 59 percent of the overall increase in fatalities. Pedestrian fatalities increased by 466 (a 9.5-percent increase), and are at their highest number since 1996. Bicyclist fatalities increased by 89 (a 12.2-percent increase), and are at their highest level since 1995.
More information is available at https://crashstats.nhtsa.dot.gov/Api/Public/ViewPublication/812318.
The fatality rate, expressed in terms of VMT, in 1966 was 5.50 deaths per 100 million (M) VMT. That rate has remained less than 5.00 since 1970, and less than 4.00 since 1974. Due to significant progress in traffic safety in the United States, the motor vehicle fatality rate has continued to decline. The rate was less than 3.00 in 1982; it has remained less than 2.00 since 1992. In 2003, the rate dropped below 1.50 and continued to drop from 1.46 in 2005 to 1.36 in 2007, to 1.26 in 2008, and to 1.15 in 2009. A historic low of 1.10 was reached in 2011, before the rate climbed slightly to 1.14 in 2012 (see Exhibit 4-2).
Also shown in Exhibit 4-2 are the national estimates for people nonfatally injured in motor vehicle crashes. A historic low of 2,217,000 injured was reached in 2009 and again in 2011, with an injury rate of 75 per 100 M VMT in both years. In 2012, the injury count rose slightly to 2,362,000 and the rate rose to 80 per 100 M VMT. Fatalities and injuries declined in almost all segments of the population, including passenger vehicle drivers, passenger vehicle occupants, large-truck occupants, pedestrians, young drivers, and drivers involved in alcohol-impaired driving fatalities.
DOT attributes the overall decline in roadway fatalities over the past several years to multiple factors, including an increase in the HSIP spending rate and roadway infrastructure improvements such as Safety Edge, Innovative Intersection and Interchange Geometrics, and High Friction Surface Treatments. The improvements in infrastructure are some of the innovative technologies being deployed as part of FHWA's Every Day Counts initiative discussed in Chapter 3.
The trends since 1980 of the fatality counts and fatality rates, as discussed above and shown in Exhibit 4-2, are displayed graphically in Exhibits 4-3 and 4-4. Exhibit 4-3 shows the number of motor vehicle fatalities from 1980 to 2012. Exhibit 4-4 shows the motor vehicle fatality rates per 100 M VMT from 1980 to 2012.
Exhibit 4-3 Fatalities, 1980—2012
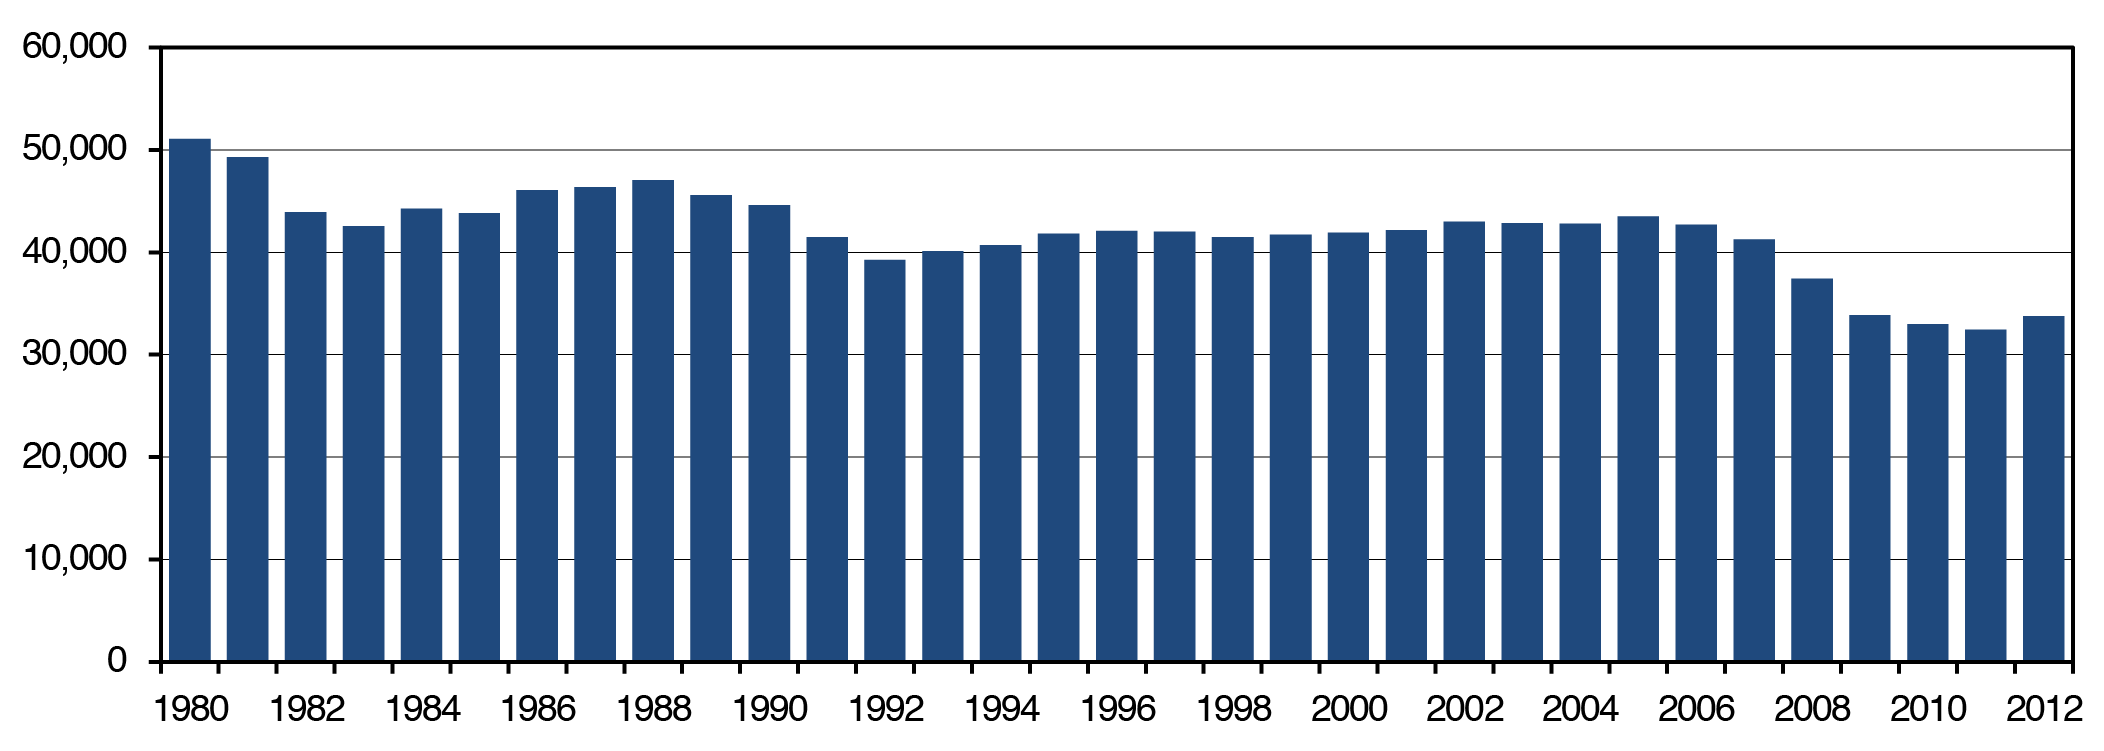
Source: Fatality Analysis Reporting System/National Center for Statistics and Analysis, NHTSA.
Exhibit 4-4 Fatality Rates, 1980—2012
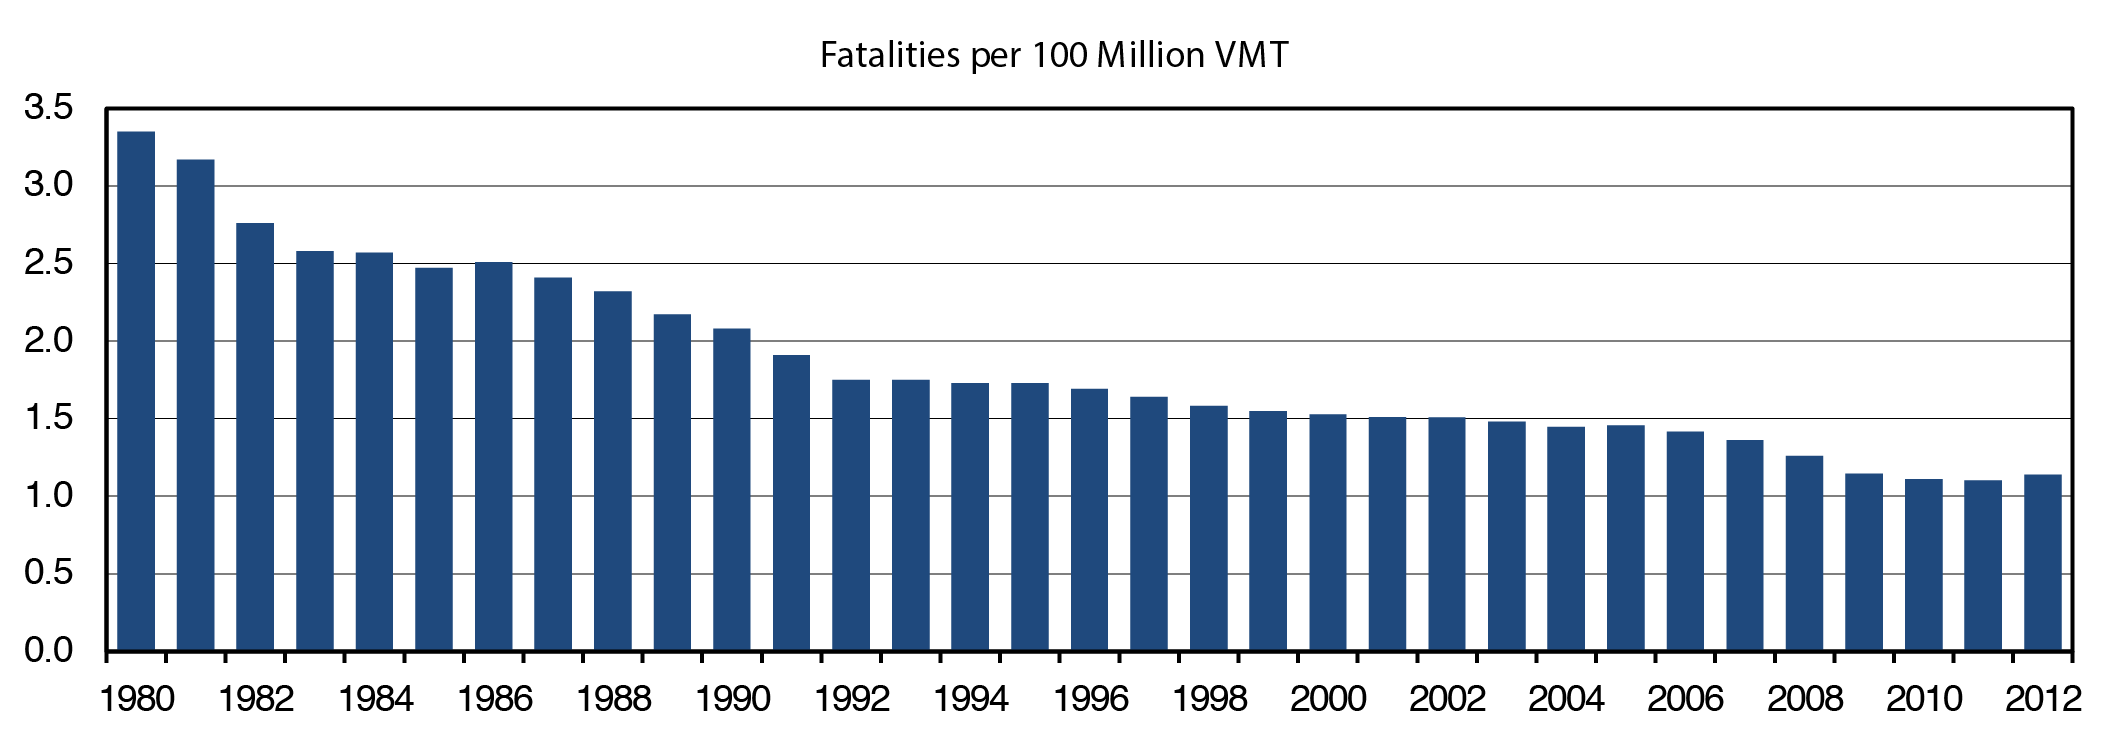
Source: Fatality Analysis Reporting System/National Center for Statistics and Analysis, NHTSA.
Fatalities by Roadway Functional Class
The previous section presents overall counts and rates of both fatalities and injuries. This section focuses on how fatality counts and fatality rates differ between rural and urban roadway functional class. Exhibit 4-5 shows fatality counts and Exhibit 4-6 displays fatality rates for 2002 through 2012.
As shown in Exhibit 4-5, the number of fatalities peaked in 2005, and then declined to 32,479 in 2011. In 2012, fatalities from urban crashes accounted for 45.9 percent of all fatalities, while those resulting from rural crashes accounted for 54.1 percent . From 2002 to 2012, the number of fatalities on urban roads decreased from 17,013 to 15,296, a reduction of 10.1 percent . The peak in urban fatalities occurred in 2006, at 18,791. Over the same period, the number of fatalities on rural roads decreased from 25,896 (in 2002) to 18,170 (in 2012), a reduction of 29.8 percent . Rural fatalities peaked in 2002.
These declines varied greatly by roadway functional class. For example, urban interstate fatalities dropped by 13 percent from 2002 to 2012, while urban collector road fatalities rose by 10.1 percent . Rural interstate fatalities dropped by 45.0 percent from 2002 to 2012, compared to a drop in rural minor arterial roadway fatalities of only 22.4 percent .
Exhibit 4-6 shows the fatality rates per 100M VMT for urban and rural functional systems between 2002 and 2012. Urban Interstate highways were the safest functional system, with a fatality rate of 0.45 in 2012. Among urban roads, Interstate highways (26.9 percent decline) and Other Freeways and Expressways (35.8 percent decline) recorded the sharpest declines in fatality rates during this 11-year period. Among rural roads, the sharpest declines occurred in minor collectors (44.8 percent decline) and Interstates (37.5 percent decline). The decreases in overall fatality rate observed in urban areas (21.7 percent decline) and rural areas (19.1 percent decline) from 2002 to 2012 are due in part to a combination of safety countermeasures and programs DOT and State partners introduced.
Despite the overall decreases in fatality rates on both urban and rural functional systems, rural roads remain far more dangerous than urban roads, evidenced by a fatality rate on rural roads (1.86 per 100 M VMT) that is 2.42 times higher than the fatality rate on urban roads (0.77 per 100 M VMT). Several factors collectively comprise this rural road safety challenge, including roadway, behavioral, and emergency services issues.
Locally Owned Road Safety
More than 30,000 local agencies own and operate 75 percent of the Nation's roadways. Agency practitioners have varying levels of transportation safety expertise and often perform several duties in addition to transportation safety. FHWA developed Road Safety 365: A Workshop for Local Governments, to help local practitioners routinely identify safety issues along their roadways and provide ideas on how to address them.
The fatality rate for rural local roads (2.66) in 2012 was more than 3.5 times higher than that for rural Interstates (0.74). Similarly, the fatality rate for urban local roads (1.15) was more than 2.5 times higher than the fatality rate for urban Interstates (0.45). Addressing the challenges associated with non-Interstate roads can be made more difficult by the diversity of ownership; States maintain Interstate roads, while the State or a variety of local organizations, including cities and counties, maintain other roads.
Vision: Toward Zero Deaths and Serious Injuries on the Nation's Roadways
The DOT strategic goal on safety is "Improve public health and safety by reducing transportation-related fatalities and injuries for all users, working toward no fatalities across all modes of travel." To help accomplish this goal, FHWA oversees HSIP, a core Federal-aid program, which has as its goal to achieve a significant reduction in traffic fatalities and serious injuries on all public roads, including non-State-owned public roads and roads on Tribal lands. HSIP requires a data-driven, strategic approach to improving highway safety on all public roads that focuses on performance. By improving data and promoting analysis and evaluation, implementing programs based on current highway safety knowledge, and conducting research to expand that knowledge base, FHWA continues to move toward zero deaths on the Nation's roadways.
FHWA coordinates with States as they develop SHSPs. As a major component and requirement of HSIP, an SHSP is a statewide-coordinated safety plan, developed by a State Department of Transportation in cooperation with a broad range of safety stakeholders. An SHSP analyzes highway safety problems, identifies a State's key safety needs, and guides decisions toward strategies and investments with the most potential to save lives and prevent injuries. The SHSP enables highway safety programs and partners in the State to work together to align goals, leverage resources, and collectively address the State's safety challenges.
To support their SHSPs, States must have a safety data system to identify problems and analyze countermeasures on all public roads; adopt strategic and performance-based goals; advance data collection, data analysis, and data integration capabilities; determine priorities for correcting the identified safety problems; and establish evaluation procedures.
Improved Data
FHWA promotes improved data, analysis methods, and evaluation capabilities, which collectively make a major contribution toward advancements in highway safety. Better data and enhanced ways to analyze the data produce valuable information for local, State, national, and private transportation safety stakeholders. These improvements also help members of the highway safety community reduce traffic fatalities, injuries, and property damage-only crashes.
The FHWA Roadway Safety Data Program works to develop, evaluate, and deploy life-saving countermeasures; advances the use of scientific methods and data-driven decisions; and promotes an integrated, multidisciplinary approach to safety. The program helps improve safety data and expand capabilities for analysis and evaluation. The effectiveness of safety programs is directly linked to the availability and analysis of reliable crash and roadway data.
Improved Safety Analysis Tools
FHWA also provides and supports a wide range of data and safety analysis tools for State and local practitioners. These tools are designed to help practitioners understand safety problems on their roadways, link crashes to their roadway environments, and select and apply appropriate counter-measures. The tools' capabilities range from simple to complex. Some provide general information; others enable complex analysis of crashes under specific conditions or with specific roadway features.
One valuable safety analysis tool is the Highway Safety Manual (HSM), published by the American Association of State Highway Transportation Officials and developed by cooperative research initiated by FHWA. The document's primary focus is the introduction and development of analytical tools for predicting the impact of transportation project and program decisions on road safety. The HSM provides improved information and tools that facilitate roadway planning, design, operations, and maintenance decisions based on precise consideration of their safety consequences. The second edition, developed in 2015, will continue to communicate valuable highway safety research and knowledge gained over many years.
Along with the HSM and various implementation tools, cooperative research initiated by FHWA has developed other safety analysis tools, such as the Safety Analyst, Interactive Highway Safety Design Model, and the Crash Modification Factors Clearinghouse. These tools greatly advance the abilities of State and local highway agencies to incorporate explicit, quantitative consideration of safety into their planning and project development decision-making.
Legislative Mandates
The MAP-21 reauthorizing legislation identifies the need for improved and more robust safety data for better safety analysis to support the development of States' HSIPs and SHSPs. MAP-21 builds on and refines many of the highway, transit, bicycle, and pedestrian programs and policies FHWA administers.
MAP-21 supports DOT's determined safety agenda. It continues the successful HSIP, doubling funding for infrastructure safety and strengthening the linkage among safety programs at FHWA, NHTSA, and FMCSA. It also continues to build on other aggressive safety efforts, including the Department's fight against distracted driving and its push to improve transit and motor carrier safety.
The FAST Act maintains a strong focus on safety, keeping intact the established structure of the various highway-related safety programs, while providing a predictable level of authorized funding over a 5-year period. The primary features of the current HSIP are retained, including the requirement for a comprehensive, data-driven SHSP that defines State safety goals and describes a program of strategies to improve safety.
FHWA published the HSIP and Safety Performance Management Measures (PM-1) Final Rules in the Federal Register on March 15, 2016, with an effective date of April 14, 2016.
The HSIP Final Rule updates the existing HSIP requirements under 23 CFR 924 to be consistent with MAP-21 and the FAST Act, and clarifies existing program requirements. Specifically, the HSIP Final Rule contains three major policy changes: SHSP Updates, HSIP Report Content and Schedule, and the Subset of the Model Inventory of Roadway Elements (MIRE).
The Safety PM Final Rule adds Part 490 to Title 23 of the Code of Federal Regulations to implement the performance management requirements under 23 U.S.C. 150, including the specific safety performance measure requirements for the purpose of carrying out the HSIP to assess serious injuries and fatalities on all public roads. The Safety PM Final Rule establishes five performance measures as the 5-year rolling averages for: (1) Number of Fatalities, (2) Rate of Fatalities per 100 million Vehicle Miles Traveled (VMT), (3) Number of Serious Injuries, (4) Rate of Serious Injuries per 100 million VMT, and (5) Number of Non-motorized Fatalities and Non-motorized Serious Injuries. The Safety PM Final Rule also establishes the process for State Departments of Transportation (DOTs) and Metropolitan Planning Organization (MPOs) to establish and report their safety targets, and the process that FHWA will use to assess whether State DOTs have met or made significant progress toward meeting their safety targets. The Safety PM Final Rule also establishes a common national definition for serious injuries.
Together, these regulations will improve data, foster transparency and accountability, and allow safety progress to be tracked at the national level. They will inform State DOT and MPO planning, programming, and decision-making to support reductions in fatalities and serious injuries.
Focused Approach to Safety Program
When it occurs, a crash is generally the result of numerous contributing factors. Roadway, vehicle, driver, passenger, and non-occupant factors all have an impact on the safety of the Nation's highway system. FHWA collaborates with other agencies to understand more clearly the relationship among all contributing factors and to address crosscutting ones, but focuses on infrastructure design and operation to address roadway factors.
FHWA examined crash data to identify the most common crash types relating to roadway characteristics. FHWA established three focus areas to address these factors: roadway departures, intersections, and pedestrian crashes. These three areas were selected because they account for more than three-quarters of overall fatalities and represent an opportunity to significantly reduce the number of fatalities and serious injuries. FHWA manages the Focused Approach to Safety Program to address the most critical safety challenges surrounding these crashes. Through this program, FHWA focuses its technical assistance and resources on States and cities with high fatality counts and fatality rates in one or more of these three categories.
In 2012, roadway departure, intersection, and pedestrian fatalities accounted for 52.2 percent , 21.7 percent , and 14.1 percent , respectively, of total highway fatalities. Note that these three categories overlap. For example, when a roadway departure crash includes a pedestrian's being fatally struck, that crash would be accounted for in both the roadway departure and the pedestrian-related crash categories below. Exhibit 4-7 shows how the number of crashes for these crash types has changed between 2002 and 2012.
Because the fatalities shown in Exhibit 4-7 can involve a combination of factors, FHWA has developed targeted programs that include collaborative and comprehensive efforts to address all three of these areas. The Focused Approach to Safety Program works to address the most critical safety challenges by devoting additional effort to high-priority States and targeting technical assistance and resources. More information is available at http://safety.fhwa.dot.gov/fas/.
In 2012, FHWA issued the Guidance Memorandum on Promoting the Implementation of Proven Safety Countermeasures. This guidance considers the latest safety research to advance a group of countermeasures that have shown great effectiveness in improving safety. The nine counter-measures address the three focus areas of the Focused Approach to Safety Program. This combined approach is designed to provide consistency in safety programming, target limited resources to problem areas, and implement safety countermeasures that are likely to yield the greatest results in reducing the number of crash-related fatalities and injuries. More information on this approach can be found at http://safety.fhwa.dot.gov/provencountermeasures/.
Roadway Departures
In 2012, the number of roadway departure fatalities was 17,532, which accounted for 52.2 percent of all traffic fatalities. A roadway departure crash is defined as a nonintersection crash that occurs after a vehicle crosses an edge line or a center line, or otherwise leaves the traveled way. In some cases, a vehicle crossed the center line and struck another vehicle, hitting it head on or side-swiping it. In other cases, the vehicle left the roadway and struck one or more constructed or natural objects, such as utility poles, embankments, guardrails, trees, or parked vehicles.
Roadway Departure Focus States and Countermeasures
Roadway Departure Focus States are eligible for additional resources and assistance based on their average number of roadway departure fatalities over 3 years and the roadway departure fatality rate per vehicle miles traveled (VMT). In addition, FHWA considers the urban and rural roadway percentages within these States and the ratio of their actual roadway departure fatality rate versus the expected roadway departure fatality rate per VMT based on national urban and rural rates.
FHWA currently offers roadway departure technical assistance in the form of crash data analysis and implementation plan development to State highway agencies that have a particularly high number of roadway departure fatalities. Roadway Departure Implementation Plans have been developed in many States. Each plan is designed to address State-specific safety issues related to roadway departure on both State and local roadways to the extent that relevant data can be obtained and are appropriate based on consultation with State and local agencies and the FHWA Division Office.
FHWA works with participating Roadway Departure Focus States to develop individual data analysis packages focused on crash history and roadway attributes and to identify strategies for use in reducing roadway departure crashes. The plans identify cost-effective countermeasures, deployment levels, and funding needs to reduce the number and severity of roadway departure crashes in the State by a targeted amount consistent with Strategic Highway Safety Plan goals. The final plan quantifies the costs and benefits of a roadway departure-focused initiative and provides a systematic process for implementation.
Three proven safety countermeasures for reducing roadway departure crashes are:
- Longitudinal rumble strips and stripes on two-lane rural roads — Milled or raised elements on the pavement intended to alert inattentive drivers through vibration and sound that their vehicles have left the travel lane;
- Enhanced delineation and friction for horizontal curves — Signs and pavement deployed to warn the driver in advance of the curve, with pavement friction to enable the tires to change the vehicle's direction without skidding; and
- Safety Edge — Technology that shapes the edge of a paved roadway in a way that eliminates tire scrubbing, a phenomenon that contributes to losing control of a vehicle.
Intersections
Of the 33,561 fatalities that occurred in 2012, about 21.7 percent occurred at intersections. Of these, 37.5 percent were rural and 62.5 percent were urban, as shown in Exhibit 4-8.
The United States has more than 3 million intersections, both signalized (controlled by traffic signals) and non-signalized (controlled by stop or yield signs). Many factors can contribute to unsafe conditions at intersections. Road designs or traffic signals might need to be upgraded to account for current traffic levels. Approximately one-third of signalized intersection fatalities involve red-light running.
Pedestrians, Bicyclists, and Other Nonmotorists
While the third of the FHWA focus areas referenced above was pedestrian crashes, the PM-1 Final rule establishes performance measures for the broader category of nonmotorists, which includes pedestrians, bicyclists, skateboarders, roller skaters, and others using nonmotorized forms of transportation. The requirement for reporting on these measures will lead to more data being available in the future, which will be reflected in future editions of this report.
In 2012, 33,561 persons were fatally injured in motor vehicle crashes, of which 17 percent were nonmotorists. Exhibit 4-9 shows that in 2012, 4,750 pedestrians, 726 bicyclists, and 216 other/unknown nonmotorists were killed, totaling 5,692 nonmotorist fatalities.
Nonmotorist fatalities declined 16.6 percent from 5,864 in 2005 to 4,888 in 2009, yet increased each year since 2009, to 5,110 in 2010, to 5,339 in 2011, and to 5,692 in 2012. Pedestrian fatalities rose from 4,108 in 2009 to 4,750 in 2012. Bicyclist fatalities rose from 628 in 2009 to 726 in 2012.
Roadway designs that accommodate all users, referred to as "complete streets," help reduce fatalities and injuries. Such roadway designs feature sidewalks, raised medians, turning access controls, better bus stop placement, better lighting, and traffic calming measures. Instituting policies that accommodate all roadway users ensures that every transportation project becomes a comprehensive safety project. These policies have the added benefit of making walking and biking more attractive options and of enhancing the aesthetic quality and commercial activity on local streets.
Intersection Focus States and Countermeasures
Intersection Focus States are eligible for additional resources and assistance based on their average number of intersection fatalities over 3 years. In addition, FHWA considers the urban and rural roadway percentages within these States and the ratio of their actual intersection fatality rate versus the expected intersection fatality rate per vehicle miles traveled based on national urban and rural rates.
As part of the Focused Approach to Safety, FHWA works with States to develop Intersection Safety Implementation Plans. These plans include the specific activities, countermeasures, strategies, deployment levels, implementation steps, and estimates of funds necessary to achieve intersection safety improvement-a component of a State's Strategic Highway Safety Plan goals. FHWA also assists those States through webinars, technical support, and training courses.
FHWA promotes three proven countermeasures associated specifically with intersection safety:
- Roundabouts — A modern circular intersection defined by a set of specific operational principles designed to create a low-speed environment, high operational performance, and a reduction of conflict points;
- Corridor access management —A set of techniques useful for controlling access to highways, major arterials, and other roadways and that result in improved movement of traffic, reduced crashes, and fewer vehicle conflicts; and
- Backplates with retroreflective border — A device added to traffic signals to improve the visibility of the illuminated face of the signal.
In addition, two countermeasures promoted for pedestrian safety can also improve intersection safety: pedestrian hybrid beacons (pedestrian activated warning devices) and road diets (lane reductions or road rechannelizations).
Exhibit 4-9 Pedestrian and Other Nonmotorist Traffic Fatalities, 2002—2012
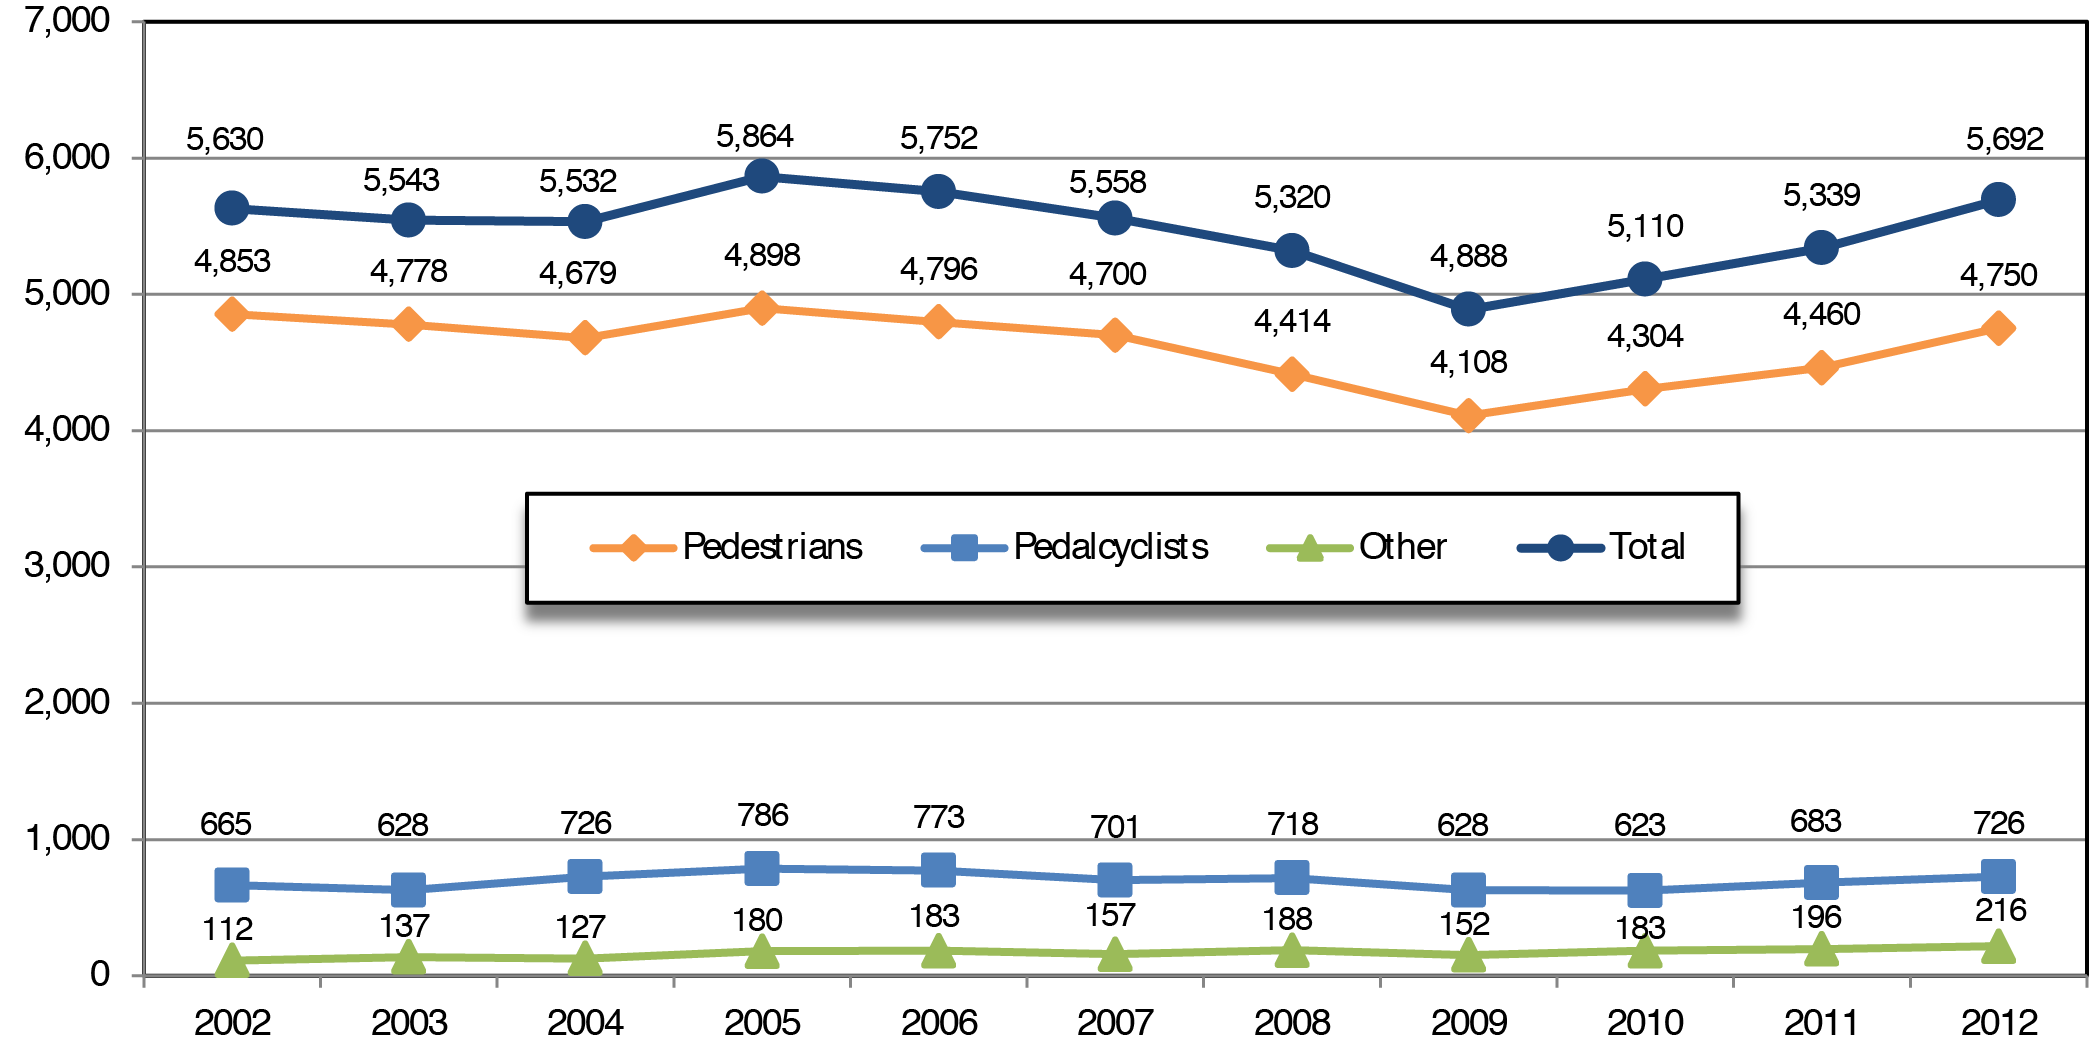
Sources: Fatality Analysis Reporting System/National Center for Statistics and Analysis, NHTSA, 2002-2011 Final and 2012 Annual Report File (ARF).
Pedestrian and Bicyclist Safety Focus States and Cities and Countermeasures
In July 2014, FHWA expanded the pedestrian focus area to include bicyclist and other nonmotorist fatalities. This change was incorporated into the Focused Approach to Safety Program in 2015.
FHWA designates focus States and focus cities for the pedestrian and bicycle focus area. States and cities are eligible to participate as pedestrian and bicycle focus States and cities based on the number of pedestrian and bicyclist fatalities or the pedestrian and bicyclist fatality rate per population over a 3-year period.
FHWA's Office of Safety is aggressively working to reduce pedestrian and bicyclist fatalities by providing resources to focus States and cities. Focused Approach has helped raise awareness of pedestrian and bicyclist safety problems and generate momentum for addressing pedestrian and bicyclist issues. Focused Approach has provided course offerings, conference calls, Web conferences, data analysis, and technical assistance for development of Pedestrian and Bicyclist Safety Action Plans. These plans help State and local officials determine where to begin addressing pedestrian and bicyclist safety issues.
Focused Approach offers free technical support and training courses to focus States and cities and free bimonthly webinars on a comprehensive, systemic approach to preventing pedestrian and bicyclist crashes. Training is available at a cost to nonfocus States and cities through the Pedestrian and Bicycle Information Center, made possible by the National Highway Institute.
FHWA is also promoting three proven countermeasures associated specifically with pedestrian safety:
- Median and pedestrian crossing islands in urban and suburban areas — A refuge area in the middle of the roadway, enhancing pedestrian crossing visibility and reducing the speed of vehicles approaching the crossing.
- Pedestrian hybrid beacons — Pedestrian-activated warning device located on the roadside or on mast arms over midblock pedestrian crossings.
- Road diets — A classic roadway reconfiguration that involves converting an undivided four-lane roadway into three lanes comprising two through-lanes and a center two-way left turn lane.
Transit Safety
This section summarizes national trends in safety and security incidents such as injuries, fatalities, and related performance ratios reported in the National Transit Database (NTD). Safety data are reported by mode and type of service. In December 2011, the NTD safety data included 16 modes. In January 2012, new modes were added to NTD, including
A transit agency records an incident for any event occurring on transit property, on board or involving transit vehicles, or to persons using the transit system that results in one of the following:
- One or more confirmed fatalities within 30 days of the incident;
- One or more injuries requiring immediate transportation away from the scene for medical attention;
- Total property damage to transit property or private property exceeding $25,000;
- Evacuation for life safety reasons;
- Mainline derailment (i.e., occurring on a revenue service line, regardless of whether the vehicle was in service or out of service); or
- Fire.
Additionally, a transit agency records an incident whenever certain security situations occur on transit property, such as:
- Robbery, burglary, or theft;
- Rape;
- Arrest or citation, such as for trespassing, vandalism, fare evasion, or assault;
- Cyber security incident;
- Hijacking; or
- Nonviolent civil disturbance that disrupts transit service.
- streetcar — previously reported as light rail,
- hybrid rail — previously reported as light rail,
- commuter bus — previously reported as motor bus,
- bus rapid transit — previously reported as motor bus, and
- demand-response-taxi — previously reported as demand response.
NTD does not compile safety data for commuter rail systems, which is managed and collected by the Federal Railroad Administration (FRA). This section presents statistics and counts of basic aggregate data such as injuries and fatalities for those systems. For 2012, data were received from 49 rail transit systems, more than 750 urban fixed-route bus providers, and 1,357 rural agencies. Reported events occurred on transit property or vehicles, involved transit vehicles, or affected persons using public transportation systems.
Incidents, Fatalities, and Injuries
A transit agency records an incident for a variety of events occurring on transit property or vehicles, involving transit vehicles, or affecting persons using the transit system. Included among these events is any that results in significant property damage, one or more reported injuries, one or more reported fatalities, or some combination thereof. From 2002 to 2007, the definition of significant property damage was total property damage exceeding $7,500 (in current-year dollars, not indexed to inflation); this threshold increased to $25,000 in 2008.
Injuries and fatalities data in NTD are reported by type of person involved in incidents. Passengers are defined as persons traveling, boarding, or alighting a transit vehicle. Patrons are individuals who are in a rail station or at a bus stop but are not necessarily boarding a transit vehicle. Employees are individuals who work for the transit agency, including both staff and contractors. Public includes pedestrians, occupants of other vehicles, and other persons.
Person types are defined as
- Passengers: Individuals on board a transit vehicle or boarding or alighting a transit vehicle.
- Patrons: Individuals waiting for or leaving transit at stations; in mezzanines; on stairs, escalators, or elevators; in parking lots; or on other transit-controlled property.
- Public: All others who come into contact with the transit system, including pedestrians, automobile drivers, and trespassers.
- Workers: Transit agency employees or contractors engaged in operations or maintenance but not construction of new transit infrastructure.
- Suicides: Individuals who come into contact with the transit system intending to harm themselves
Any event for which an injury or fatality is reported is considered an incident. An injury is reported when a person has been transported immediately from the scene for medical care. A transit-related fatality is reported for any death occurring within 30 days of a transit incident that is confirmed to be a result of that incident. These statistics, however, do not include fatalities resulting from medical emergencies on transit vehicles.
Incidents also are recorded when property damage exceeds $25,000 regardless of whether the incident resulted in injuries or fatalities.
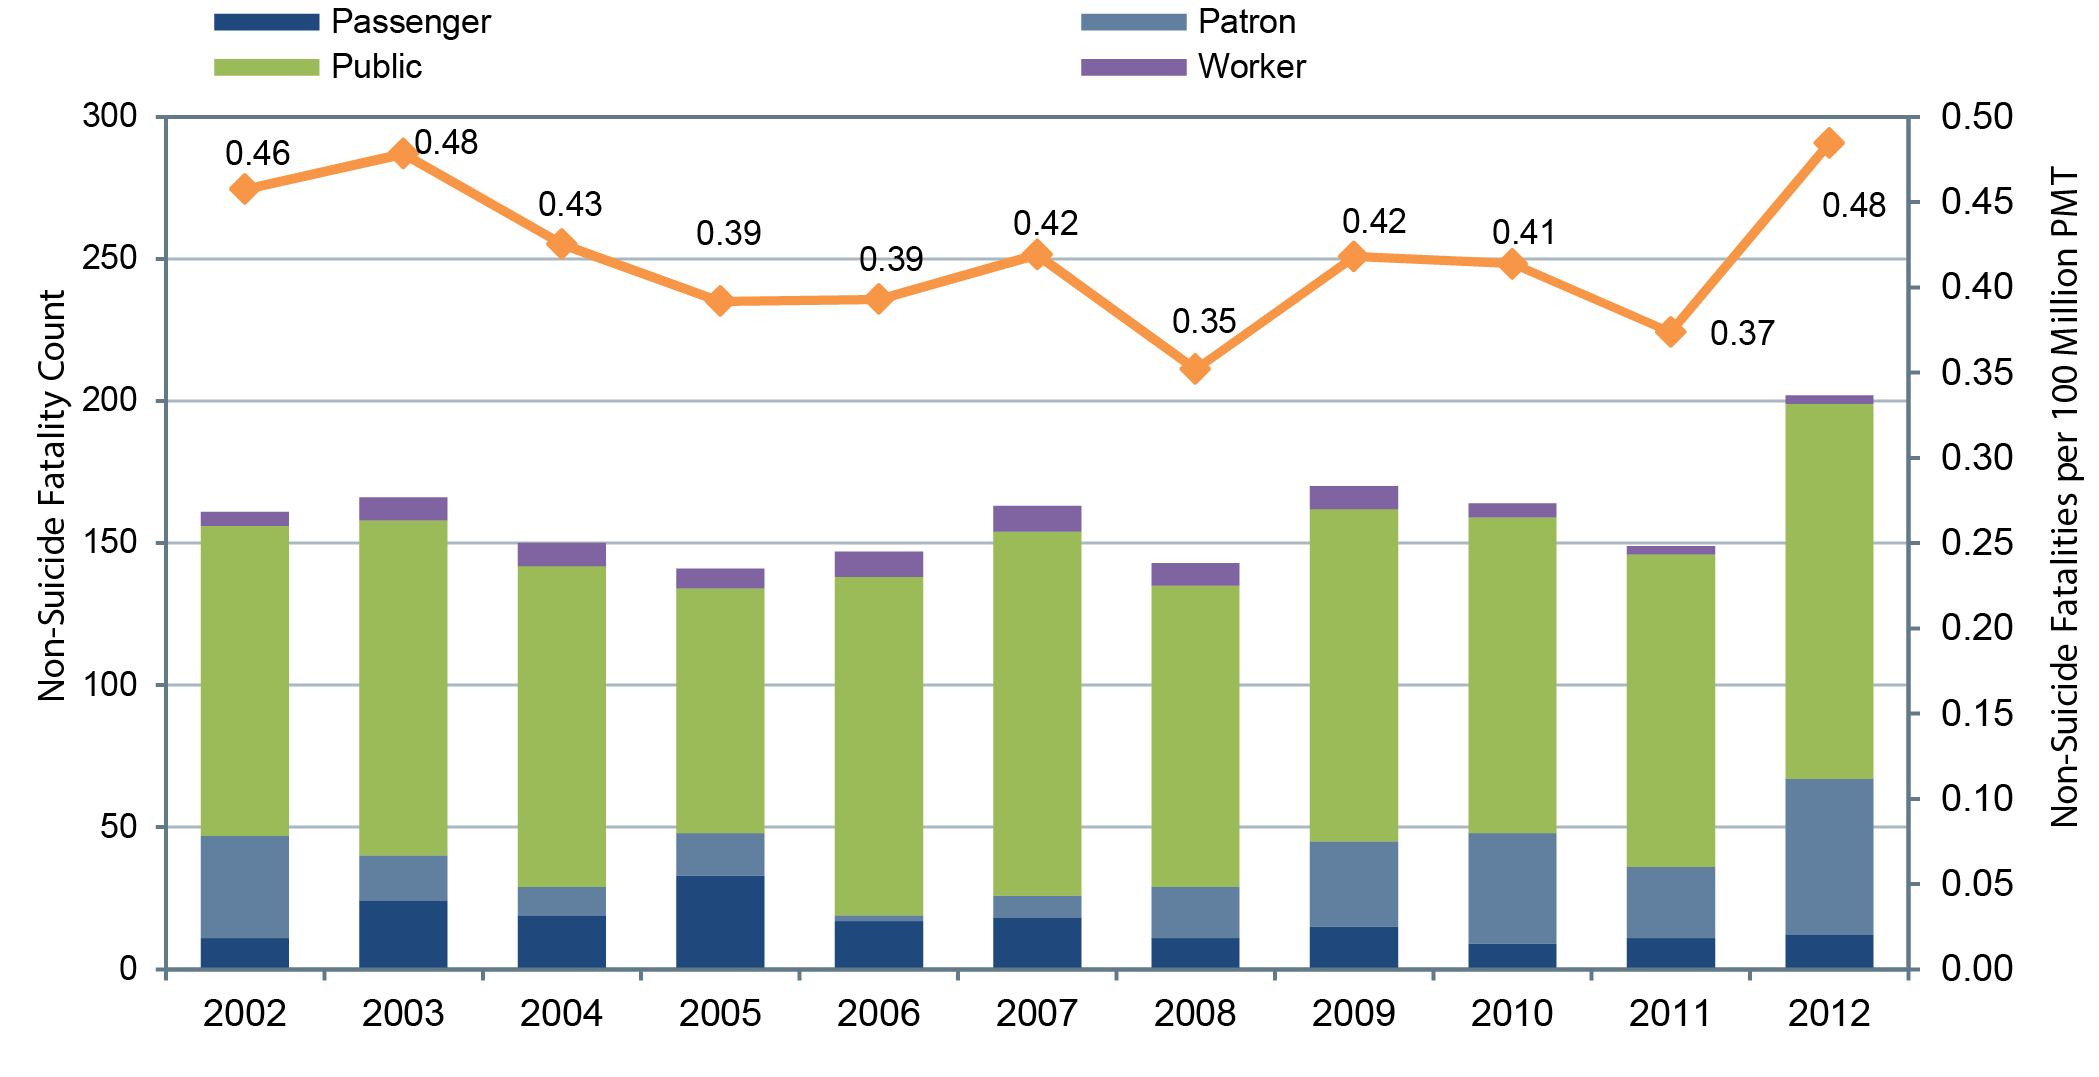
Since 2008, nationwide, collisions involving transit vehicles and pedestrians, bicyclists, motorists, and individuals waiting in stations, at stops, and rail grade crossings have resulted in approximately 140 fatalities per year. Exhibit 4-10 shows data on fatalities, excluding suicides, both in total fatalities and fatalities per 100 million passenger miles traveled (PMT) for heavy rail, light rail, demand response, and fixed-route bus. From 2002 to 2011, the number of fatalities per 100 million PMT has remained relatively static, but it increased significantly in 2012.
Public transit interaction with pedestrians, cyclists, and motorists at rail grade crossings, pedestrian crosswalks, and intersections largely influences overall transit safety performance. Most fatalities and injuries result from interaction with the public on busy city streets, trespassing on transit right-of-way and facilities, and suicide. Pedestrian fatalities accounted for 23 percent of all transit fatalities in 2012.
Exhibit 4-11 shows the transit fatality rate by person type between 2002 and 2012. Transit workers and passengers typically account for the lowest fatality rate by person type. In 2012, worker fatalities accounted for 2 percent of all fatalities. In response to recent events in 2013 involving roadway workers, the National Transportation Safety Board issued a series of safety recommendations to support needed improvements in this area. The FTA responded in December 2013 by issuing Safety Advisory 14-1: Right-of-Way Worker Protection.
Exhibit 4-10 Annual Transit Fatalities Excluding Suicides, 2002—2012
1Exhibit includes data for DR, HR, LR, and MB. Fatality totals include both directly operated (DO) and purchased-transportation (PT) service types.
Source: National Transit Database-Transit Safety and Security Statistics and Analysis Reporting.
Exhibit 4-11 also highlights the relatively few fatalities in transit per passenger mile. Suicides steadily increased to a peak of 79 in 2011, then decreased to 63 in 2012. On average, suicides and persons who are not transit passengers or patrons (usually pedestrians and drivers) account for approximately 75 percent of all public transportation fatalities. This situation creates distinct challenges for public transportation agencies and FTA, because the causes of these fatalities are largely beyond the control of transit operators. In 2013, FTA, in partnership with Operation Lifesaver, made grant funds available to transit and local government agencies to develop safety education and public awareness initiatives for rail transit to ensure that people are safe near trains, tracks, and at crossings. Such awareness is increasingly important for drivers and pedestrians as rail transit expands into new communities across the country. To receive a grant, projects must provide a 25-percent match and focus on safety education or public awareness initiatives in communities with rail transit systems (commuter rail, light rail, and streetcar) using Operation Lifesaver-approved materials. (2014 Annual Report: The U.S. Department of Transportation's (DOT) Status of Actions Addressing the Safety Issue Areas on the National Transportation Safety Board's Most Wanted List.)
Exhibit 4-12 shows fatalities for the transit industry that include suicide data. The number and rate of suicides increased each year through 2011 and decreased in 2012.
Exhibit 4-12 Annual Transit Fatalities Including Suicides, 2002—20121
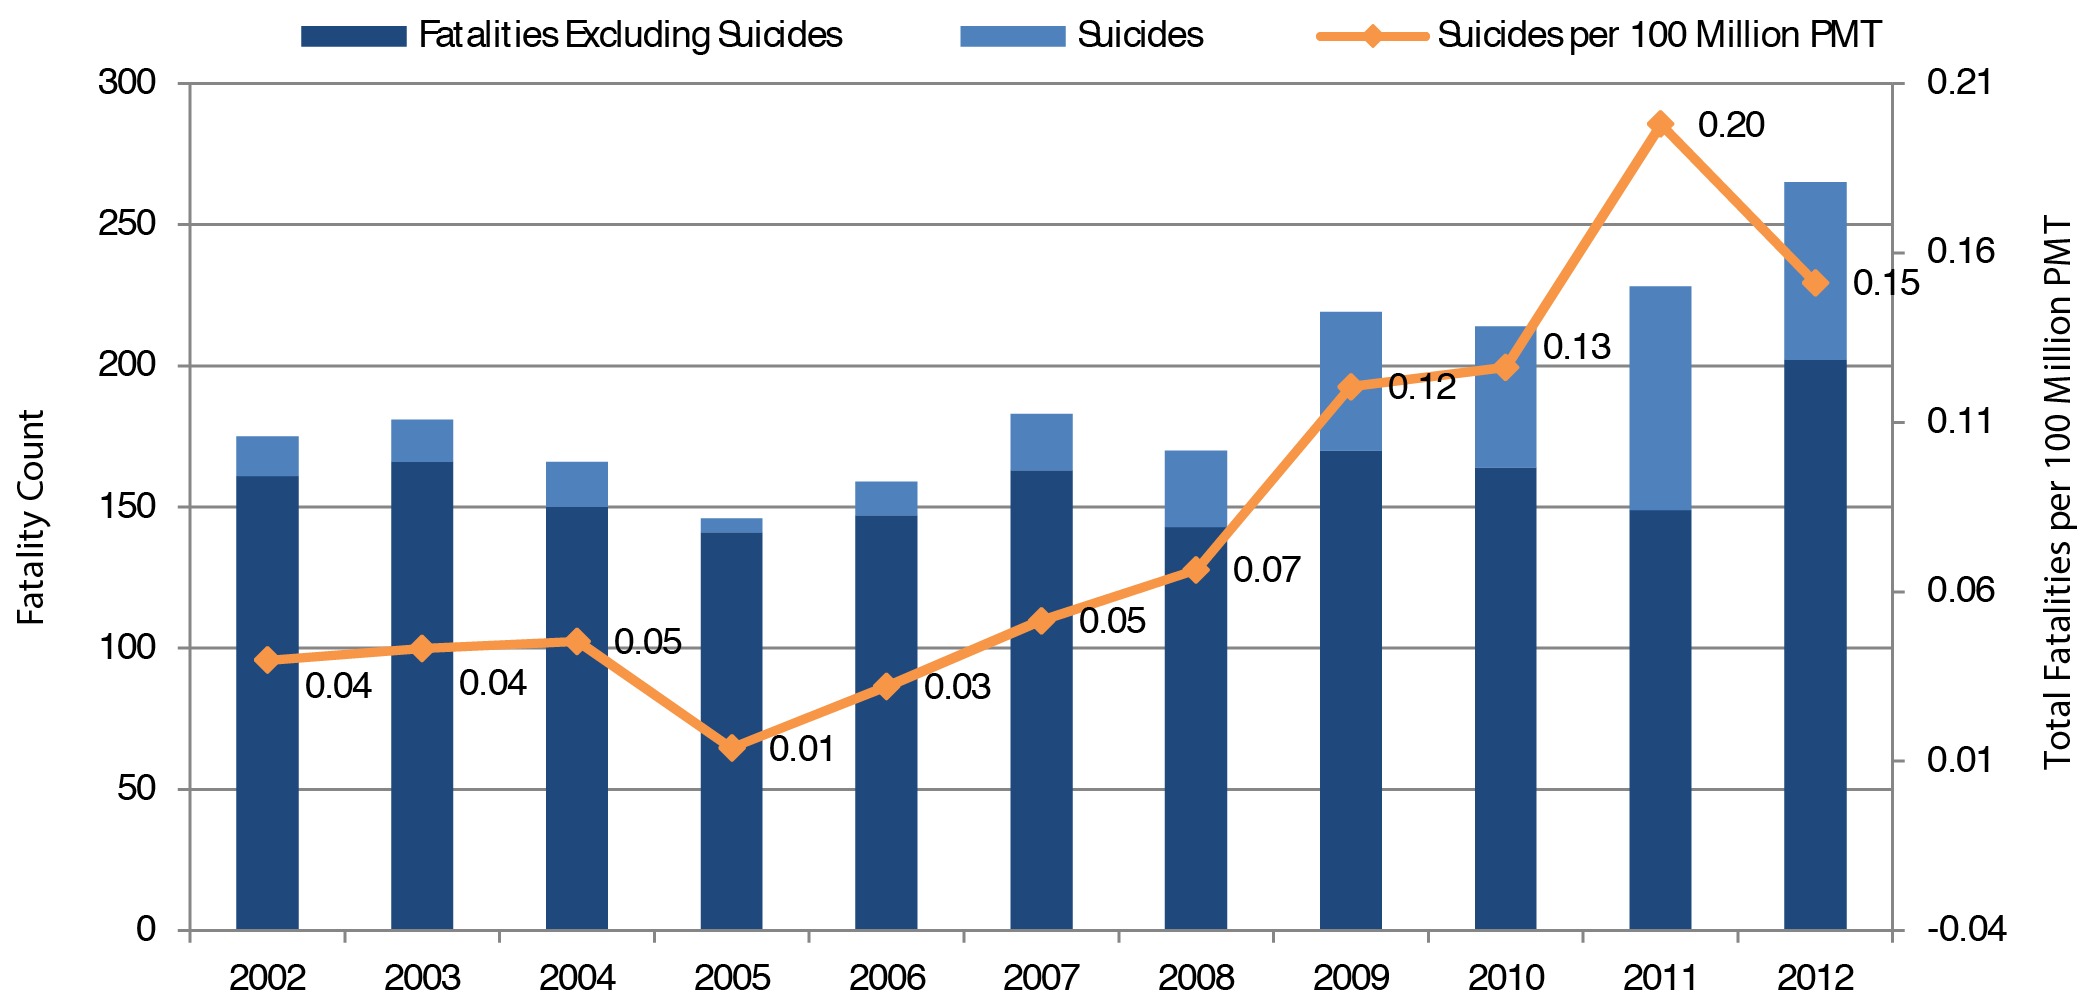
1Exhibit includes data for DR, HR, LR, and MB. Fatality totals include both directly-operated (DO) and purchased-transportation (PT) service types.
Source: National Transit Database-Transit Safety and Security Statistics and Analysis Reporting.
Exhibit 4-13 shows transit injury rates by person type. Although transit incident occurrences and impacts fluctuate from year to year, the occurrence of injuries to transit persons appears to be decreasing since 2009. Transit agencies, however, are becoming increasingly concerned with the recent increase in patron fatalities: In 2011, patron fatalities accounted for 21 percent of total fatalities, up from a low of 4 percent in 2007.
Exhibit 4-14 shows fatalities per 100 million PMT for fixed-route bus and demand response (including suicides). The fatality rate for demand response is more volatile than for fixed-route bus. This observation is not unexpected, as fewer people use demand response and even one or two more fatalities in a year can make the rate jump significantly. Fatality rates have not changed significantly for fixed-route bus. Note that the absolute number of fatalities is not comparable across modes because of the wide range of passenger miles traveled on each mode.
Exhibit 4-14 Annual Transit Fatalities Excluding Suicides by Highway Mode per 100 Million PMT, 2002—20121
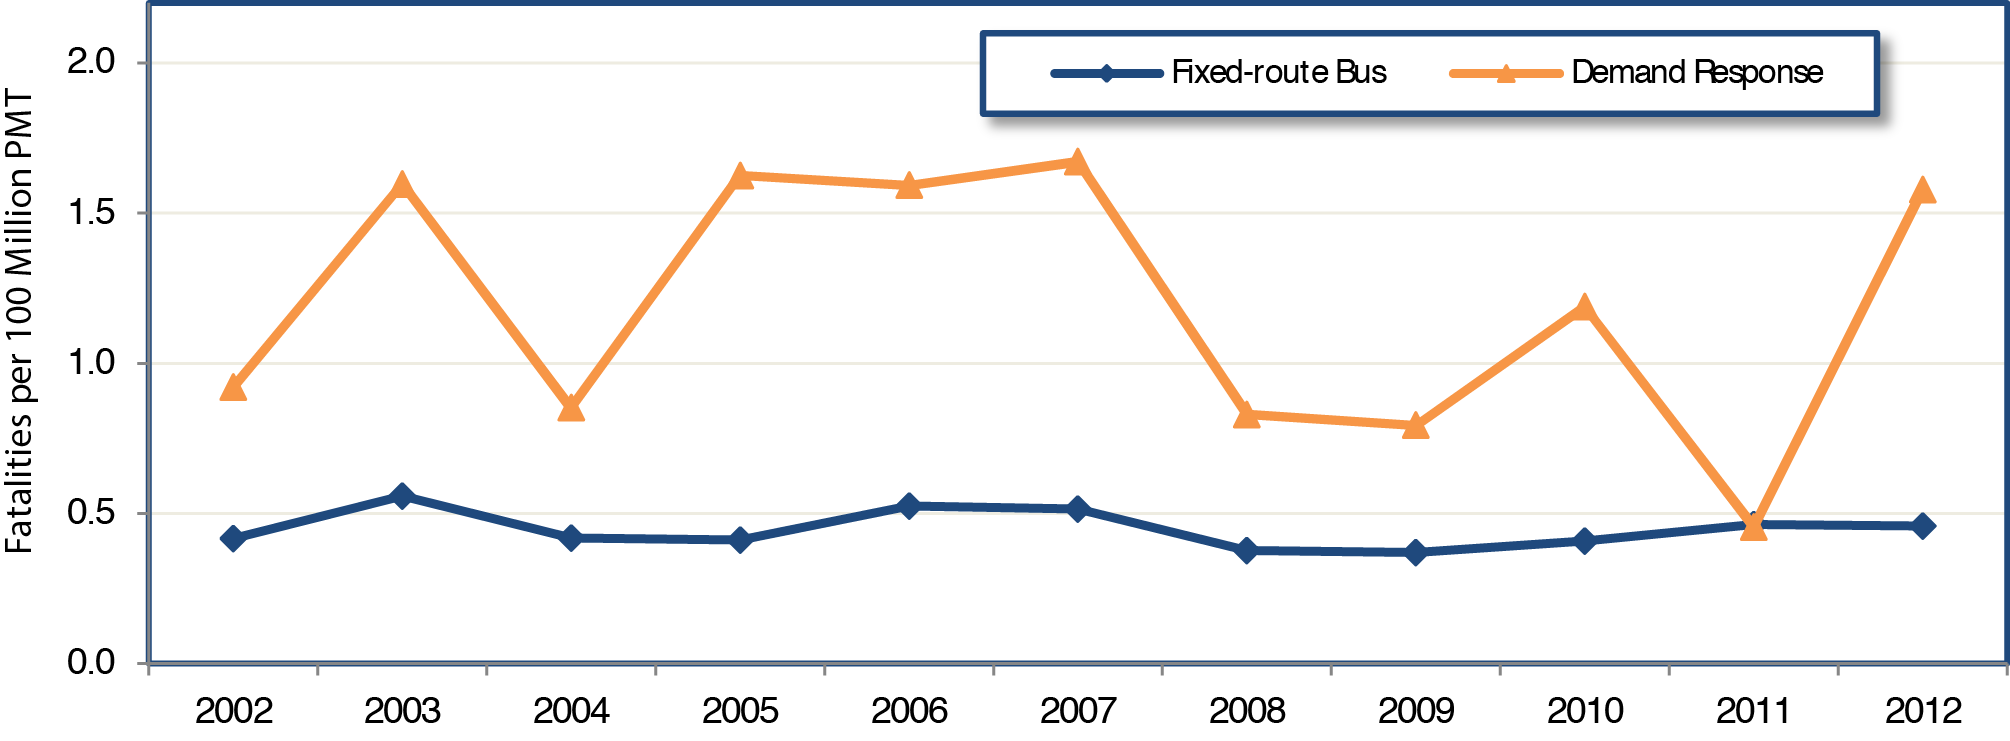
1Fatality totals include both DO and PT service types.
Source: National Transit Database.
Exhibit 4-15 shows fatalities per 100 million PMT for heavy rail and light rail (including suicides). Heavy-rail fatality rates remained relatively stable from 2009 through 2012. Suicides represent a large share of fatalities for heavy rail-45 percent in 2012. Light rail experienced more incidents than heavy rail as many systems are streetcars operating in non-dedicated guideways and generally pick up passengers from roadside stops rather than from station platforms.
Exhibit 4-15 Annual Transit Fatalities Excluding Suicides by Rail Mode per 100 Million PMT, 2002—20121
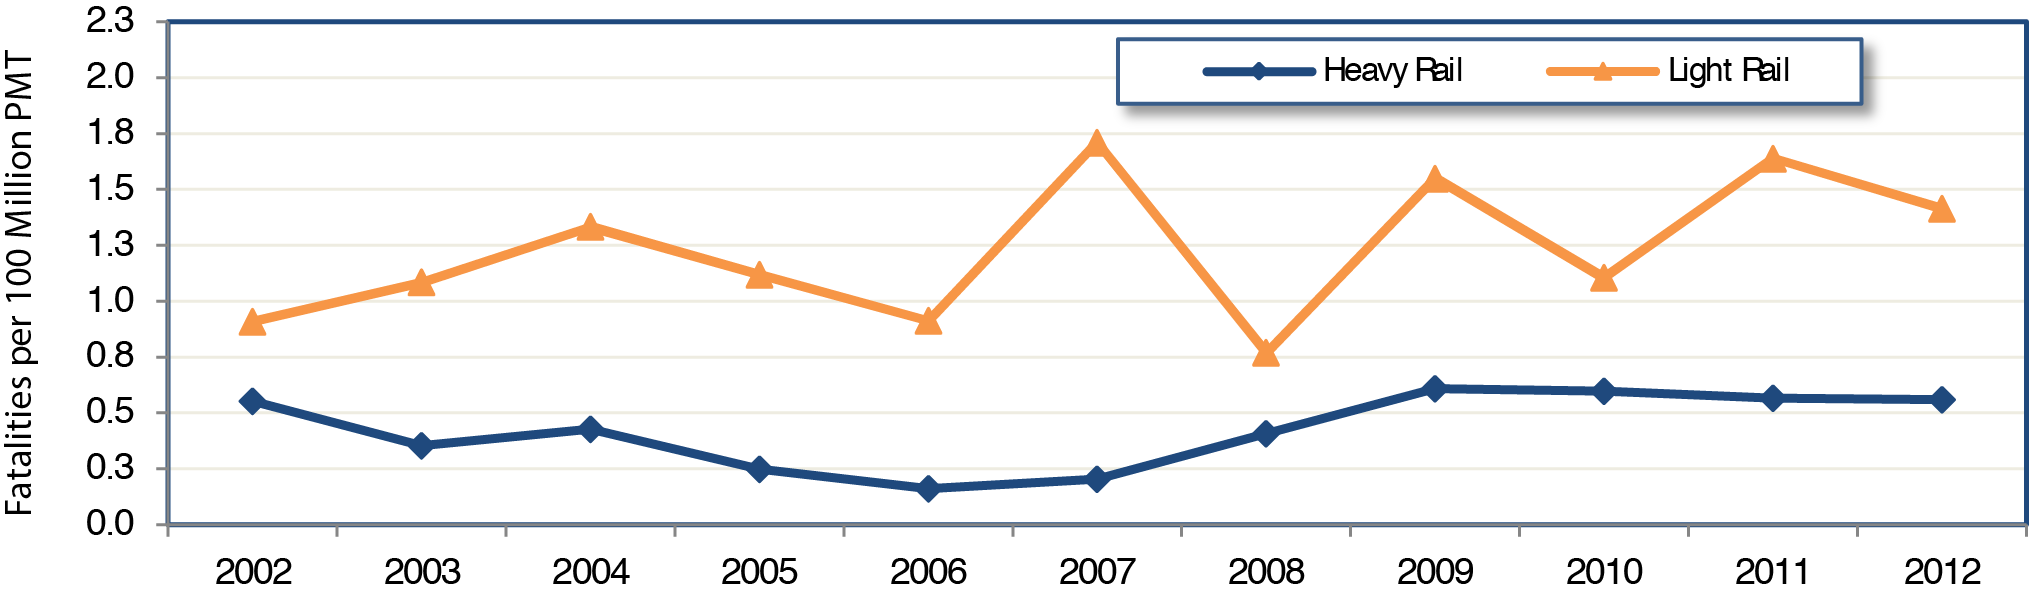
1Fatality totals include both DO and PT service types. Rail modes include heavy rail and light rail.
Source: National Transit Database.
The analysis that follows is by mode, which includes all major modes reported in NTD with the exception of commuter rail. Safety data for commuter rail are included in FRA's Rail Accident/Incident Reporting System (RAIRS). The RAIRS database records fatalities that occurred because of a commuter rail collision, derailment, or fire. The database also includes a category called "not otherwise classified," which includes fatalities that occurred because of a slip, trip, or fall. Before 2011, RAIRS did not include a separate category for suicides, which are reported in NTD for all modes. Therefore, for comparative purposes, suicides are excluded from this analysis.
Exhibit 4-16 shows incidents and injuries per 100 million PMT reported in NTD for the two main highway modes in transit, fixed-route bus and demand response, and two main rail modes, heavy rail and light rail. Commuter rail is presented separately as those data were collected according to different definitions in RAIRS. The data in Exhibit 4-16 suggest that the incidents in highway modes (fixed-route bus and demand response) decreased between 2004 and 2012. Injuries for demand response remained flat. Data for rail modes show decreasing trend in incidents per 100 million PMT for light rail but no trend in injuries (either increasing or decreasing) per 100 million PMT. Both incidents and injuries per 100 million PMT for heavy rail showed increasing trends.
Exhibit 4-17 shows the number of fatalities, and the fatality rate, for commuter rail. These data were obtained from FRA's RAIRS (suicides not included). In 2012, 201 fatalities (excluding suicides) were recorded in NTD for all modes except commuter rail. Fatalities per 100 million PMT (excluding suicides and commuter rail) was 0.46. For commuter rail, however, the total number of fatalities in 2012 was 86, with a fatality rate of 0.77-significantly higher than the national aggregate rate (0.46). The national rate with suicides included is 0.6, which is less than the rate for commuter rail.
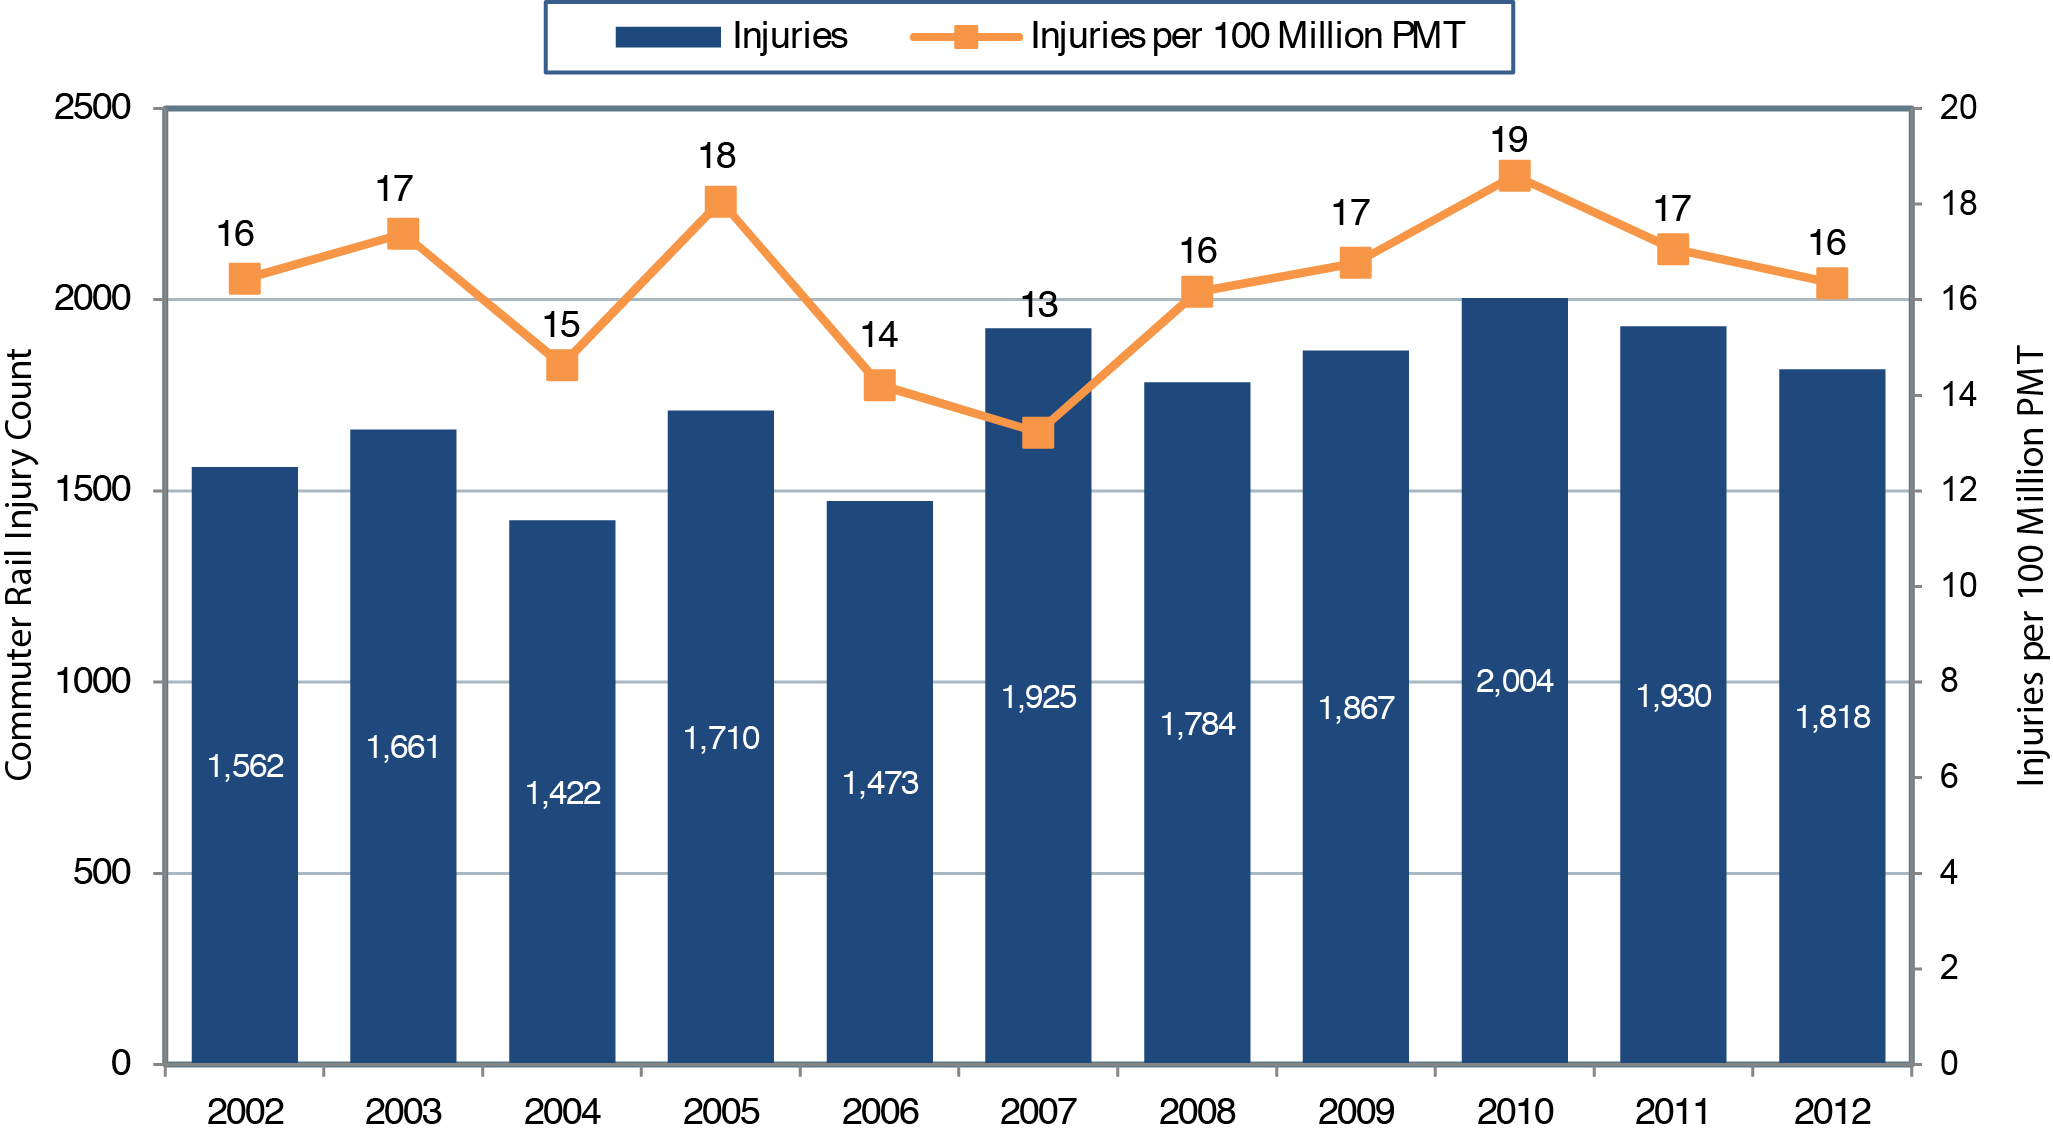
Exhibits 4-18 and 4-19 show the number of commuter rail incidents and the injuries per 100 million PMT, respectively. Although commuter rail has a very low number of incidents per PMT, commuter rail incidents are far more likely to result in fatalities than incidents occurring on any other mode. One contributing factor might be that the average speed of commuter rail vehicles is considerably higher than the average speeds of other modes (except vanpools). The number of both incidents and injuries declined from 2007 to 2008, steadily increased to a peak in 2010, and then declined again between 2011 and 2012.
Exhibit 4-17 Commuter Rail Fatalities, 2002—2012
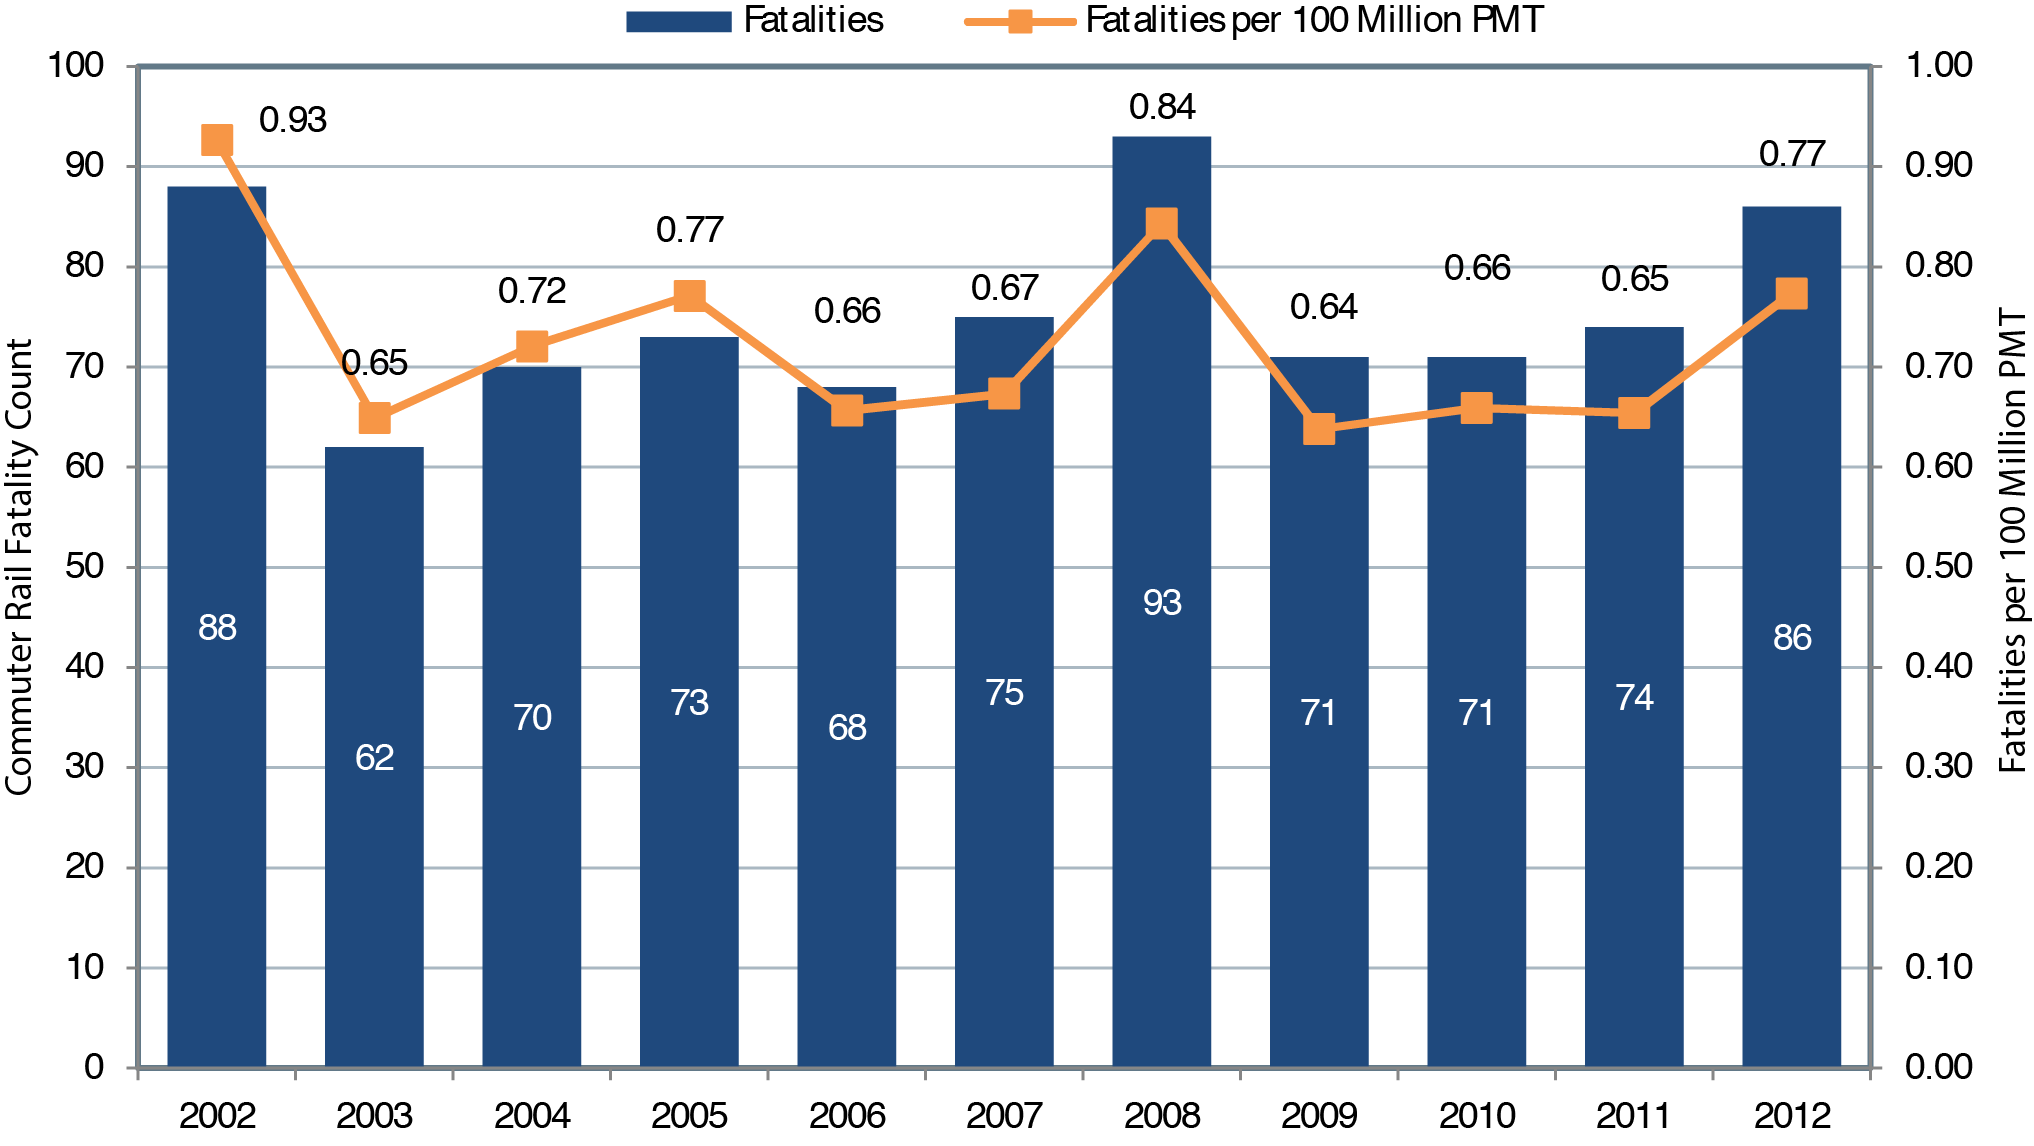
Source: Federal Railroad Administration Rail Accident/Incident Reporting System.
Exhibit 4-18 Commuter Rail Incidents, 2002—2012
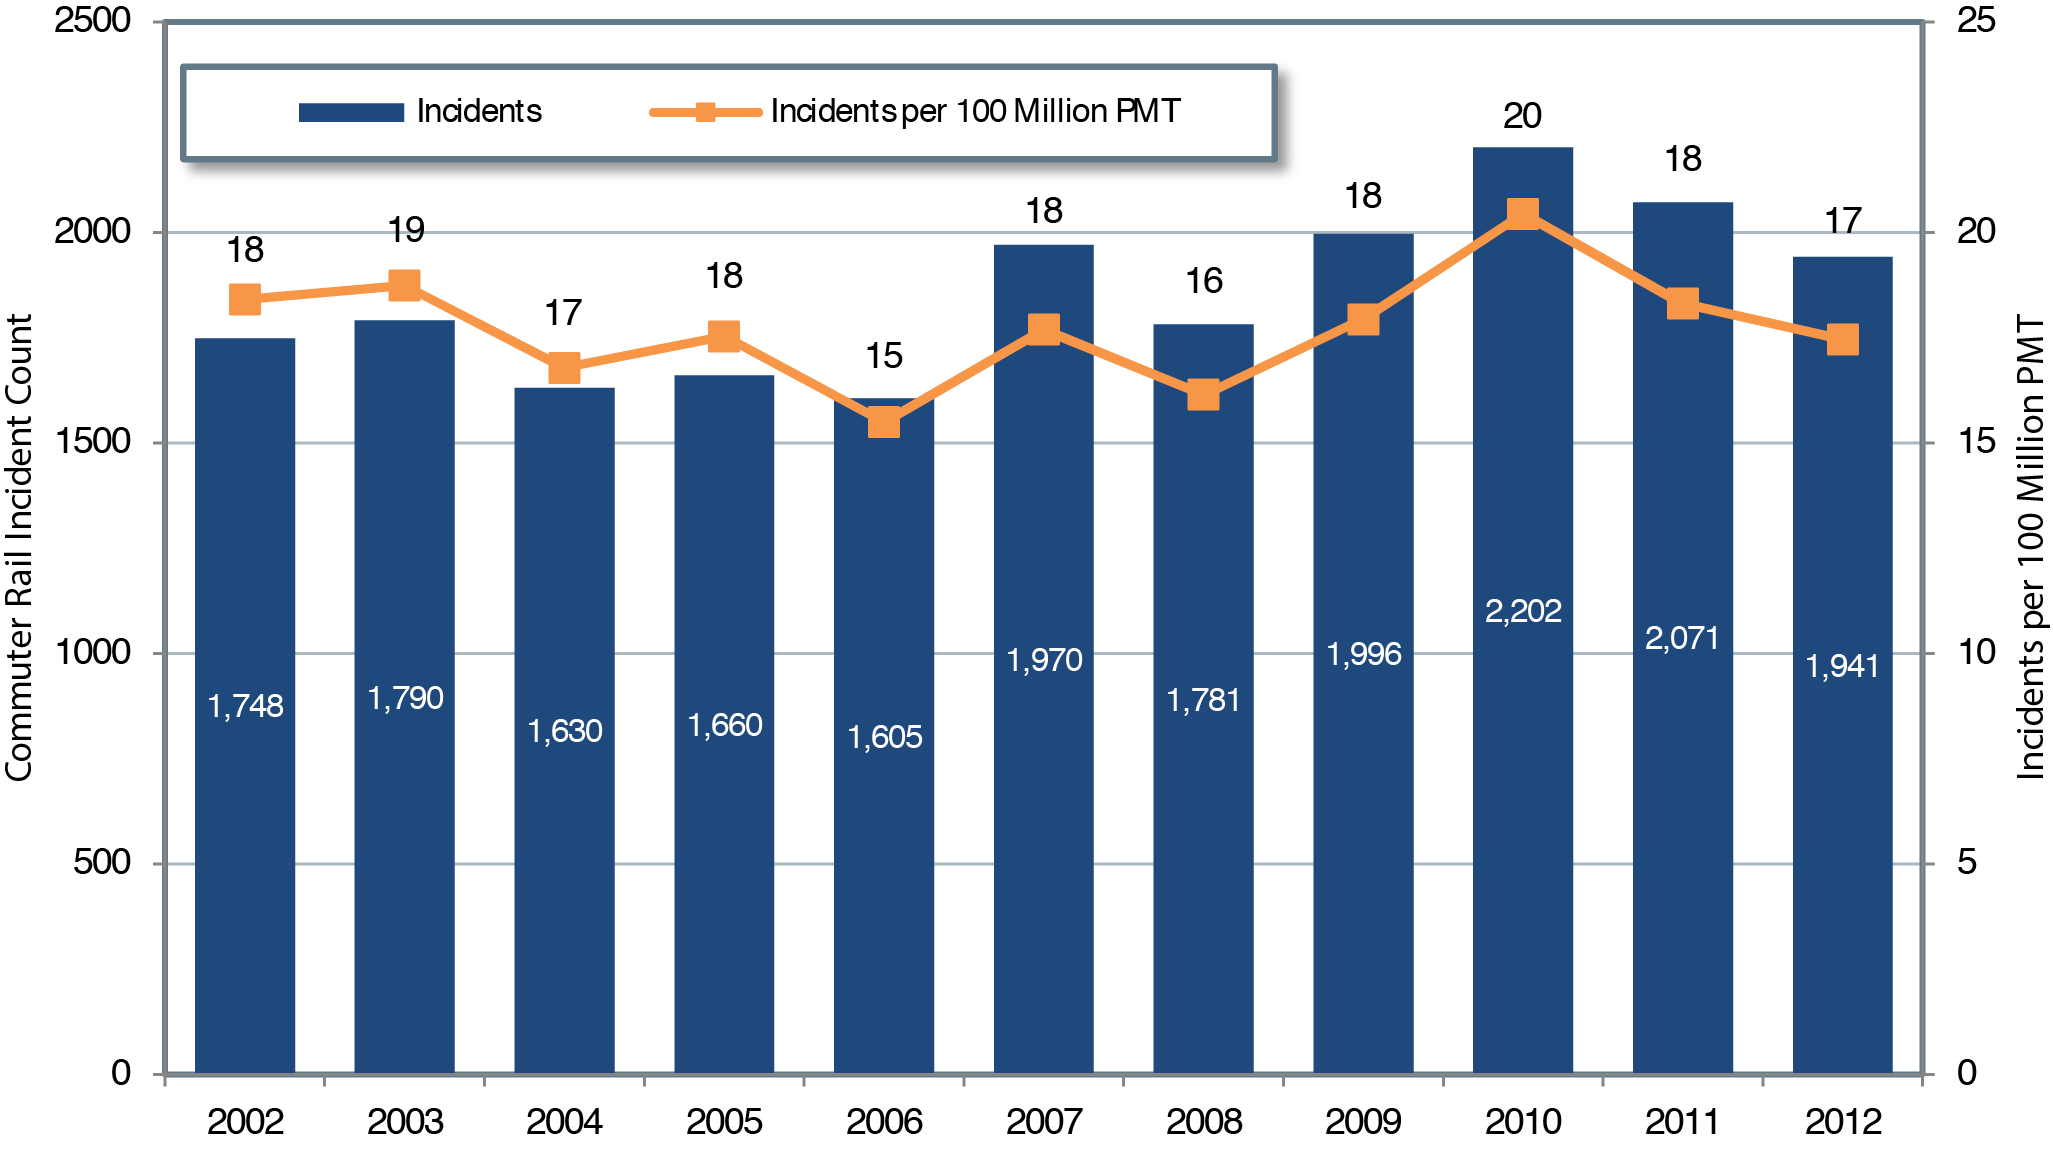
Source: Federal Railroad Administration Rail Accident/Incident Reporting System.
Exhibit 4-19 Commuter Rail Injuries, 2002—2012
Source: Federal Railroad Administration Rail Accident/Incident Reporting System.