U.S. Department of Transportation
Federal Highway Administration
1200 New Jersey Avenue, SE
Washington, DC 20590
202-366-4000
| Highway Statistics 2006 | OHPI > Highway Statistics > 2006 > NHTS > Table NT-6 |
| Vehicle Type | Percent of Household Vehicles | Avg. Age | Annual Miles Per Vehicle | Average Miles per Gallon (Fuel Economy) | Cost per Mile (2006) |
|---|---|---|---|---|---|
| Car | 59.90% | 8.0 | 11,755 | 22.4 mpg | 14.1 cents |
| Van | 9.40% | 6.6 | 13,541 | 18.4 mpg | 16.6 cents |
| SUV | 12.50% | 5.6 | 14,091 | 16.7 mpg | 18.4 cents |
| Pick-Up | 18.20% | 9.1 | 12,522 | 16.9 mpg | 18.3 cents |
| Overall | 100.00% | 7.8 | 12,111 | 20.3 mpg | 15.6 cents |
| Base: NHTS, 2001, FHWA |

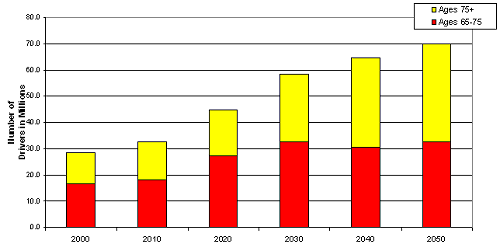
| Age group | Ages 65-75 | Ages 75+ |
|---|---|---|
| 2000 | 16.5 | 12.1 |
| 2010 | 18.3 | 14.3 |
| 2020 | 27.3 | 17.4 |
| 2030 | 32.6 | 25.6 |
| 2040 | 30.5 | 34.1 |
| 2050 | 32.6 | 37.3 |
This table is also available for download in the following formats:
To view PDF files, you need the Acrobat® Reader®.
OHPI Home | Highway Statistics 2006 | Data Feedback