U.S. Department of Transportation
Federal Highway Administration
1200 New Jersey Avenue, SE
Washington, DC 20590
202-366-4000
|
< Previous | Contents | Next > The primary objective of the evaluation effort is to examine the impacts of the changes implemented by FHWA as part of the continuous improvement of the model on the fuel tax attribution process. These changes are intended to improve efficiency and quality of the fuel tax attribution process. As part of the evaluation effort, detailed documentation of the fuel tax attribution process is developed and presented in Chapter 2 of this report. Also, the instructions or guidelines to the states regarding reporting fuel tax data was reviewed and a report presented in a separate document. Two major changes that are the focus of this evaluation effort are the following:
This chapter focuses on the impacts of these changes on the fuel tax attribution process. The specific evaluation goals and measures are discussed in the following sections. This chapter also discusses potential actions items directed at further improving the quality of fuel tax data reported by states and efficiency of the attribution process as a whole. A detailed review of the fuel tax attribution methodology was conducted using the framework outlined below. The evaluation framework consisted of three major steps involving collecting and analyzing information necessary to provide a comprehensive assessment of the methodology. First, the goals or expectations from the motor fuel tax attribution system were identified. Second, measures for evaluating the various goals were established. Third, the hypotheses to be used to evaluate the fuel tax attribution system were developed. The evaluation goals are system performance, data process quality, risk management, and institutional issues as they relate to the fuel tax attribution process. These evaluation goals are discussed below. 3.2.1 Legacy System Performance The legacy system performance goal area evaluates the ability, efficiency, and reliability of the system to perform its intended functions of accepting, analyzing data, and delivering accurate and consistent state fuel tax attributions. Evaluating this goal area involves a detailed review of data processing methodology including the assumptions and business rules. It also involves assessing the quality of the input data attribution results. Quality is measured in terms of accuracy, completeness, timeliness, and reliability. Accuracy of attributions is defined in terms of correlation between state-reported fuel consumption data and HTF attributions. Reliability was defined in terms of the consistency of the HTF attributions as a function of data provided by the states. System efficiency is defined in terms of the throughput in the fuel tax processing system. The data processing quality goal area evaluates the quality of data analysis procedures applied in processing of motor fuel tax data from the states. This goal area includes the business rules (rules-of-thumb, assumptions, and formulas used in the estimation models) and how these affect the results of the attribution process. This goal assesses the validity of the business rules and the consistency with which they are applied. Risk management is defined as the systematic application of policies, practices, and resources to the assessment and control of risk. With specific reference to the fuel tax attribution process, risk management relates to the policies, resources, and practices to ensure high quality data from the states, and efficient data acquisition processes and reliable and consistent data analysis tools and processes. It also includes consistent application of policies and procedures regarding data collection, analysis, and reporting HTF attributions. These practices are intended to minimize the risks associated with using incomplete and/or inaccurate data (intentionally or unintentionally), double counting, unreliable analytical procedures, and inconsistent application of business rules. The risks include unfairness, inequity, and inconsistency in the attribution of HTF to the states. The standard approach to risk management involves three major steps: (i) identify the potential risk, the cause, and consequence; (ii) identify control and mitigation options; and (iii) monitor and evaluate the control and mitigation measures. This goal area evaluates the reliability and consistency of the fuel tax data processing methodology, and the impacts of the quality of state reported data on the attribution process and HTF attributed to the states. This goal area identifies any institutional issues related to data acquisition and handling as well as attribution of fuel tax revenues. This includes institutional arrangements that affect the fuel tax data processing directly or indirectly. In order to improve the focus of the evaluation, a set of measures has been identified for each of the goals. The hypotheses are selected to reflect the overall objectives of the review. Table 3-1 shows the evaluation framework and summarizes the goal areas, measures, and hypotheses. The measures were used to test the hypotheses. The evaluation approach adopted is outlined in the following section. Table 3-1. Evaluation Goals, Hypotheses, and Measures
Evaluation of the goal areas involves five main analyses or studies directed at assessing the impacts of the changes implemented as part of the FHWA's continuous improvement model. Table 3-2 maps the evaluation goals to the analyses conducted. There is considerable overlap among the studies or analyses in terms of the goal areas that they address. For example, the risk management goal area is addressed by almost all analyses. The following sections describe the analyses conducted. The process review involves detailed review and documentation of the fuel tax data analysis procedures. Description of data processing methodology includes detailed documentation of the attribution process, description spreadsheets, assumptions, business rules, and estimation models. This process review primarily addresses the evaluation goals of system performance, data processing quality, and risk management. The evaluation measures include system reliability, consistency in the application of business rules, consistency of outputs from the attribution process, and inconsistencies in the fuel tax data analysis process. The review identified and documented data flow sequences, inputs, and outputs generated by each step in the data analysis process. As part of the review, the business rules and assumptions underlying the data analysis processes were identified and documented. Chapter 2 of this report presents the process review. A secondary objective of the process review was to document the fuel tax attribution process to a sufficient level of detail that readers can understand the seemingly complex process. Providing such level of detail offers transparency that is considered part of the risk management associated with fuel tax attribution process because it allows potential causes and consequences to be easily traced and addressed. Table 3-2. Evaluation Approaches Addressing Goal Areas
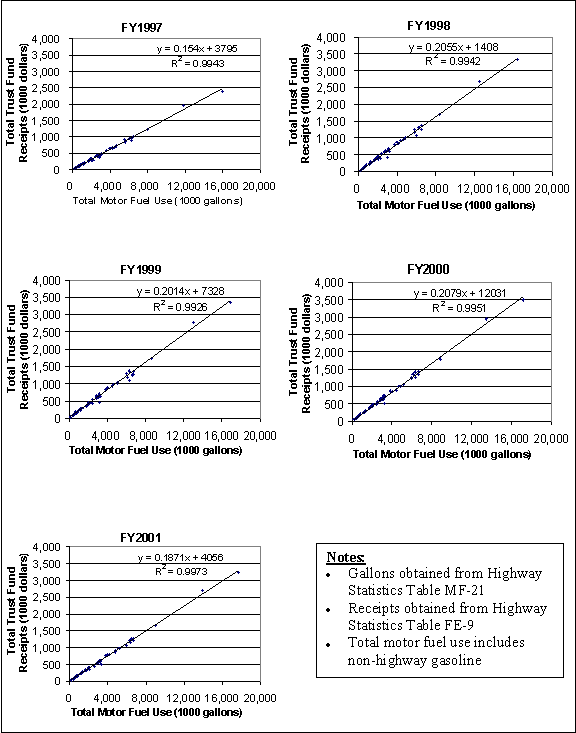
3.3.2 Statistical Data Analysis Statistical analyses were conducted to evaluate the system reliability and efficiency as well as data process quality goal areas. Indirectly, the results of the statistical analyses were used to evaluate the risk management goal area of the fuel tax attribution process. The statistical analysis was used to evaluate the four measures - system reliability, consistency of business rule application, consistency of attribution outputs, and data analysis process inconsistency. The primary objective of the statistical analysis, therefore, was to examine the consistency and reliability of the fuel data analysis process used by FHWA. To achieve this objective, the relationships between the number of gallons of fuel reported and the HTF attributions to the states were examined. Simple regression analysis was used to explore the relationships. The results of this analysis also establish the validity of the assumptions and business rules applied. Fuel tax attribution data published in the Highway Statistics over the past five years (1997-2001) on number of gallons reported and amounts attributed to the states were in the statistical analysis. This analysis is a detailed review of the smart data entry tool that addresses the goals of system efficiency (or performance), data process quality, and risk management as noted earlier. The Smart Input Tool is one of the improvements implemented by FHWA as part of the continuous improvement model. The tool is intended to help improve the quality of data submitted by the states by reducing errors and the need to enter data twice, improve efficiency of the data acquisition and analysis process, and above all reduce the risks associated with incomplete and inaccurate data. The measures considered in evaluating the input tool are data errors and inconsistencies in the data analysis process. The main sources of error in the legacy system were identified to include: (i) data entry (i.e., key punching); (ii) inconsistencies between number of gallons reported on Form 551M and the dollar amounts on Form 556; (iii) misapplication of business rules; and (iv) misapplication of the EVAL analysis. Some of the errors are difficult to identify and correct. Prior to January 2002, a "quick fix" adopted by FHWA to the problem of key punching errors was to enter state reported data submitted on paper twice. The premise was that any errors made in the first round would be caught and corrected during the second entry. However, the chances that errors are made in the second entry still remain. The Smart Input Tool is intended to address the problems of errors associated with data entry. The Smart Input Tool was critically evaluated by comparing it with the legacy system and testing the self-error checking feature of the tool. Input errors were intentionally introduced to test how the tool reacts. The oversight review process addresses the goal areas of data process quality and risk management. The introduction of oversight at the state level is also part of FHWA's continuous improvement model to improve the quality of fuel tax data reported by the states and improve the efficiency of the fuel tax attribution process. This review assesses the impacts of the oversight on the quality of state data submissions, and how this data quality affects the efficiency of the entire fuel attribution process. FHWA did not identify data duplication and data completeness as major problems. Whenever incomplete data or errors are detected, FHWA works with the states to resolve it. However, the time and effort required to resolve discrepancies and reconcile state and FHWA data can be saved. The oversight review was implemented to ensure that complete and accurate data are submitted to FHWA. Anecdotal information based on the results of preliminary oversight reviews conducted in 27 states in the Fall of 2002 were used for the evaluation. The oversights have not been fully implemented at the time of the evaluation effort. This study identifies any institutional issues that impact the fuel attribution process. Limited interviews were conducted with FHWA staff to gain insights into possible institutional issues that directly or indirectly impact the fuel tax attribution process. The following sections discuss in detail each of these studies or analysis. This section presents the results of the evaluation effort. The results of the analyses described in the previous section are discussed. A description of the fuel tax attribution process review can be found in Chapter 2 of this report. Process review is one of the critical elements of the evaluation effort. One essential aspect of the process is that FHWA provides clear instructions to the states regarding data requirements. In this regard, the instructions on reporting fuel tax data as contained in Chapter 2 of "Guide to Reporting Highway Statistics" were thoroughly reviewed and reported to FHWA. One of the analytical processes of particular interest is the EVALUATION analysis ("EVAL"). As described in Chapter 2, the EVAL is a critical step in the fuel tax attribution process because it establishes the validity of the data from the states. This analysis verifies that current changes in state tax rates are considered by the states. The challenge in EVAL is to reconcile the amounts reported on Form 556 with the values derived from the gallons reported on Form 551M. As a business rule, reconciliation is considered complete when the difference is within 5 percent. This requires interacting with the state agencies responsible for submitting the fuel tax data to ensure that the values are reconciled. The implementation of state oversight reviews may help in ensuring that the values reported on the Form 551M agree with the amounts reported on Form 556. This will eliminate the need for adjustments made by FHWA so that the 5 percent difference threshold is achieved. This project did not specifically evaluate any of the estimation models used in the fuel attribution process in detail. For example, the gasohol model was reviewed to a limited extent. It was observed that, in its present form, the gasohol model uses proximity to the production plant as one of the input variables. The inclusion of this variable was based on the premise that gasohol cannot be shipped over long distances and therefore proximity to the plant is an important variable that determines consumption. There is one school of thought that believes that with changes in the emission standards and increased usage of gasohol, proximity to production variable is becoming less relevant to determining consumption. The potential risks of underestimating or overestimating gasohol consumption based on estimates derived from the gasohol model are acknowledged. However, these risks or effects of extrapolating to other states could not be assessed as part of this evaluation effort due to lack of data. The following are summaries of review comments on the other estimation models used in the fuel tax attribution process. The comments highlight the limitations or weaknesses of the estimation models in terms of irrelevant or outdated data used in the models as well as data elements not considered in the models. Non-Highway Model All modules of the non-highway model use information from VIUS. This survey is only conducted once every five years. Agriculture Module - This module has not been updated with the latest 1997 Census of Agriculture data. The current module uses information on gasoline expenses reported in the 1991 Farm Production Expenditure Report (information at this level of detail is not available after 1992). Data on non-highway equipment including, specialty agricultural equipment, power and light generators, and stationary power equipment are not included in the model. Aviation Module - Information used in the latest version of the spreadsheet program was based on 1996 data. This needs to be updated with more recent data. Data on gasoline use by ground support aviation equipment at airports are not included in the module. Construction Module - Fuel consumption data on non-vehicle gasoline engine equipment, such as mixers, loaders, cranes, power, and light generators are not captured in the module due to lack of data. Industrial/Commercial Module - This module does not include fuel consumption data for non-vehicle, gasoline engine equipment, such as scrubbers, sweepers, material handling equipment. Marine Module - It was observed that "Effective Median Household Income" reported in the proprietary periodical Sales and Marketing Management may not be as indicative of the growth rate as the Disposable Income per Capita published by the U.S. Bureau of Economic Analysis. The 1991 National Recreational Boating Survey provides a significant amount of data used in this module. Since 1991, the United States Coast Guard has not released an updated survey of this type. The information is outdated and needs to be updated. It was also noted that the module does not take fueling practices (fuel station vs. pier/dock) into consideration. Public Use Model GSA now reports fuel consumption by fuel type instead of by vehicle class. Therefore, fuel consumption data requires modification before it can be used in the estimation model. It was also noted that GSA report has a two-year time lag. Information on publicly owned vehicles in Table MV-7 (Highway Statistics) was calculated based on the numbers of Federal vehicle stocks provided by the GSA in the 1980's. Population land area data have not been updated with the latest Census information. The current SCM government practices are not reflected by data, since it was collected over a decade ago. Therefore, there is the need to update information on publicly owned vehicles. Much of school bus data are not available since most of these services have been contracted to the private sector. SCM calculation does not include alternative fuel use (1992 EPACT mandates the use of alternative fuel on public sector fleets and fuel providers' fleets). It is important to consider these data improvements in enhancing the estimation modules. Based on this review, it is recommended that the estimation models need to be reviewed, updated, and enhanced, where necessary. Two main analyses were performed. The first analysis investigated the relationship between the amount of motor fuel reported by each state (including non-highway use) and the attribution funds they received. The second compared the amount of gasoline (used for highway-use only and including gasohol) reported by each state and the attribution funds they received. These relationships were examined using simple linear regression analysis. The analysis is based on the premise that the amount of funds attributed to each state should be directly proportional to fuel consumption. It is assumed that effects of other variables on the amount attributed are negligible. The amount of motor fuel and the amount of gasoline reported by each state were obtained from Highway Statistics Table MF-21. The corresponding receipts of funds were obtained from Highway Statistics Table FE-9. Data for a five-year period between 1997 and 2001 inclusive were used. 3.4.2.1 Discussion of Results of Statistical Analysis The results of the statistical analysis of historical data are shown in Figures 3-1 and 3-2. These figures show the relationships between total gallons of fuel and gasoline and the respective attributions to the states. The coefficients of correlation of the linear regression lines for the five years are 0.99. These values imply that the amounts attributed to each state are highly correlated with the number of gallons reported. These results also suggest the following:
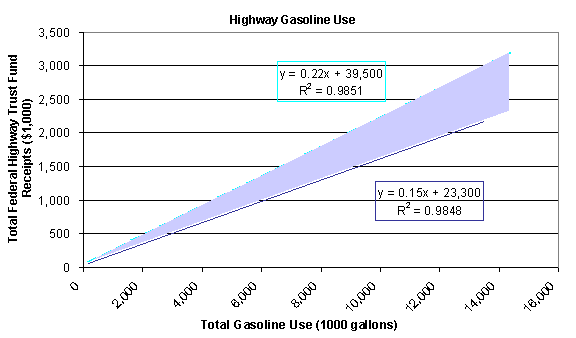
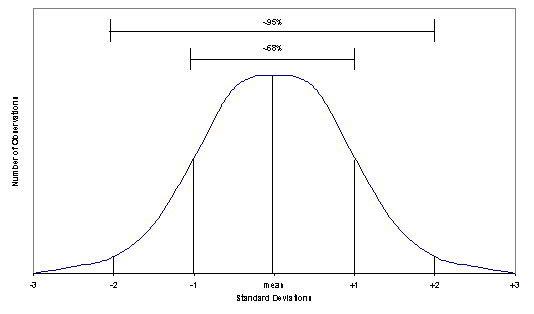
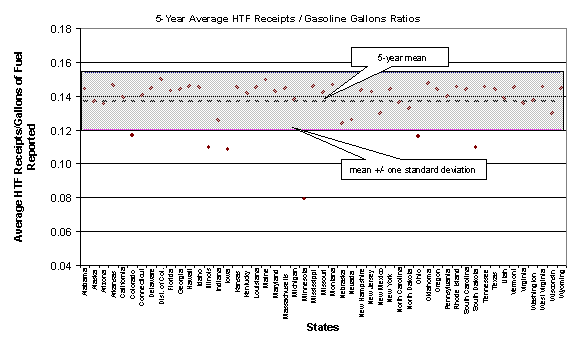
Furthermore, these results suggest that simple linear regression analysis can be used to assess the validity of the future HTF attributions. It is recognized that a single regression model will not be applicable to all years and therefore inadequate for assessing future attributions. However, given the consistently high correlation between the amount of fuel consumed and the amounts attributed, it is possible to set some boundaries to assess the consistency of future attributions. It is suggested that an envelope of regression lines and a minimum coefficient of correlation be used to judge the acceptability of future attributions. As such, it is suggested that a regression analysis should be carried out after each year's attribution and the coefficient of correlation compared with a threshold value of 0.99 and that the regression line should fall within the envelope shown in Figure 3-3. Any outliers should then be identified and reviewed to identify the possible cause(s) of inconsistency. Reliability and consistency of the attributions also can be investigated by examining the stability of the ratios of attributions to fuel consumption. The regression analysis revealed that the HTF attributions are highly correlated with the amounts of fuel consumed. This suggests that the ratio of HTF attributions to gallons consumed should be stable i.e., lying within a narrow range. Thus, reliability of the analytical process can be assessed using statistical measures such as the range of variation. The range of variation is defined as the mean plus or minus one or two standard deviations. According to standard statistical theory, using one standard deviation as the range of variation about the mean implies that approximately 68 percent of the values lie within this range. On the other hand, the mean plus or minus two standard deviations implies that 95 percent of the values lie within this range. This statistical measure assumes that the ratios are normally distributed. Figure 3-4 shows the relationship between the statistical ranges and the probabilities. Scatter plots of the HTF-to-fuel consumed ratios and the range of variation (mean plus or minus one standard deviations) superimposed revealed that the range changes from year to year. It is noted that the scatter plots also provide clear indications of possible outliers that merit further investigation. It is suggested that the range of variation be used to determine reliability and consistency of the attributions and identify outliers for further investigation. It is recommended that the mean plus or minus one standard deviation used be in constructing the threshold range of variation. Given the yearly variations, it is also recommended that a five-year moving average be used in establishing the range of variation. Figure 3-5 illustrates the band of variation for 1997 through 2001. Figure 3-1. Relationship Between Motor Fuel Use and Highway Trust Fund Receipts 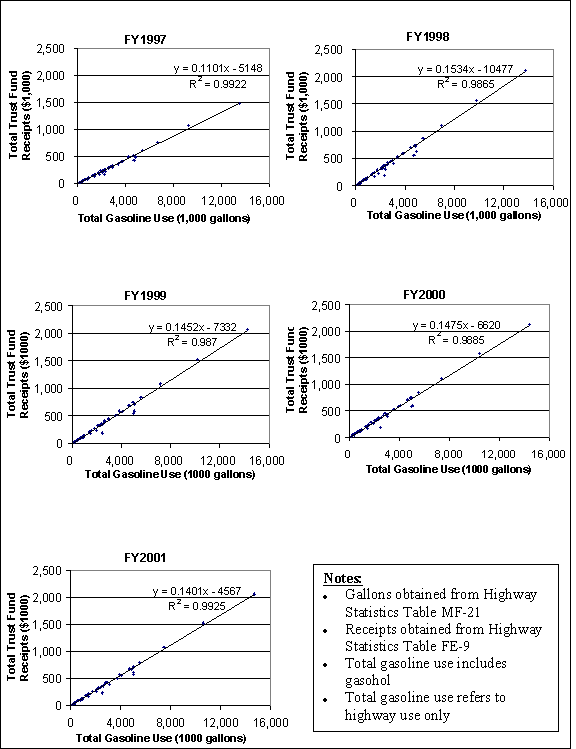
Figure 3-2. Relationship Between Highway Gasoline Use and Highway Trust Fund Receipts
Figure 3-3. Regression Analysis for HTF Attribution Acceptability
Figure 3-4. Relationship between Statistical Ranges and Probabilities
Figure 3-5. Statistical Range of Variation - 1997- 2001 As noted earlier, the primary purpose of the Smart Input Tool is to improve data quality and reduce the risk of erroneous and incomplete data reported by the states, as well as to improve efficiency of the fuel tax data processing. The tool is also intended to simplify and standardize the process in which states report fuel tax data to the FHWA. The Smart Input Tool was implemented in spring 2002 and was made available to all the state departments responsible for reporting fuel to the FHWA. It is based on an MS Windows format and is compatible with the MS Excel application. It allows for seamless data entry and submission of the 551M Form. This software application also allows multiple users to access the state's forms electronically. Fuel tax data can be entered in three different ways: (i) manually entered into each cell by viewing the form in a spreadsheet format, (ii) manually entered using the "wizard" view (in which the application takes the user through each entry), or (iii) automatically uploaded into the application by linking the form in the application to an existing Excel spreadsheet that already contains the state's fuel data. The Smart Input Tool was evaluated in three different ways: (1) by comparing the new Smart Input Tool to the legacy system of state data submittal, (2) within the Smart Input Tool, by comparing manual data entry into the tool to entering data through the use of a template, and (3) evaluating the error checking feature within the tool. These assessments are described below. 3.4.3.1 Discussion of Smart Input Tool Evaluation Smart Input Tool vs. Legacy System The content (i.e., actual fields) in the Smart Input Tool were compared to the paper 551M Form used by the legacy system (revised 3-00, provided in Chapter 2 of the FHWA's "A Guide to Reporting Highway Statistics," which gives instructions to the states on how to fill out Form 551M). Care was taken to note any discrepancies between the two methods especially any missing data fields. It also avoids the need to manually transfer data reported by the states to the FHWA system for analysis. This transfer might introduce data entry errors. This is avoided with the use of the Smart Input Tool. The use of the Smart Input Tool more efficient than the legacy paper form of data capture for the fuel tax attribution process in the following ways:
Manual Data Entry vs. Template Data Entry The Smart Input Tool allows two methods of entering the state data: manually entering the data and using a template. Manually entering the data involves simply keying in the necessary information for each field. This can be done in the spreadsheet format or by using the "wizard." The template method involves setting up a spreadsheet - the "template" - with links (cell references) between the 551M Form and the state's own database spreadsheets. Once this template has been set up properly, it allows the data to be directly transferred from the state's database files into the 551M Form, eliminating the need to enter the data twice (i.e., once into the state's files and then once into the Smart Input Tool 551M Form). This template maps the data from the spreadsheet onto the Smart Input Tool 551M Form. In order to evaluate the manual data entry process, sample data for Indiana , January 2000 was used. The manual data entry method used both the spreadsheet view and the wizard view of Form 551M in the Smart Input Tool application. For the template data entry process, a template was setup to reference data from an Excel file that was created solely for this test, containing sample data for Indiana , January 2000. The template option of data entry is the more effective method since it eliminates the need to enter the data twice. Though it may take some time initially to set up the cell references in the template file, it certainly saves time and effort. Overall, the process of creating the template file is fairly simple and straightforward. The program is user friendly. Moreover the feedback mechanism provided through the Community Exchange website enables users to see guidance whenever in doubt. Error Checking Perhaps the most beneficial feature of the application is its error-checking ability. A certain amount of simple and logical errors can be flagged by the software application before the form is electronically submitted to the FHWA. This saves time and effort by both the state and FHWA. This aspect was tested in both the manual method and template method of data entry into the Smart Input Tool by intentionally introducing errors. For example, illogical entries were intentionally introduced in the spreadsheet cells and incorrect links were set up in the template. Some fields (or links) were left blank, while other cell references were linked twice (i.e., multiple cells in the sample state spreadsheet were referred to the same Smart Input Tool 551M Form cell for their values). Errors such as these (that could commonly be made when manually entering data or creating cell references) were introduced in order to test how the program handles these mistakes. There were several error-checking features observed during the testing of the Smart Input Tool. It should be noted that, depending on the method of data entry used (direct manual or use of a template), different types of errors are caught by the tool. For example, it was noted that when manually entering data into the Form 551M file, data could not be entered into those cells that calculate sums and differences. This reduces the risk of human error in these calculations. When using the template method of data entry, there are two steps that must be completed, (1) initially setting up the template file and (2) actually importing the data. Some of the automatic error-checking features associated with each of these steps are detailed below. When creating references ("links") in the template file, the following error-checking features help to improve data quality:
When importing data from an Excel file into the Smart Input Tool Form 551 using a previously created template, the following program features reduce error:
Additionally, the program checks for errors after the data has been entered (either manually or imported using a template) into the Smart Input Tool Form 551. These are presented in a validations report, which can be viewed and printed, showing all of the cells that should be either modified or verified before submitting the file to the FHWA. Brief descriptions of what is incorrect about each cell follow the listing of each "problem" cell. This validation offers the opportunity to verify and confirm input data before submission. 3.4.3.2 Conclusions - Smart Input Tool As noted earlier, the template method of data entry offered by the Smart Input Tool saves time and cost compared to the direct manual data entry. The error-checking feature also improves efficiency and reduces costs. Non-labor cost savings associated with the use of the tool stems from the fact that the data are submitted via the Internet, eliminating communication charges (e.g., postal and fax). In terms of improvement in efficiency, the turnaround time for the data is improved with the implementation of the Smart Input Tool. The self-error checking feature of the Smart Input Tool (i) reduces data entry errors, (ii) improves efficiency by eliminating double data entry; (iii) reduces the risk of incomplete and inaccurate input data; and (iv) reduces the time and effort required by both FHWA and the states to reconcile data. The Smart Input Tool is a definite improvement over the legacy paper system of fuel tax data submittal. It is a major step toward the goal of improvements and standardization within the fuel attribution data reporting process, even though exceptions still will have to be made for states with varying and unusual circumstances, such as unique reporting time periods. The Smart Input Tool's dependence on technology and the Internet also should be noted when considering the vulnerability of the system. Security measures and backup systems should be valued as necessary supplements to this new system (more so than was necessary in the old paper system). Finally, effective communication (or feedback) between the state agencies and the FHWA in an effort to continually improve upon this new system is essential in making (and keeping) this system a success. The Smart Input Tool community website ("Highway Community Exchange") is a step in the right direction. 3.4.3.3 Recommendations for Improvement - Smart Input Tool While the input tool improves the efficiency of the data input process in comparison to the legacy system, the following are some improvements that would further enhance the efficiency of the tool:
The primary objective of setting up oversights is to ensure that data reported by the states have been checked, verified, and certified prior to submission to FHWA. This reduces the time and effort required to reconcile the data where necessary and ensures that the data are of acceptable quality (accurate, complete, and timely). In evaluating the impact of the oversights, inferences were drawn from results of preliminary oversight reviews in 27 states. The oversights have not been fully implemented and functional in all states at the time of the evaluation. Therefore, the inferences presented below are indications based on limited information. It is likely that the real impacts might be different when the oversights are fully implemented in the future. A primary role of the oversight is to ensure data are accurate and complete. In particular, changes in the state tax legislations must be taken into account and properly reported. Also, submitting completed data avoids the use of models to estimate missing data. The oversight is also intended to help reduce the time and effort required to reconcile data requirements from FHWA with what the states are able to provide. In setting up the oversight review program, the states were initially given a limited amount of guidance on how to conduct the reviews. The guidelines were intentionally kept limited in order to get a better understanding of how each state would approach the task and also to facilitate more participation of the states in the actual review process. In other words, the states were involved in establishing how the reviews should be carried out. The guidelines were intended to help individual states develop and carry out detailed reviews of their own processes and participate in beneficial exchanges of ideas between the Division Office representatives and other involved state departments. 3.4.4.1 Observations from Preliminary Reviews FHWA conducted a two-day workshop in December 2002 to evaluate the results of the preliminary oversight reviews, which were performed by seven Division Office representatives. In all, 27 state reviews were submitted to the FHWA in FY 2002. At the workshop, the reviews were compared and general suggestions on ways to improve the review process were discussed. These suggested improvements were used to develop a plan for improving the review process in the future. It was found that every state that participated in the oversight review effort conducted their review differently. Some states just used the draft guidelines provided by the FHWA. Others went further and documented their data gathering process. Some states took the initiative to contact their state revenue departments in an effort to verify and confirm fuel revenue data as part of the data review effort. A few other states teamed so that they could assist each other in the review process. Thus, the level of detail and involvement as well as the methods of carrying out the reviews varied widely among the states. 3.4.4.2 Recommendations for Improvement - Oversight Reviews The workshop participants generated recommendations for improving the review process. These recommendations are grouped into two categories. The first category relates to suggestions on how to improve the reviews performed at the state level. The second category relates to ways of improving the review of state-submitted data at the Federal level. State-Level Reviews
Federal-Level Reviews
It was concluded that the oversight review offer promise in addressing fuel tax data quality issues in the future. The following are major findings of the evaluation presented by goal area. 3.5.1 System Performance / Efficiency
No major institutional issues have been identified that could significantly impact the fuel tax attribution process. It was noted that the FHWA is implementing a number of changes, some of which are institutional in nature, to help improve the fuel tax attribution process. The possible institutional issues would be the role and relationships of the oversight reviewers and state fuel tax reporting agencies and the FHWA. Some institutional arrangements may be necessary to facilitate the operations of the oversight reviews. Also, with the introduction of the Smart Input Tool and the oversight, interaction between the state reporting agency and FHWA will be modified. These institutional changes are expected to promote efficiency in the fuel tax attribution process rather than impede the process. Although not directly evaluated (due to lack of data) oversight reviews are expected to enhance interagency interaction at the state level so that data discrepancies and inconsistencies can be quickly resolved. It is anticipated that when oversights are fully implemented, communication among state agencies will improve and data acquisition and reconciliation will be expedited. 3.6 Action Items for Improving Fuel Tax Attribution Process The FHWA has initiated a series of actions as part of the continuous improvement model to address shortcomings of the fuel tax attribution process as well as actions directed specifically at improving and enhancing the process. The objectives of this project include identifying ways that would help FHWA to further improve the efficiency of the fuel tax attribution process. This section outlines potential actions that would further improve data quality and the attribution process. It is acknowledged that the quality of fuel tax data reported by the states is a major controlling factor of the efficiency and efficacy of the fuel tax attribution process. In the past, FHWA was responsible for cleaning up state reported fuel tax data and ensuring that the data used in the attribution process is of acceptable quality. Given that the state DOTs are the data providers, it seems logical that the state DOTs should take responsibility for the quality of fuel tax data submitted to the FHWA. Moreover, since the volume of fuel usage reported determines the HTF attributed, it is in the states' best interest to ensure that the quality of data submitted meets the acceptable standards. The current instructions for reporting fuel tax data stresses the need for providing accurate and timely information. However, the instructions do not include information on the risks associated with or the consequences and impacts of low quality fuel tax data on HTF attributions. Furthermore, the instructions do not suggest methods that states can use to assess the quality of the data they submit. The term data quality is generally defined as the fitness of data for all purposes that require it. Data quality can be measured by several variables as defined below (Turner, 2003).
All these quality measures are applicable to fuel tax data. Improving the efficiency and efficacy of the fuel tax attribution process can be approached from two angles. First, identify and implement measures to ensure that high quality fuel tax data are reported by the states. This is addressed in Sections 3.6.2, 3.6.3, 3.6.4, and 3.6.5 below. Second, review and enhance the analytical procedures used in the fuel tax attribution process. This is addressed in Sections 3.6.5, 3.6.7, and 3.6.8 below. These two sets of actions are interrelated. With this background, the following sections describe potential actions that can be implemented to improve the quality of state reported fuel tax data and the efficiency of the attribution process. 3.6.2 Structured Instructions Manual Currently, the instructions to states on reporting fuel tax data are presented in Chapter 2 of "Guide to Reporting Highway Statistics." This document contains other fuel tax related information. A review of the instructions reveals that the instructions are, in general, clear, but less explicit in a few instances. Given the importance of these instructions in gathering high quality fuel tax data and also noting the differences in state tax structures and specific circumstances, the following measures are proposed: The instructions should be developed as a stand-alone Instructions Manual. The instructions and steps in the manual should be explicit and void of ambiguities. The instruction manual should be divided into four main sections as follows.
It is believed that an instructional manual in a structured format as outlined above should address the shortcomings of the current Chapter 2 of "Guide to Reporting Highway Statistics" and consequently improve the quality of fuel tax data reporting. 3.6.3 Data Assessment at State Level It is proposed that, by having the states perform data quality checks on their own data prior to submittal, would expedite the data analysis process by FHWA. The first step in implementing this proposal is to develop an assessment tool that the states can use to compare the state's current year's data with the average of the previous five years for that state. It is envisaged that such an assessment tool should be a statistical model similar to that described in Section 3.4.2 of this report. With this tool, states will be responsible for evaluating their own data, addressing any unexpected results, and either correcting any mistakes that have caused these unexpected results or determining a cause for the change in the data from previous years. Guidelines for using the assessment tool should be included in Section 4 of the Instructions Manual outlined above. In addition, the results of the assessment should be submitted with the data to FHWA as proof that states perform these assessments. 3.6.4 Information Exchange Website/Clearinghouse It is proposed that the FHWA use the existing Highway Community Exchange or similar website to provide guidance, address questions, and post "good examples" of accurate and complete fuel tax data submittals from states. This would serve as a "help" site for states having difficulty using the Smart Input Tool and other tools and resources for data assessment and reporting. Such a website should also serve as a forum for expressing suggestions to improve the data reporting and fuel tax attribution process. Furthermore, it is important that states are made aware of the value of good quality fuel tax data. Therefore, knowledge of the potential effects of poor quality data on HTF attributions could be a motivating factor for the states to report the highest quality data to FHWA. It is recognized that FHWA currently performs sensitivity analyses a means of quality control. It is recommended that FHWA continues to conduct these periodic sensitive analyses and to publish the results on the Information Exchange website. The published results should be anonymous (i.e., states whose data are used in the analyses should not be identified). The primary purpose of publishing the results is to serve as examples to illustrate the effects of poor quality data and to assist states that have consistent data quality problems. This website would also provide the channel for feedback from the states that should guide continuous improvement of the Smart Input Tool, oversight program, and other tools designed to improve the fuel tax attribution process. States that consistently provide good quality data could serve as mentors to other states that have difficulty submitting good quality data. Differences in state tax structures and other legislative requirements are recognized. Nonetheless, it is believed that sharing experiences through a mentoring program should help address some of the major issues associated with fuel tax data quality. The mentoring program complements the Information Exchange website by offering a more direct and interactive assistance to states needing help. FHWA should, through use of the oversight program, establish and monitor the mentoring program. 3.6.6 Updates and Enhancements to Estimation Models The estimation models are critical to the attribution process. Preliminary review of the models indicated that the input variables for some of the models and modules are dated and/or their underlying assumptions are no longer valid. For example, Table 3-3 shows some estimation modules and remarks regarding the currency of data used in developing them as well as their limitations. Table 3-3. Summary of Limitations of Some Estimation Models Evaluation Approaches Addressing Goal Areas
It is important to conduct in depth reviews of these models to determine areas requiring updates and enhancements. Improving the models should in turn improve the reliability of the estimations and outputs from the attribution process. In addition, FHWA should periodically evaluate the models as part of the continuous improvement model. This periodic evaluation allows for specific weaknesses in the models (and modules) to be quickly identified and corrected. 3.6.7 Enhancement of Analytical Framework Good quality data has little value if the analytical procedures have shortcomings. Elements of the analytical procedures of particular interest include:
It is important to review and enhance these procedures where necessary because improved data quality from the states and updated estimation models may impact certain steps in these procedures. Some steps, assumptions, and business rules were necessary to compensate for poor quality data. As data quality improves, some of the analytical steps, assumptions, and business rules may become redundant or obsolete. These rules and assumptions should be revisited to determine their need, validity, and utility in the fuel tax attribution process. For example, as a rule in the EVAL analysis, the process is considered complete if the estimated gallon receipts are within a plus or minus five percent of the reported receipts. The five percent threshold value may be revised as quality of data reported by the states improves. Similarly in the Use/User Analysis, a business rule is used in deciding what value to use if the state reported value differs from FHWA's estimates. Business rules such as this may not be necessary once the quality of state reported data improves to a level that there is increased confidence its use. FHWA currently employs a continuous improvement model directed at improving the quality of its products and services. In order to evaluate the impacts of changes implemented as part of the continuous improvement model, it is important that FHWA monitors the effectiveness of changes through periodic or continuous reviews of the changes implemented. This monitoring effort will involve data collection and analysis. Some of the data would include the frequency of errors in reported fuel tax data, the number of states using the Smart Input Tool, the number of states reporting poor quality data, and the convergence of state reported data and estimated data from models. To facilitate the evaluation process and ensure that improvements actions are systematically implemented and monitored, it is important FHWA sets up a system or framework for the data collection and analysis required for the reviews. Such a framework would also serve as a reference guide that allows FHWA to monitor its continuous improvement efforts and also ensure that improvements are consistently implemented. Results of these reviews would be useful in revising guidelines and rules as well as implementing new changes. It is also suggested that FHWA shares the results of the evaluation with the states on a periodic basis. |
||||||||||||||||||||||||||||||||||||||||||||||||||||