July 2019 Monthly Motor Fuel Reported by States
National Gasoline Sales
January - July
2018 vs. 2019
CHANGE FOR U.S. 0.6%
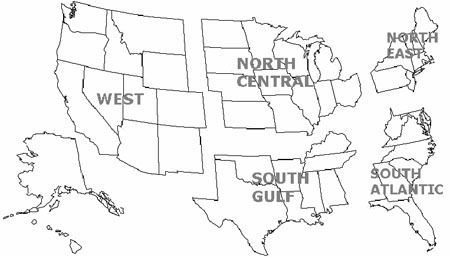
0.1%
3%
1.8%
-2.4%
0.8%
| REGION |
Percent Change |
| Total |
0.6 |
| North-East |
0.8 |
| North-Central |
-2.4 |
| South-Atlantic |
3 |
| South-Gulf |
1.8 |
| Western |
0.1 |
Based on reported and estimated 2019 data.

