U.S. Department of Transportation
Federal Highway Administration
1200 New Jersey Avenue, SE
Washington, DC 20590
202-366-4000
January - June
2019 vs. 2020
CHANGE FOR U.S. -15.2%
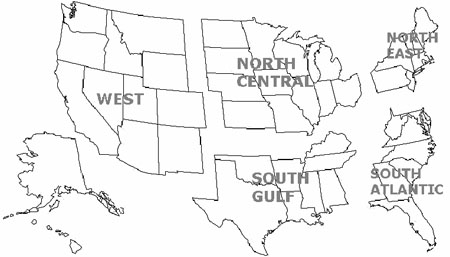
-16.5%
-14.8%
-11.6%
-13.7%
-21.3%
| REGION | Percent Change |
|---|---|
| Total | -15.2 |
| North-East | -21.3 |
| North-Central | -13.7 |
| South-Atlantic | -14.8 |
| South-Gulf | -11.6 |
| Western | -16.5 |
Based on reported and estimated 2020 data.

