U.S. Department of Transportation
Federal Highway Administration
1200 New Jersey Avenue, SE
Washington, DC 20590
202-366-4000
Highways are the transportation backbone of our nation, providing a conduit along which people and goods move from coast to coast. Our nation's highways keep the country moving, sustaining nearly 3 trillion (3,000,000,000,000) vehicle miles traveled (VMT) in 2009.
Figure 2-1: Passenger Travel Modes by Number of Trips
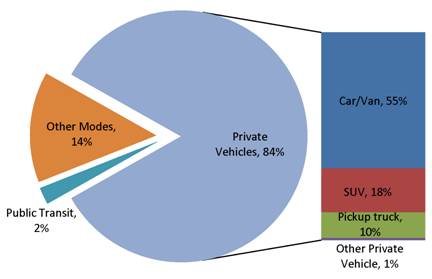
Data Source: FHWA OHPI, National Household Travel Survey (2009)
Private vehicles, which include automobiles, light trucks, vans, and motorcycles, are used for 84 percent of all trips nationwide. Most of these trips – 55 percent of total trips – are made by car or van.
Figure 2-2: Freight Mode Share by Weight and Value: 2009
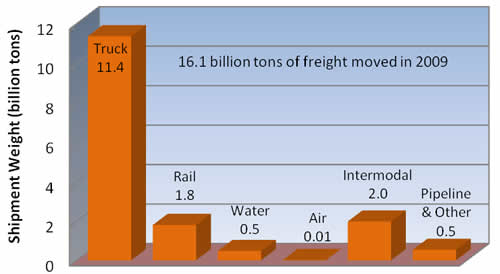
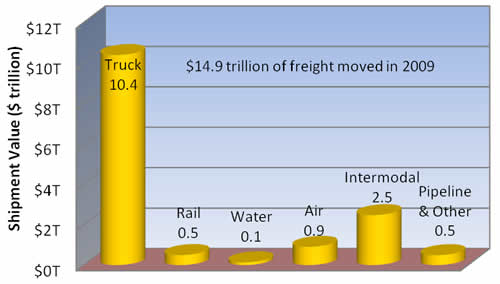
Data Source: FHWA, Office of Freight Management and Operations, Freight Facts and Figures 2010
In 2009, 16.1 billion tons of freight – with a total value of $14.9 trillion (in 2009 dollars) – moved along our transportation system. Trucks lead in both tonnage and in dollar value, carrying over70 percent of all freight (in both dollar value and tonnage).
Figure 2-3: Annual Vehicle Miles Traveled on Rural and Urban Public Roads: 1980-2009
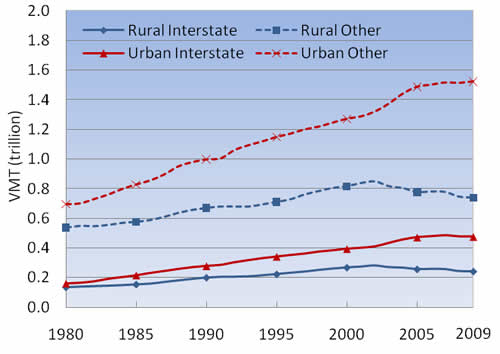
Data Source: FHWA OHPI, Highway Statistics
Vehicle miles traveled (VMT) is a measure of total vehicle activity for a given time period (usually daily or yearly). It is calculated by multiplying the number of vehicles (traffic volume) on a given roadway segment during a time period by its length. For example, on a 5-mile highway segment traveled by 5,000 vehicles each day the daily VMT is 25,000. The annual VMT on the same segment is 9,125,000 (25,000 x 365 days).
Three trillion VMT were traveled on all public roads in 2009, is essentially the same as in 2008. Of this 717 billion VMT (24 percent) are on Interstates and two-thirds of all VMT are on urban roads.
Figure 2-4: Average Daily VMT in Billions on Public Roads: 2008-2010
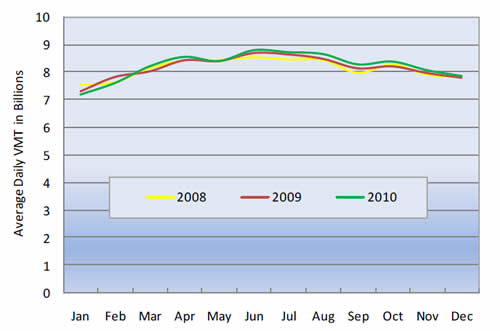
Data Source: FHWA OHPI, Highway Statistics
Annual VMT peaked in 2007 with a total of over 3 trillion vehicle miles traveled. Since then travel dropped below 3 trillion peak miles. Based on FHWA Traffic Monitoring Analysis System (TMAS) preliminary data after the 2008 decline from a 2007 peak the trend has been rebounding. Figure 2-4 illustrates how the trend in average daily VMT has changed by month in each of the last three years.
| << Prev | Contents | Next >> |

