U.S. Department of Transportation
Federal Highway Administration
1200 New Jersey Avenue, SE
Washington, DC 20590
202-366-4000
Vehicle ownership is a significant indicator of our nation's prosperity in the 20th century, tracking closely with economic development and change. Passenger vehicles–automobiles, light trucks, vans, sports utility vehicles, and motorcycles–are used for more than 8 of every 10 trips.
Figure 3-1: Registered Vehicles: 1970-2009
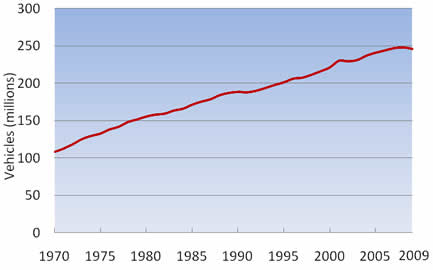
Data Source: FHWA OHPI, Highway Statistics
In 2009 there are 1.9 million fewer registered vehicles than in 2008 (a decrease of 0.8 percent). However, since 1970 total vehicle registrations have more than doubled, an additional 137 million registered vehicles. From 1970 to 2009 all vehicle registrations increased at an annual rate of 2.1 percent.
In 2009 there are 1.9 million fewer registered vehicles than in 2008 (a decrease of 0.8 percent). However, since 1970 total vehicle registrations have more than doubled, an additional 137 million registered vehicles. From 1970 to 2009 all vehicle registrations increased at an annual rate of 2.1 percent.
In 1970 there were 4.8 registered cars for each registered truck. In 2009 this ratio is 1.2 registered cars for each registered truck. This decreasing share of registered cars corresponds with an increase in minivans and, more recently, SUVs. Since 1985, shortly after minivans became widely available in the United States, an increasing number of truck registrations are apparent. Since 1985 truck registrations have increased at an annual rate of 4.0 percent, though this growth has diminished in recent years.
Figure 3-2: "Cash for Clunkers" Vehicles by Model Year
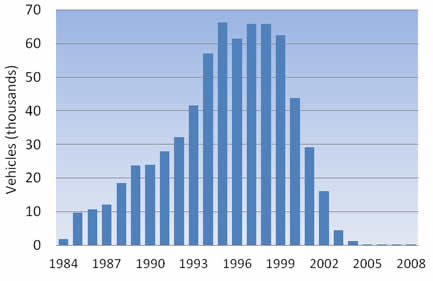
Data Source: National Highway Traffic Safety Administration (NHTSA)
The 2009 Consumer Assistance to Recycle and Save Act authorized the Car Allowance Rebate System (CARS), popularly known as "Cash for Clunkers." It provided funds to enable the purchase of a more fuel-efficient vehicle. A total of 677,842 vehicles were approved for the program. Eighty-five percent of trade-in vehicles are SUVs, pickup trucks, and vans, while 15 percent of trade-in vehicles are cars. Figure 3-2 shows the distribution of vehicles approved for the program by model year. Fifty-seven of trade-in vehicles are model year 1996 or older.
Figure 3-3: Private and Commercial Vehicles Per Capita by State: 2009
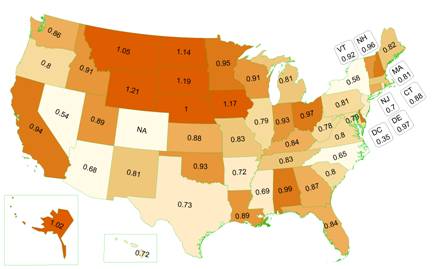
Data Source: FHWA OHPI, Highway Statistics. Note: Insufficient data available for Colorado.
The number of registered privately and commercially owned motor vehicles (which includes cars, commercial and non-commercial trucks, SUVs, and motorcycles) per person in each state vary significantly. States' rates of vehicle ownership range from 0.54 vehicles per person in Nevada to 1.21 vehicles per person in Wyoming.
South Dakota, Iowa, North Dakota, Montana, Alaska, and Nebraska also have relatively high rates of vehicle ownership, with at least than one vehicle registered for each resident. Along with Nevada's relatively low vehicle ownership rate are New York, North Carolina, and the District of Columbia, with each having less than one vehicle for every three residents.
Figure 3-4: Age of Household Vehicles
Data Source: FHWA OHPI, National Household Travel Survey (2009)
The 2009 National Household Travel Survey (NHTS) asked respondents about the make, model, and year of each vehicle in their households. The responses indicate that 6 percent of all household vehicles are one model year old or newer (2008 or newer at the time of the survey). Thirty percent of household vehicles are between two and five model years old, while 34 percent are between six and ten model years old. Vehicles between 11 and 20 model years old compose 29 percent of all household vehicles, while vehicles greater than 20 model years old are 7 percent of all household vehicles.
The 2009 NHTS also asked respondents whether any household vehicle is a hybrid or alternative fuel vehicle (which includes vehicles powered by ethanol, biodiesel, natural gas, propane, and hydrogen). The responses indicate the 5 percent of household vehicles are either hybrid or powered by an alternative fuel.
| << Prev | Contents | Next >> |

