U.S. Department of Transportation
Federal Highway Administration
1200 New Jersey Avenue, SE
Washington, DC 20590
202-366-4000
CV data provide insights into vehicle acceleration and deceleration events, pinpointing specific geolocations with timestamps. While a single individual event may not highlight potential infrastructure or operational issues, clusters of such events with high frequency of occurrence in specific roadway areas could signal the potential of infrastructure inadequacies such as, curvature, grade, sight distance, and pavement conditions. In addition, operating challenges, such as congestion and varying speeds among vehicles, may also be potential issues.
The OEM post-CV data explored have brake and acceleration event data only for these events exceeding a threshold value associated with longitudinal maneuvers. While the OEM’s specification of a hard brake is not available, AASHTO’s A Policy on Geometric Design of Highways and Streets specifies a maximum of deceleration of 3.4 m/s2 for sight distance computation.
Several approaches were used to analyze the OEM post-CV brake maneuver data. The first one plotted out all individual events on a roadway GIS map. This enables direct observation of such events visually. While this approach offers visual cues on geolocations related to where such events are, it lacks a quantitative measure (e.g., number of events per unit area or unit roadway length) for systematic comparison and ranking. The second approach developed to overcome the issue was through density computation for each predefined zone. In this case, a 2 kilometer (km) by 2 km square (4 km2) zone is defined and used for Florida. The entire state was divided into many thousands of such square zones. Events that occurred in each zone were counted and the density of such events was visually displayed. Obviously, the size of the zone can be structured in any size analyst’s desire. The zone establishment facilitates event frequency computation and identification of high frequency locations. The third approach was computing event density per roadway length. To enable comparison on a common base, a fourth approach can further be developed to divide the third approach result by their corresponding AADT values. In other words, the measure is the result of the number of events per AADT for a unit length of roadway segments. This normalization process has enabled direct comparisons across different roadways.
Figures 2 and 3 illustrate the zonal hard acceleration and hard brake event densities, respectively. The bigger the dot, the higher the number of events that occurred in the 4 km2 zone during the hour. Visual maps like these help analysts expedite the geolocating of high frequency locations. In addition, geolocation density data can be further analyzed by hour of the day together with average speeds. Figure 4 illustrates the hard brake event counts and average speed distribution of the highest frequency area over hours of the day.
Figure 2: Illustrating hard acceleration densities in 4 square km by hour of the day and average speed
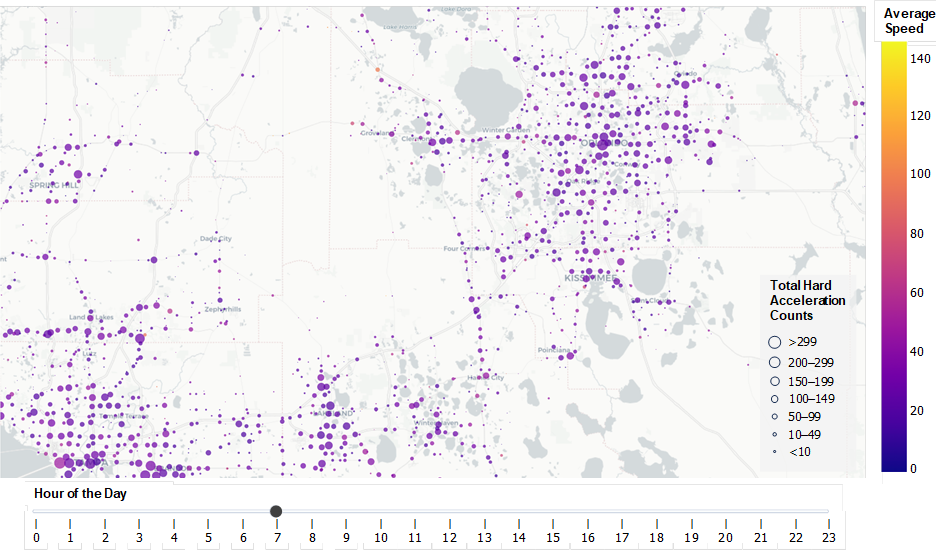
Source: FHWA Office of Highway Policy Information.
Figure 3: Hard brake densities per 4 square km by hour of the day and average speed
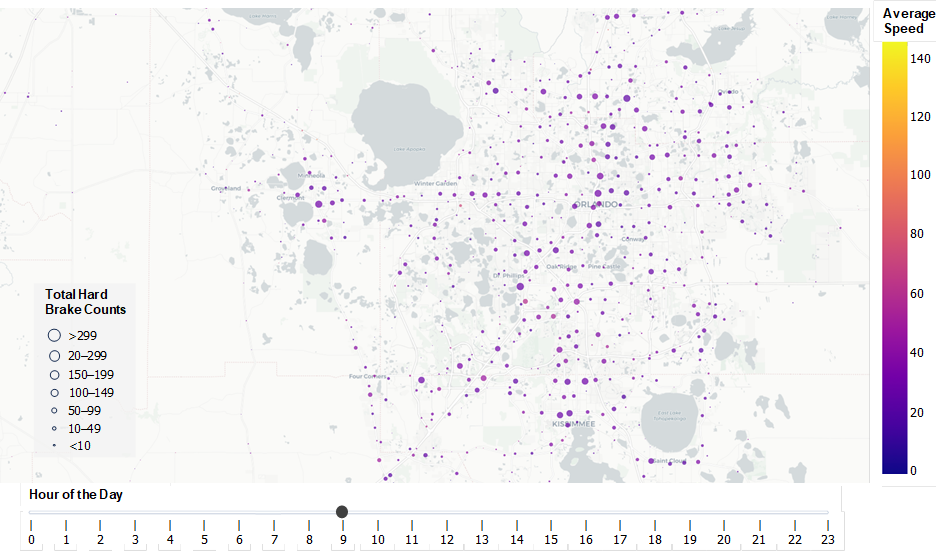
Source: FHWA Office of Highway Policy Information.
Figure 4: Hard brake counts and average speed in the highest frequency area (4 km²) by hour of the day
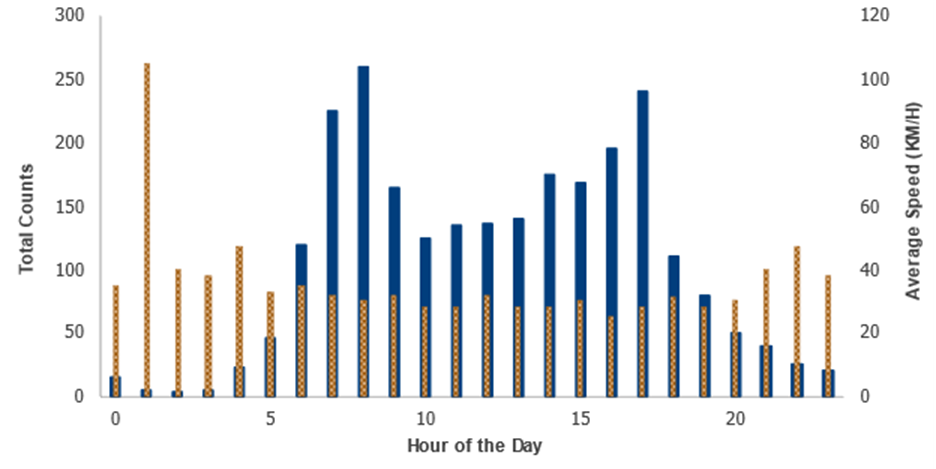
Source: FHWA Office of Highway Policy Information.
CV data events can be durational and transitional. For example, seatbelts latched/unlatched, wipers on/off, headlight on/off are durational as they typically sustain a long period of time. Acceleration and brake are transitional as they would sustain for only a short period of time. Acceleration and brake analysis can be integrated with seatbelt, wiper, and headlight status, yielding additional information. Figures 5 and 6 shows hard brake and acceleration counts and maximum speed for each event combination.
Figure 5: Counts of HA and HB events by wiper and seatbelt states
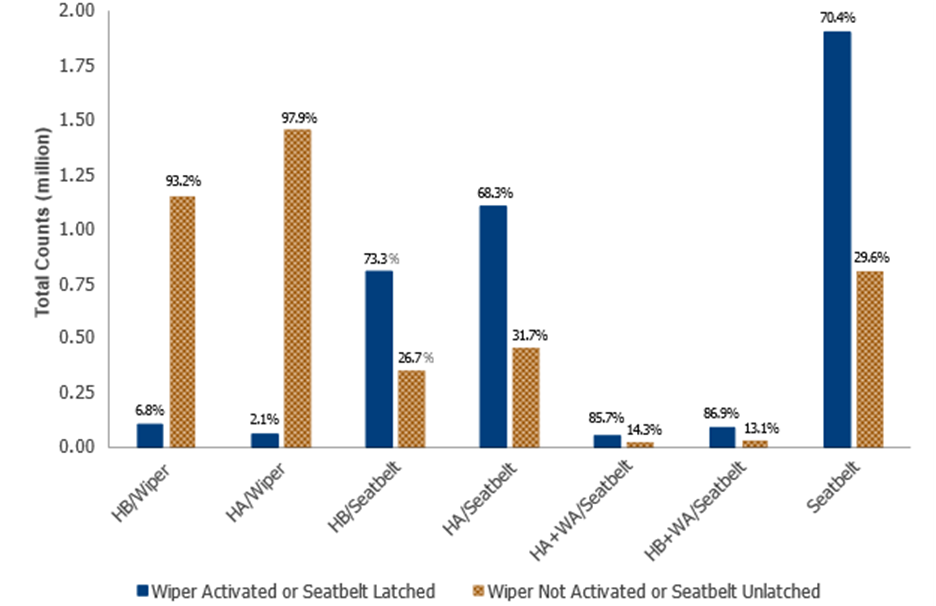
Source: FHWA Office of Highway Policy Information.
Figure 6: Maximum speed of HA and HB events by wiper and seatbelt states
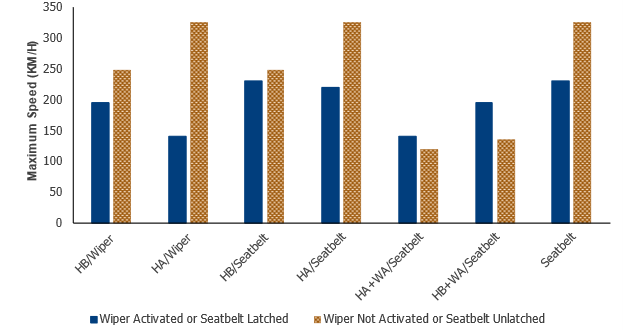
Source: FHWA Office of Highway Policy Information.
Unlike the OEM CV acceleration or deceleration event data, the JPO Pilot post-CV data contains all acceleration and deceleration maneuvering data covering 3 axes (longitudinal, lateral, and vertical) plus yaw rate. This analysis focuses only on longitudinal and lateral (turning) movements. The lateral acceleration data offer additional information related to vehicle rollover tied with roadway superelevation, curvature, and pavement condition. With the JPO Pilot post-CV data exploration, hard acceleration for longitudinal maneuvers is defined as acceleration equal to or exceeding 3.4 m/s2. Excessive lateral acceleration is defined as 2.4 m/s2 (0.25g).
Figure 7 shows different maneuvers based on longitudinal acceleration states. And Figure 8 shows different maneuvers based on lateral acceleration states.
Figure 7: Longitudinal acceleration points with different maneuver categories
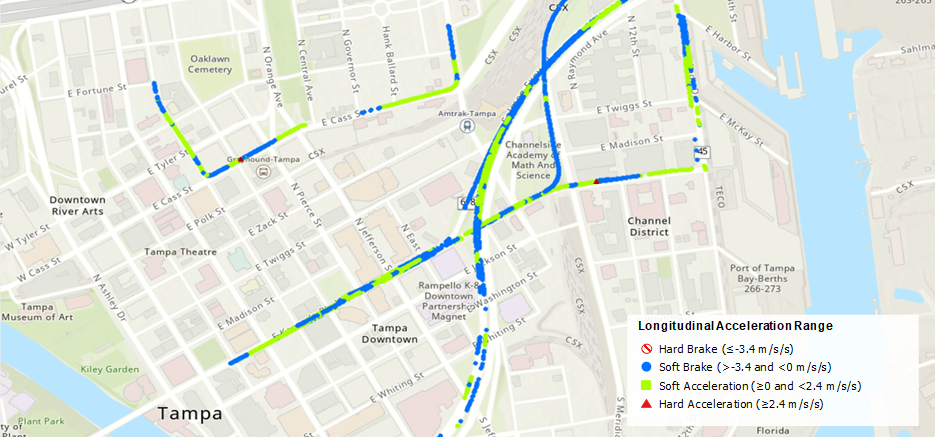
Source: FHWA Office of Highway Policy Information.
Figure 8: Lateral acceleration points with different maneuver categories
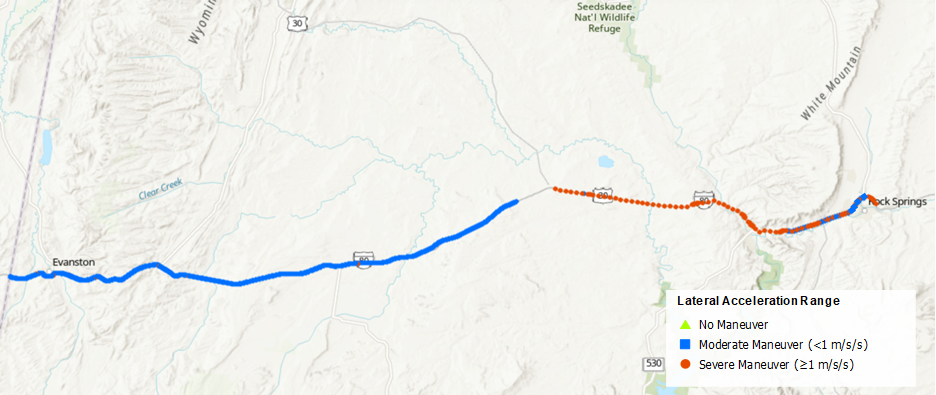
Source: FHWA Office of Highway Policy Information.
Seatbelts save lives. While seatbelt usage data lays the foundation for safety work, seatbelt data gathering has always been challenging as the predominant survey method lacks microlevel information. For example, few drivers could tell when they are buckled, unbuckled, or re-buckled during a trip, and percentages of travel time and travel distance that they buckled or unbuckled.
CV event data covers seatbelt usage, enabling the analysis of seatbelt latching status by time of the day, day of the week, and month of the year. In addition, CV data offer information on seatbelt usage status based on vehicle miles traveled (VMT) and vehicle hours traveled (VHT), vehicle speed, and journey progress (e.g., the start of a trip, the end of a trip).
Seatbelt status includes latched and unlatched while a vehicle’s engine is on for drivers and front passengers. A simple count of latched and unlatched events can produce a summary of basic parameters, such as percentages of latched and unlatched in terms of the number of such activities. Frequency alone information on seatbelt latched or unlatched status is not sufficient to measure seatbelt usages. For example, a single latch/unlatch action does not necessarily indicate that the seatbelt is used less than multiple latch/unlatch actions. To provide a fuller picture, seatbelt latched/unlatched event data was transformed into seatbelt latched/unlatched state information with associated trips. This transformation enables the analysis of seatbelt usage by VMT, VHT, speed, and vehicle journey progress.
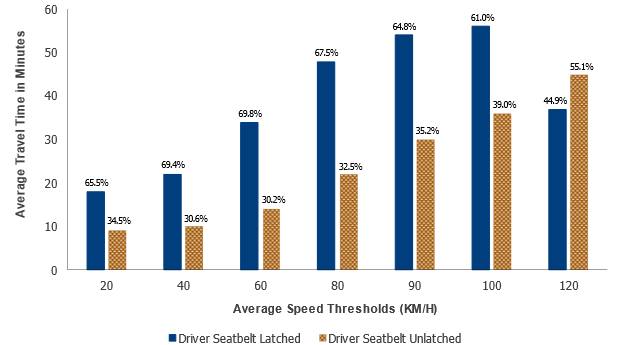
Figures 9 and 10 show the driver and front passenger seatbelt latched/unlatched durations by average travel speed, respectively.
Figure 9: Driver seatbelt usage by average speed thresholds
Source: FHWA Office of Highway Policy Information.
Figure 10: Passenger seatbelt usage by average speed thresholds
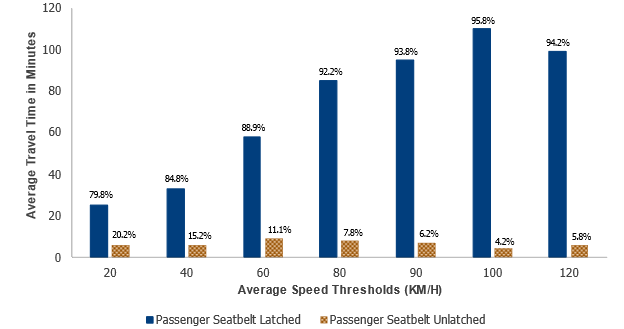
Source: FHWA Office of Highway Policy Information.
Note: Unoccupied passenger journeys excluded.
Similarly, Figures 11 and 12 show the driver and front passenger seatbelt durations by average travel distances, respectively.
Figure 11: Driver seatbelt usage by travel distances
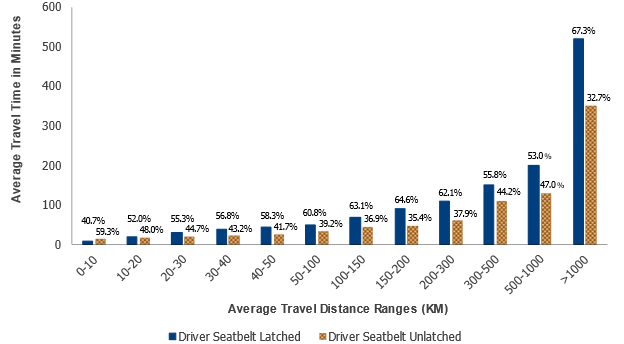
Source: FHWA Office of Highway Policy Information.
Figure 12: Passenger seatbelt usage by travel distances
Note: Unoccupied passenger journeys excluded.
Source: FHWA Office of Highway Policy Information.
Tables 1 and 2 show the percentages of seatbelt usages by average travel speed thresholds and travel distances, respectively.
| Seatbelt | Average Travel Speed Thresholds (KM/H) | ||||||
|---|---|---|---|---|---|---|---|
| 20 | 40 | 60 | 80 | 90 | 100 | 120 | |
| Driver | 65.5 | 69.4 | 69.8 | 67.5 | 64.8 | 61 | 44.9 |
| Passenger | 79.8 | 84.8 | 88.9 | 92.2 | 93.8 | 95.8 | 94.2 |
| Seatbelt | Travel Distances (KM) | |||||||||||
|---|---|---|---|---|---|---|---|---|---|---|---|---|
| 0-10 | 10-20 | 20-30 | 30-40 | 40-50 | 50-100 | 100-150 | 150-200 | 200-300 | 300-500 | 500-1000 | >1000 | |
| Driver | 40.7 | 52 | 55.3 | 56.8 | 58.3 | 60.8 | 63.1 | 64.6 | 62.1 | 55.8 | 53 | 67.3 |
| Passenger | 78.7 | 75.8 | 73.6 | 72.5 | 73.3 | 73.2 | 77.7 | 83.7 | 87.7 | 89.3 | 96 | NA |
Seatbelt data associated with the JPO Pilot CV data is not available.
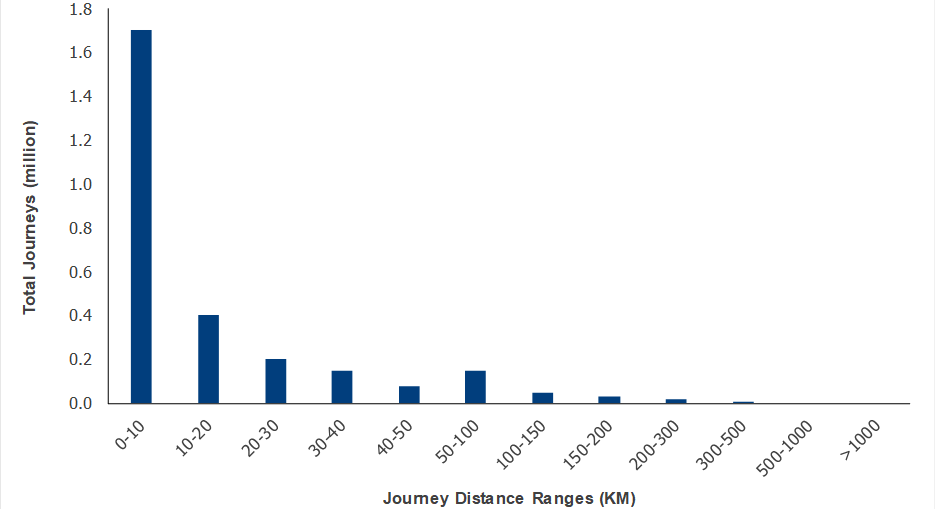
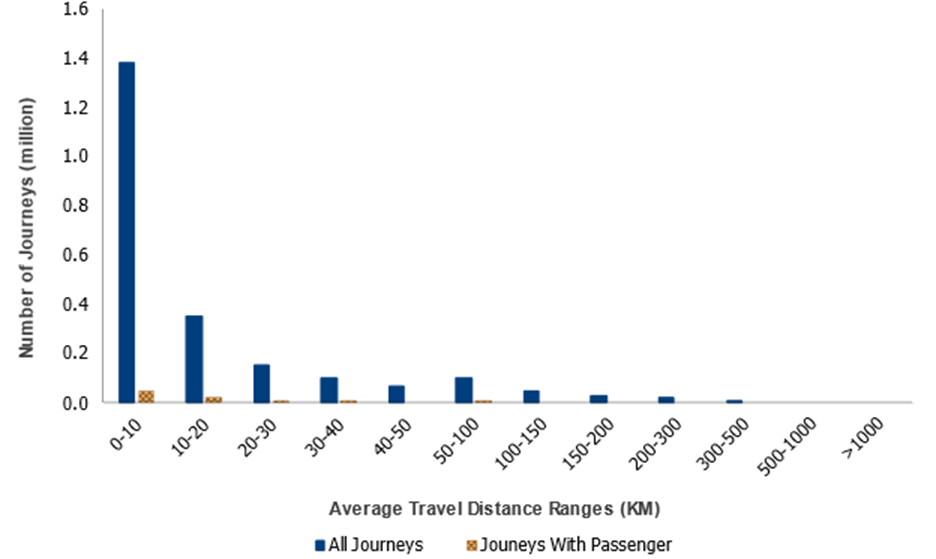
Trip distribution by trip length information is critically needed for travel demand modeling associated with transportation planning. The post-CV data analysis of the OEM CV data offers such information as illustrated in Figures 13-15. Due to privacy considerations, OEM CV data do not provide trip information, which is defined by the starting and ending points of travel. Instead, it provides only journey information, which is defined by the points where a car's engine starts and stops. Figure 13 shows the total number of journeys by travel distance. From the distribution, we can understand that journeys of less than 10 KM are predominant. Figure 14 shows the average speed, maximum speed, and average travel time for different travel distances. Figure 15 shows the journey frequency at which the front passenger seat is occupied.
Figure 13: Number of journeys by travel distances
Source: FHWA Office of Highway Policy Information.
Figure 14: Travel speed and travel time by travel distances
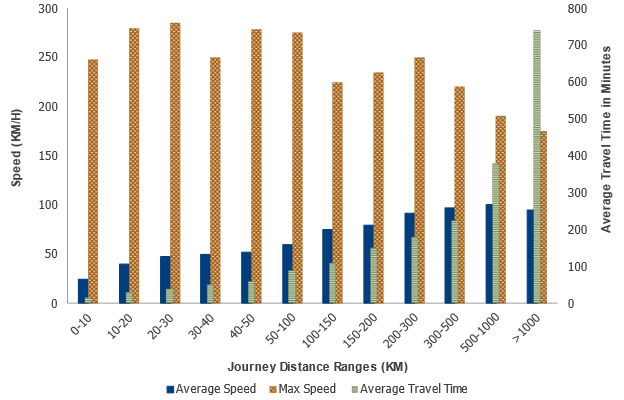
Source: FHWA Office of Highway Policy Information.
Figure 15: Frequencies of journeys occupied with front passenger by travel distances.
Source: FHWA Office of Highway Policy Information.
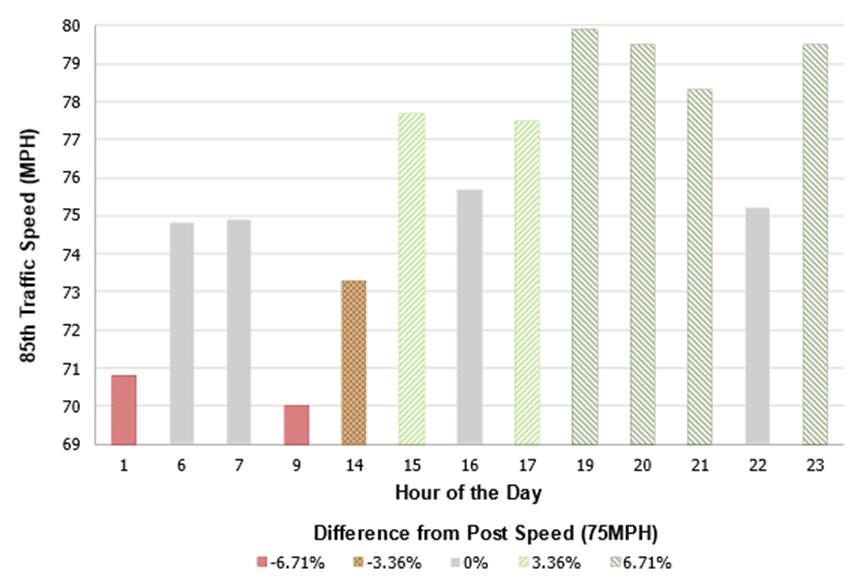
JPO Pilot post-CV TIM data file has roadside speed limit sign information, which is broadcasted to the connected vehicles. The BSM contains actual vehicle travel speed. By conflating the speed limit sign data and the actual vehicle speed information with roadway segments, the exploration further analyzed the similarities between the posted speed limits and the 85th percentile actual speeds. Figure 16 illustrates the results of the analysis along a segment of Interstate 80. Figure 17 illustrates the 85th percentile speed and the posted speed by hour of the day for a sample roadway segment.
Figure 16: Speed differences between the speed limits in TIM and the 85th percentile of actual speeds

Source: FHWA Office of Highway Policy Information.
Figure 17: Actual 85th percentile traffic speed vs posted speed by hour of the day.
Source: FHWA Office of Highway Policy Information.
The BSM data is used to count the frequencies of vehicle maneuvers characterized by acceleration and deceleration changes. These maneuver changes are integrated into the roadway geospatial alignment data. The roadway curvature analyses focused only on JPO’s Pilot WYDOT data that has coverage of many different curvature roadway segments. The hypothesis that the sharper a roadway curve is, the more maneuvers a driver may perform is not observed, though. The limited data set, for example, shows that the sharper a roadway curve is, the steadier the driver (fewer maneuvers) maintains its vehicle operation.

