U.S. Department of Transportation
Federal Highway Administration
1200 New Jersey Avenue, SE
Washington, DC 20590
202-366-4000
CV data are machine-generated by vehicles or roadway and roadside-based traffic control devices. Common assumption is that machine-generated data tend to have fewer data quality issues than manually manipulated data. The analysis of the post-CV data work indicated that CV data should not be assumed error free for post-CV usages. For example, as shown in Figure 18, almost all vehicle path history data elements in the JPO Pilot post-CV BSM file are not coded correctly. In addition, duplicative records for the same events exist. Figure 19 illustrates this type of geospatial coding error. Table 3 shows an example that locations in vehicle movement of the OEM CV data are not correct as two consecutive points are spatially separated too far away, resulting in an unrealistic calculated travel speed.
Figure 18: Wrong Path history of BSM data
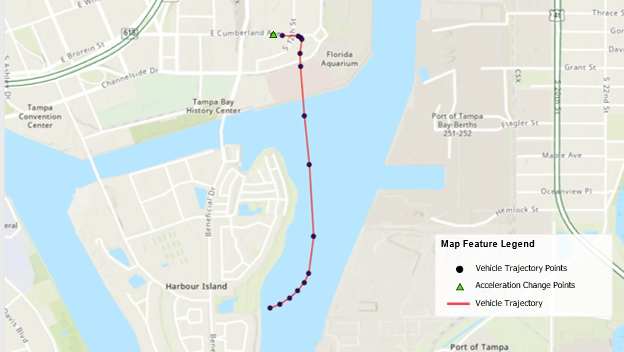
Source: FHWA Office of Highway Policy Information.
Figure 19: OEM CV data records duplicated in one area.

Source: FHWA Office of Highway Policy Information.
Table 3: Wrong locations in vehicle movements
| Journey _id |
Start_ Time |
End_ Time |
Start _Lat |
Start _Long |
End _Lat |
End _Long |
Speed _Avg |
Speed _Max |
Distance | Dura-tion | Calculated _Speed |
|---|---|---|---|---|---|---|---|---|---|---|---|
| 45a69c | 2021-07-01T11: 13:31.000 |
2021-07-01T11 :46:18.000 |
28.53476 | −82.40806 | 26.53838 | −80.07574 | 41.40 | 111.74 | 393258741 | 1967 | 719741 |
| 8cc24d | 2021-07-01T10: 51:50.000 |
2021-07-01T11: 08:12.000 |
28.53249 | −82.40768 | 28.53475 | −82.40805 | 6.92 | 88.7 | 193574091 | 982 | 709640 |
| 4a9832 | 2021-07-01T10: 34:06.000 |
2021-07-01T10: 43:53.000 |
28.49272 | −82.42498 | 26.74275 | −80.06567 | 17.73 | 85.24 | 113989705 | 587 | 699085 |
| 8bb95c | 2021-07-01T12: 00:22.000 |
2021-07-01T12: 00:52.000 |
55.03106 | −162.50066 | 28.49251 | −82.4249 | 6.678 | 16.12 | 5405219 | 30 | 648626 |

